Aggregated view
Overview (Cube)
The Cube module shows statistics and state for hosts and services grouped by the custom properties that they have been configured with. The subsets of monitored objects are then displayed in up to three dimensions for a quick overview to show the differences between them.
It is especially helpful in large environments, and can help give quick answers to questions like:
Which project uses how many servers per environment at which location/site?
How many of those are used in production?
Which operating system is used for which project and in which environment?
Are we still using Debian Lenny?
Do we have applications where the operating systems used differ in staging and production?
Which project uses which operating system version for which application?
Which projects have homogeneous environments?
Which projects are at a consistent patch level?
How many RHEL 6 variants (6.1, 6.2, 6.3…) do we use?
Who is running the oldest ones? In production?
Which projects are still using physical servers in which environments?
You can ask as many questions as you have combinations of configured custom properties. The results are displayed with as many boxes as there are values of the highest priority custom property.

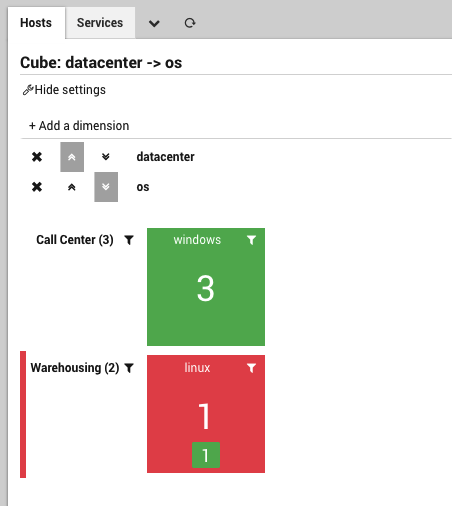
Fig. 130 Cube Dashboard
User Permissions
The Cube module checks restrictions set in the monitoring module and only shows those monitored objects that the user is allowed to view (this includes counts and states). Blacklist properties also restrict what can be viewed. Restrictions applied to other modules will have no effect.
Getting Started
To use Cube in NetEye 4, click on the “Reporting” section in the left-side navigation bar, and then the “Cube” subsection.
Note that if you haven’t yet configured any custom properties for monitored objects, you will see an empty dashboard.
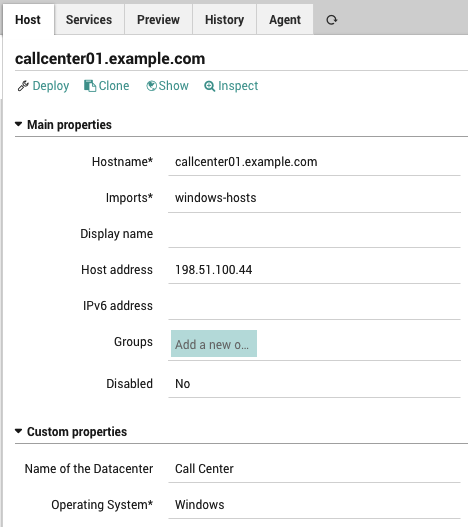
As an example, consider the custom properties “Datacenter” and “Operating System” that have been configured with values on a set of monitored objects:

Fig. 131 Host Custom Properties
You can view the resulting Cube as shown in Figure 1, where each box shows the worst state and number of hosts for each discrete value of “datacenter”. You can then further drill down and rotate the cube by adding and reprioritizing parameters (dimensions) in the dashboard.

