Test your Configuration
Test Event panel serves as a helper tool that can be applied at various stages of building your configuration.
The tool allows you to simulate incoming events (such as monitoring events, network events, email or SMS messages) in order to check if the Processing Tree was configured in a proper way, i.e. Filters’ structure is working as expected, or to test that the rules you configure will properly match those events and correctly invoke the chosen actions.
It can also appear to be helpful for checking the correctness of the data provided and conditions set at the stage of extracting variables for further usage in Rule creation.
Use the Test Panel button in the top right corner of the screen to open the panel.
Note
In order to check the correctness of a Draft without impacting the deployed configuration, make sure you’re running a test in Edit mode. If the Edit mode is set to OFF, the deployed configuration will be used for a test.
Test events can be created by providing data in a dedicated form:
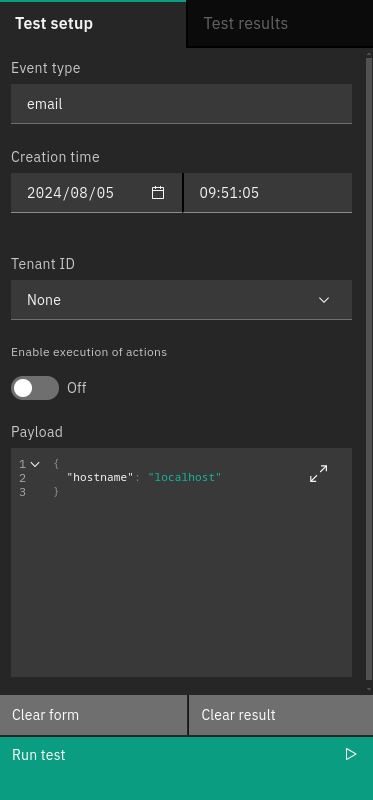
Define the Event type, e.g. email, sms, snmptrap, etc., and creation time of an Event. Tenants selection is only available for the Admin users. Please check Tornado Multitenancy for more information on running Tornado in tenant-aware installations.
Enable execution of actions option should be switched OFF in case you’re only checking the correctness of the draft, and not matching events to the rules within a ruleset.
Now you can execute a test by clicking “Run Test” button.
The Event is sent to Tornado and the outcome of the operation will be reported in the Processing Tree. Following the yellow line it is possible to see the path that the event has taken. The nodes that have matched the event are distinguishable by a full yellow lightning bolt while those partially matched have an empty bolt.
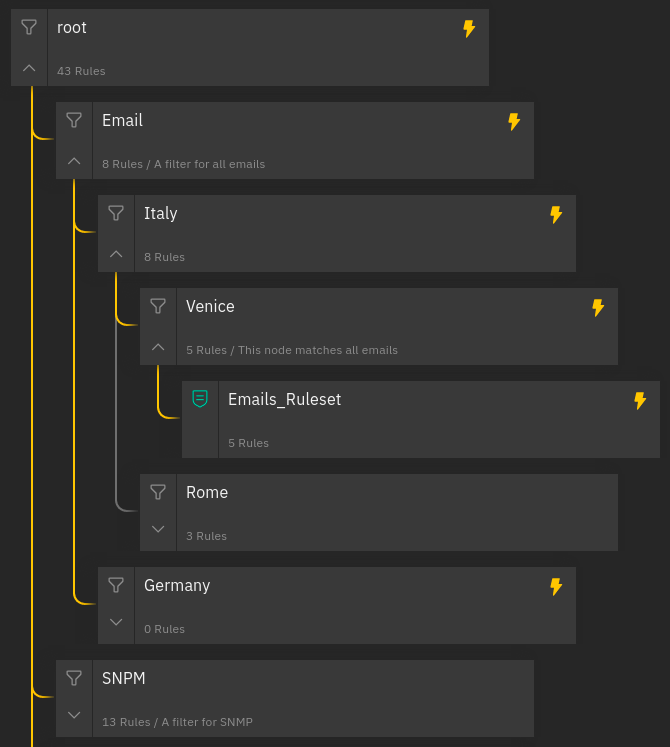
Fig. 144 A Processing Tree with an event result
While checking if an Event matches the rules within the ruleset, for indication of the test outcome one of the following states is used:
matched: If a rule matched the Event.stopped: If a rule matched the Event and then stopped the execution flow. This happens if thecontinueflag of the rule is set to false.partially matched: If where condition of the Rule was matched but it was not possible to process the required extracted variables.not matched: If the rule did not match the Event.
In Test Result tab, the list of triggered actions, extracted and not extracted variables can be found. In case of errors, they will be displayed in the related Notifications panel. In this panel, unlike graphically in the processing tree, all errors will be shown regardless of their origin, including all errors generated within an iterator node’s branches. Clicking any of the encountered errors will automatically focus on the corresponding variable or action in the Processing Tree that originated it. The scope of errors is global, and unless it originated within an iterator node, will be graphically shown in the whole processing tree even if no rulesets have been selected. If it originated within an iteration instead, the error will be visible in the processing tree only when that specific iteration is selected in the test result panel.
Please note that whenever multiple actions are being tested sequentially inside a rule, and an error is encountered on any of them, the execution flow will be stopped and the following actions will not be tested until the error is fixed.
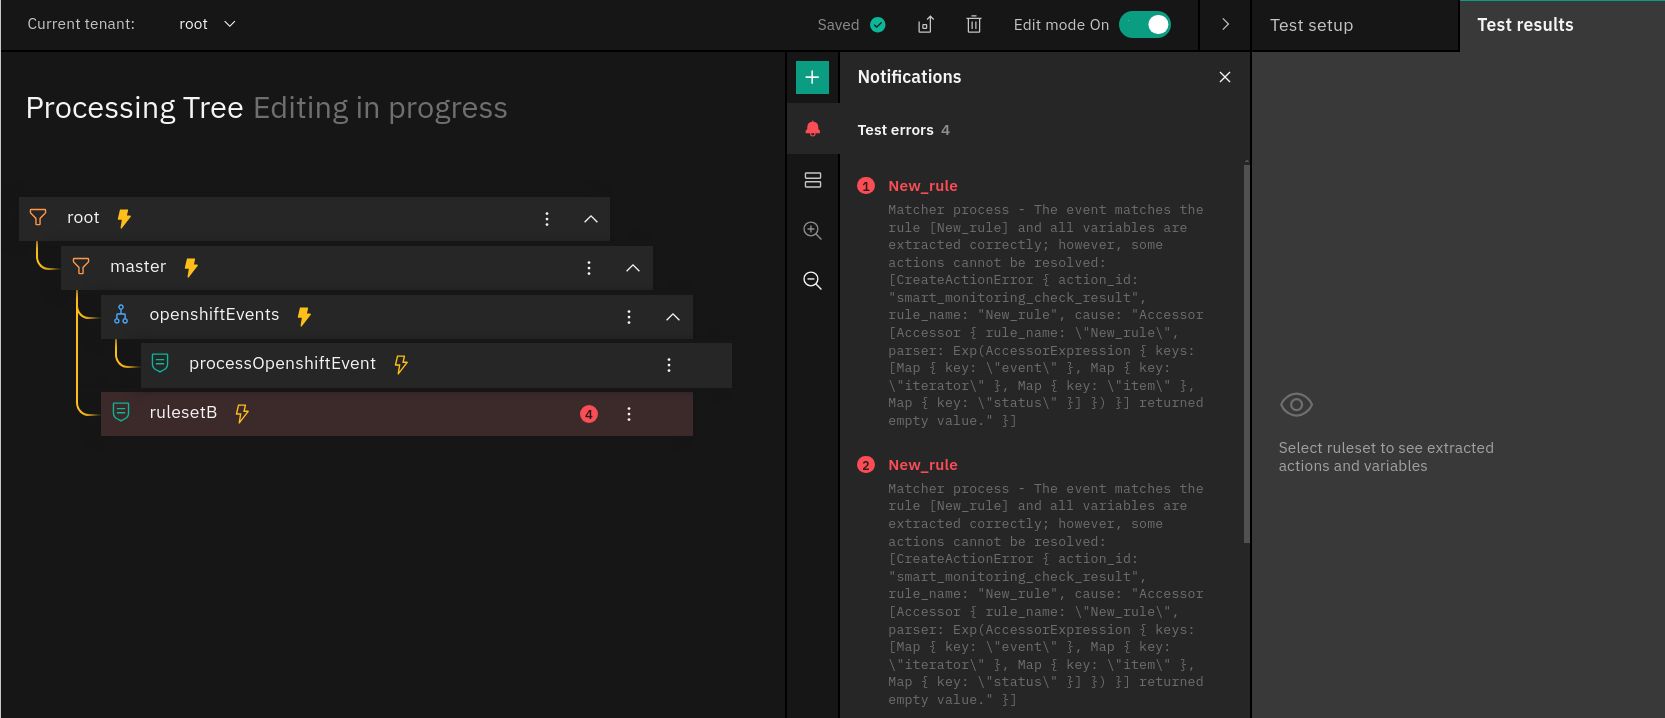
Fig. 145 Errors are displayed all over the Processing Tree
If no ruleset is selected when running the Test Event, only errors will be shown but there will be no test results available.
Please select a Ruleset to see the results as prompted in the UI or click on an error to see where it was generated.
As soon as you select the desired ruleset, the list of extracted variables and triggered actions related to this ruleset is displayed. Click on one of the extracted variables to see the details of the WITH tab of a corresponding rule in the Processing Tree.
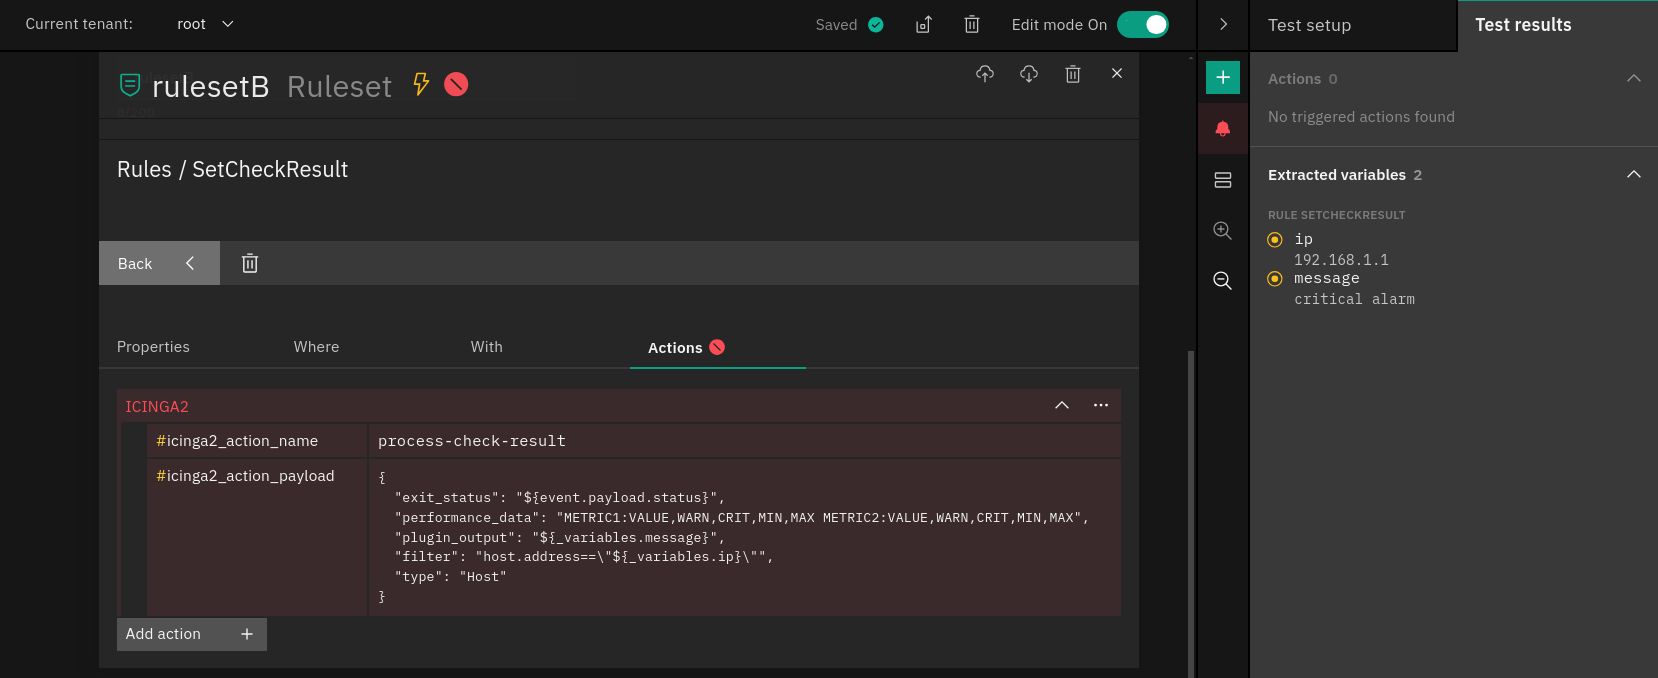
Fig. 146 Automatic focus on rule action or variable with errors detected
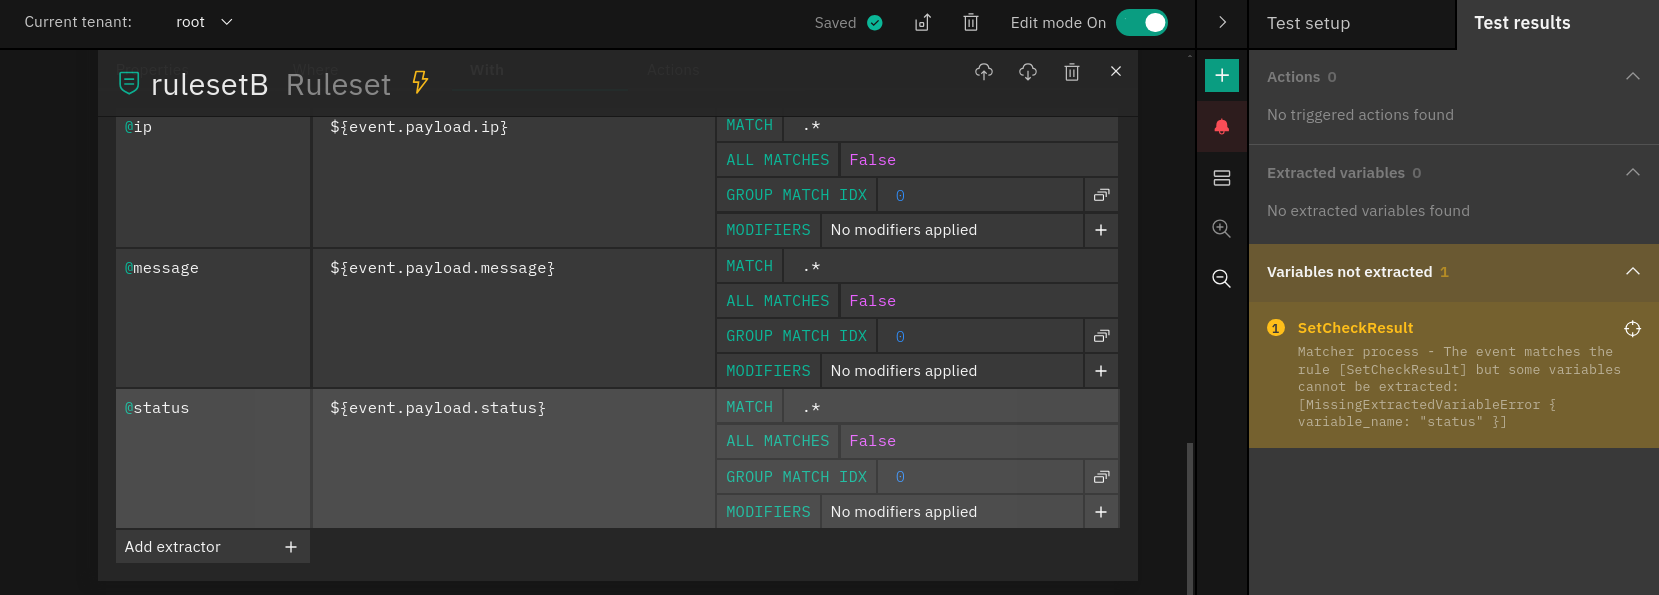
Fig. 147 Automatic focus on rule WITH once the variable is clicked
Same behaviour applies to actions results. You can also see a complete payload by expanding the action result, and copy the payload in expanded view.
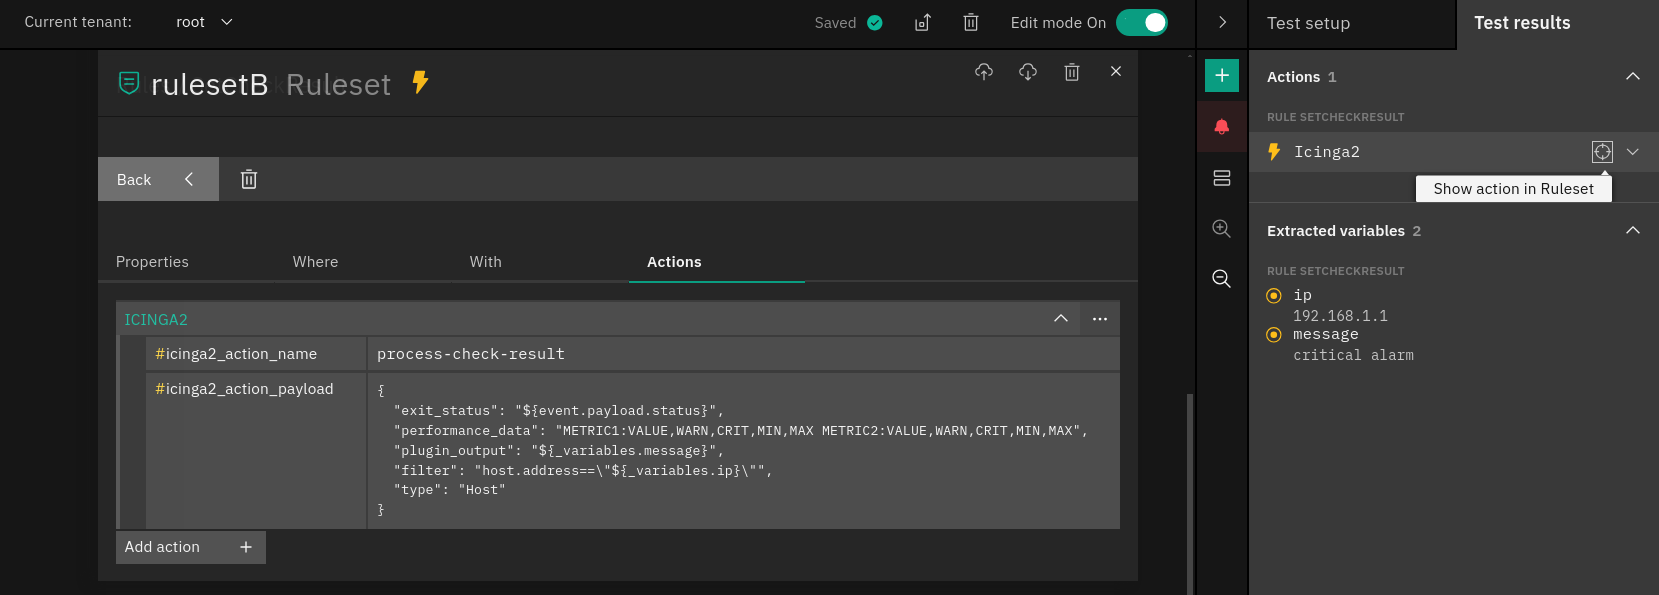
Fig. 148 Executed action with expanded payload
In case an Iterator node or any of its children is selected, the iterations panel will appear. This panel allows to easily view all iterations that occurred during the test and inspect them one by one.
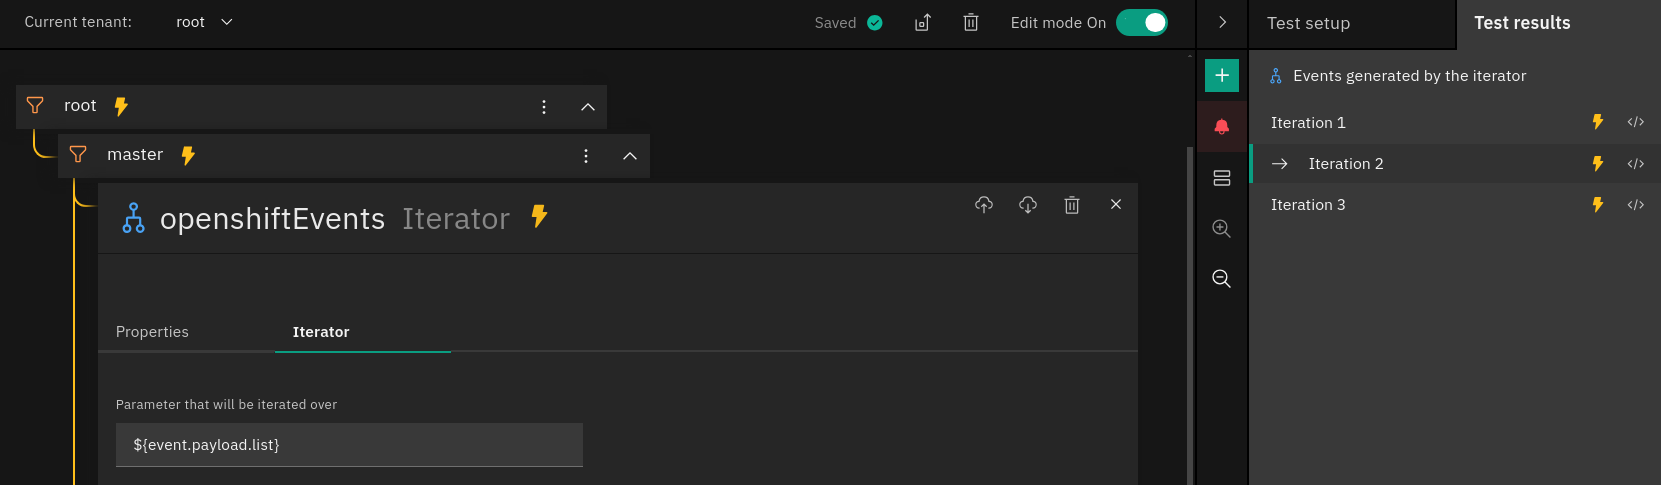
Fig. 149 List of iterations related to an Iterator node
When a ruleset is selected, for each iteration it is possible to see whether that iteration was matched or partially matched by the ruleset. On top of that, any error that was generated within that specific iteration will also be graphically shown in the processing tree.
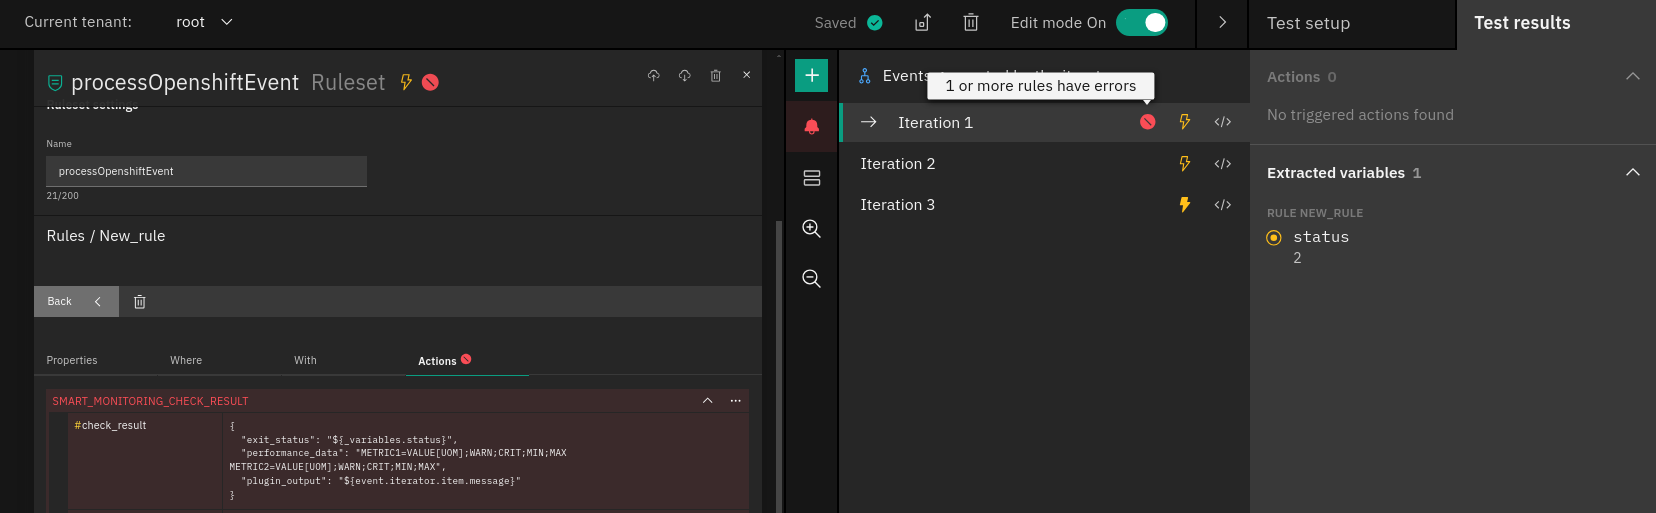
Fig. 150 Ruleset with a selected iteration
With an iteration being selected, the extracted variables, actions, non-extracted variables shown in the Test Result tab, and errors shown in the processing tree will be contextual to the selected iteration and will be displayed in the Test Result tab.