Performance Graphs
In each monitored object page, a Performance Graph containing its metrics is visible. This graph is based on the mapping defined in Configuration > Grafana Graphs.
Mapping performance graphs to Services and Checkcommands
When adding new checkcommands to NetEye, the default representation of performance data, as a unitless counter, is often not adequate for display in the monitoring objects detail page.
In NetEye this performance graph visualization can be adapted by linking the name of a checkcommand or a service name to a ITOA Dashboard.
The following procedure describes how to do it:
Create a new dashboard related to the performance data of the desired check in ITOA Main Org. with as many panels as you need. In the queries, the variables $hostname, $service and $command can be used.
Go to the mappings configuration of Grafana module. From NetEye main menu Configuration > Modules > Grafana Graphs
Open the form to add a new mapping by clicking on the Add New Grafana Graph button.
The Name field must be equal to either the check name or the service name. This is the field that is used to find the right monitored object where to show the mapped performance graph.
The Dashboard field must contain the exact name of the dashboard created in the ITOA Main Org..
The Dashboard-UID field must contain the exact UID of the dashboard created in the ITOA Main Org..
Warning
The neteye_secure_install configures the mapping for most checkcommands out of the box. If a mapping has been modified for a checkcommand, this mapping will be overwritten with the NetEye default configuration.
Custom Dashboards for Hosts and Services
When you need to go beyond having a single, default dashboard for every host/service, it’s time to make a customized dashboard for those hosts/services that need them.
The following steps will guide you through the creation of a custom link that will point to the customized dashboard. The link will be visible in the monitored object Actions section.
If you need to create a custom dashboard for a particular service/host, you can set the parameter in Director’s service/host configuration. The custom dashboard should be specified as dataSource/dashboardName.
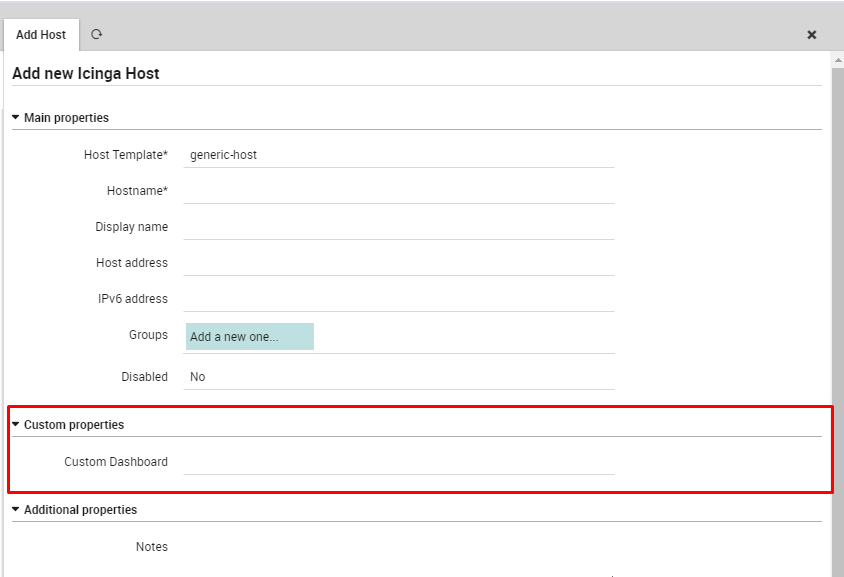
Fig. 131 ITOA hook configuration
The following steps show how you can create just such a custom dashboard field (for a service, follow the procedure below while starting from a service configuration rather than from a host).
First, click on Director in the left navigation sidebar, scroll to the bottom of the page, and select “Define Data Field” (Figure 2).
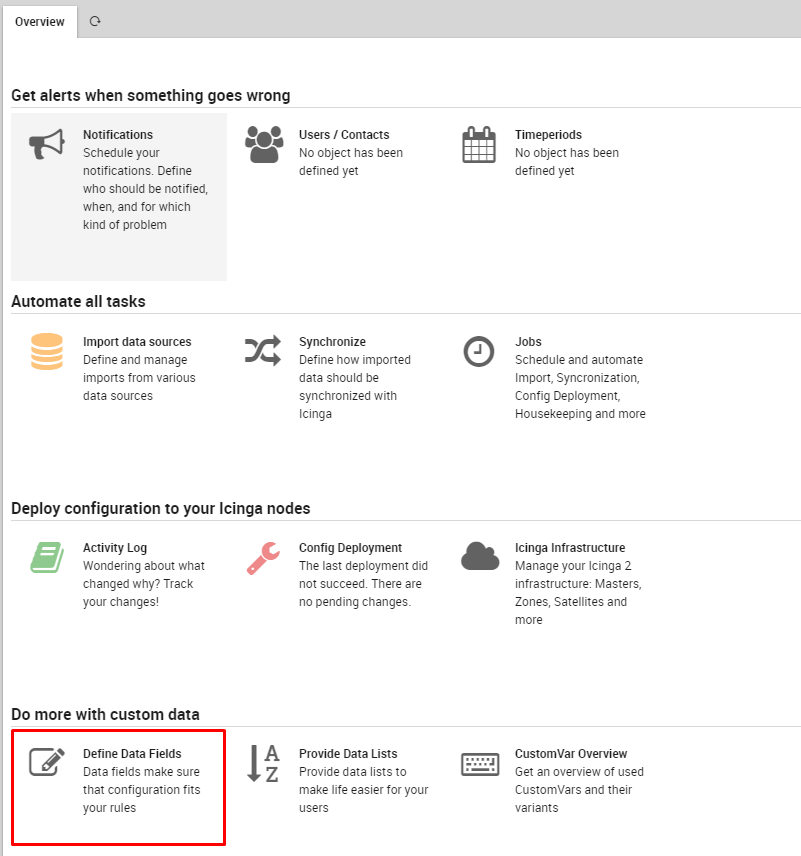
Fig. 132 Director Data Field
Now click “Add” and create a field with the field name set to custom_analytics_dashboard, then enter a caption of your choice (like “Custom Dashboard” in Figure 3).
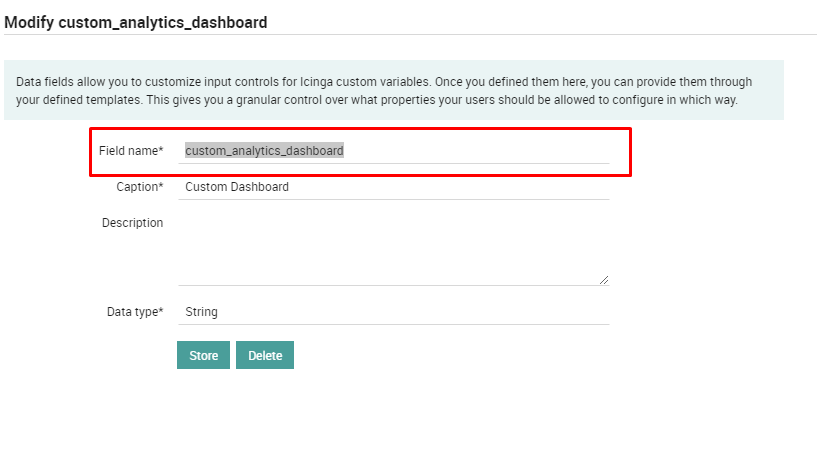
Fig. 133 Custom ITOA Dashboard Field
Once you add the new data field, you should add it to a service/host template. Open an existing template or create a new one (the same procedure works both for hosts and services). Click on the Fields tab, select the custom_analytics_dashboard field in the drop down box, and add that field to the template. (Do not set it as mandatory, because not all hosts/services will have or need a custom ITOA dashboard.)
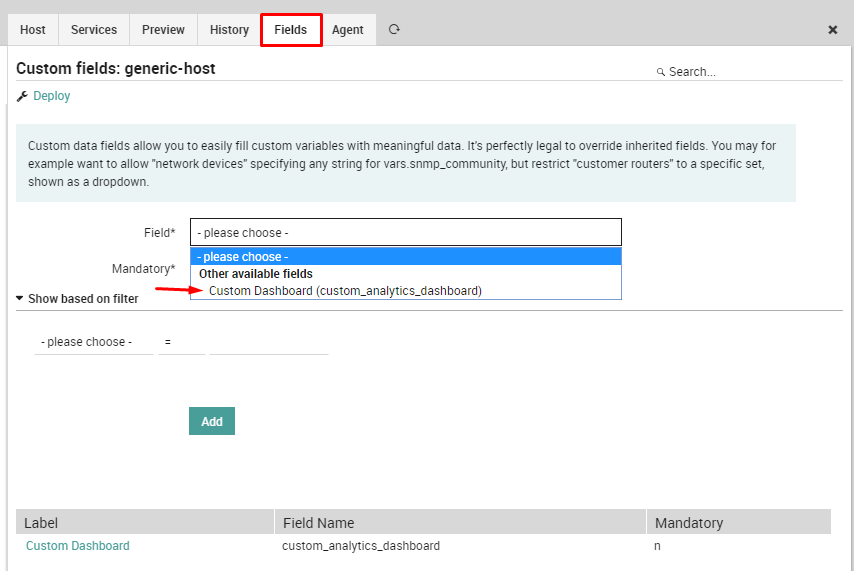
Fig. 134 Add Custom Field To Template
Lastly, deploy the final configuration. Now you can create a new host/service starting from the modified template and add a custom ITOA dashboard to it.
This website uses cookies that store your theme preferences. These cookies do not store any personally identifiable data.