Monitored Objects
Managing Fields
This example wants to show you how to make use of the Array data
type when creating fields for custom variables. First, please got to the
Dashboard and choose the Define data fields dashlet:
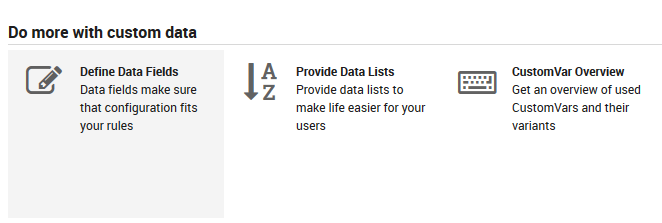
Fig. 32 Dashboard - Define data fields
Then create a new data field and select Array as its data type:
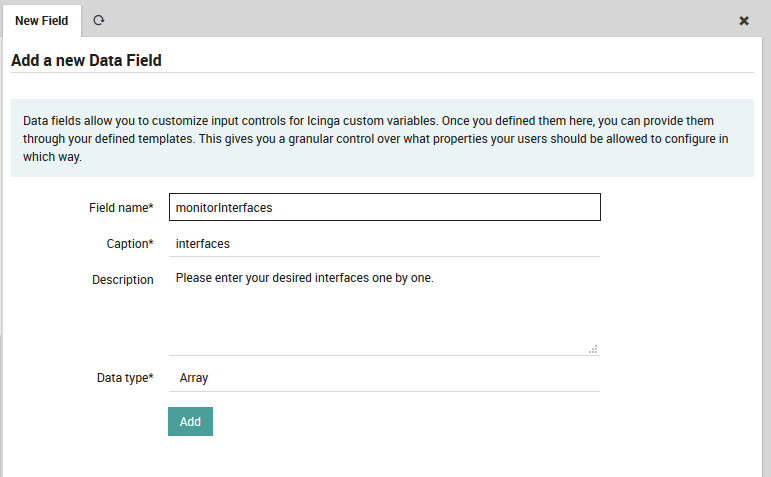
Fig. 33 Define data field - Array
Then create a new Host template (or use an existing one):
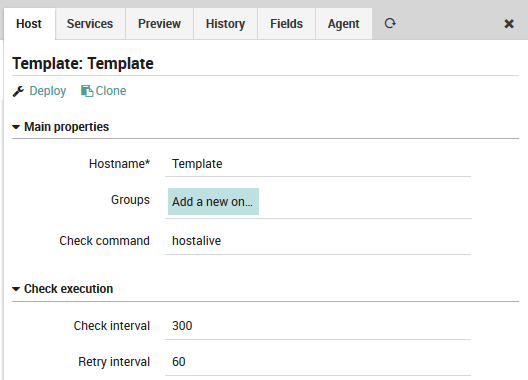
Fig. 34 Define host template
Now add your formerly created data field to your template:
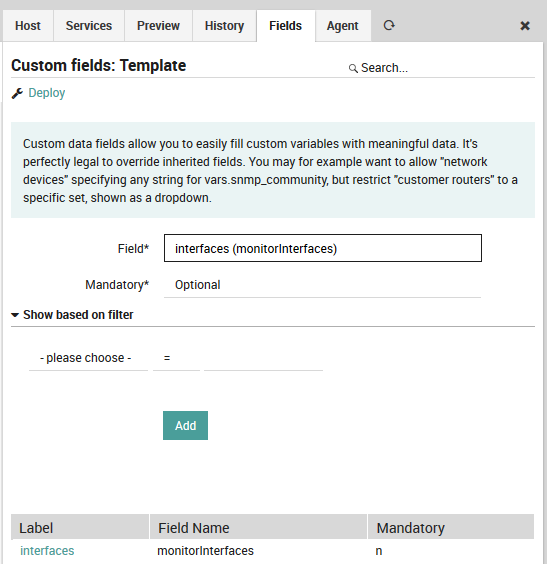
Fig. 35 Add field to template
That’s it, now you are ready to create your first corresponding host. Once you add your formerly created template, a new form field for your custom variable will show up:
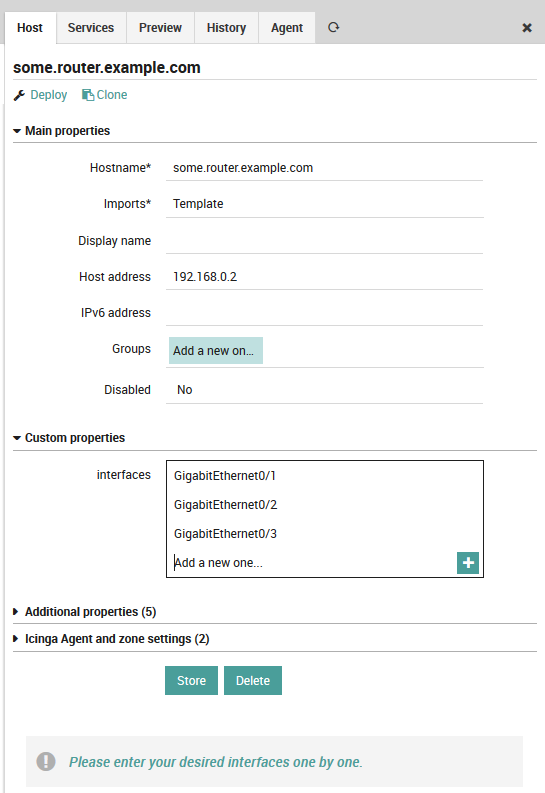
Fig. 36 Create host with given field
Have a look at the config preview, it will show you how your
Array-based custom variable will look like once deployed:
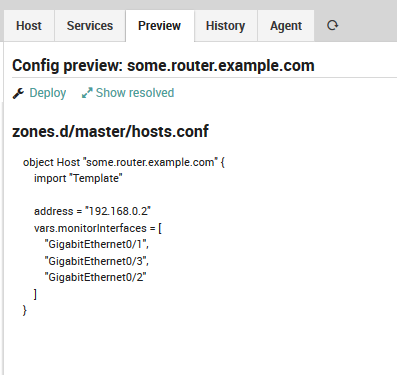
Fig. 37 Host config preview with Array
Data Fields example: SNMP
Ever wondered how to provide an easy to use SNMP configuration to your
users? That’s what we’re going to show in this example. Once completed,
all your Hosts inheriting a specific (or your “default”) Host Template
will provide an optional SNMP version field.
In case you choose no version, nothing special will happen. Otherwise,
the host offers additional fields depending on the chosen version.
Community String for SNMPv1 and SNMPv2c, and five other
fields ranging from Authentication User to Auth and Priv
types and keys for SNMPv3.
Your services should now be applied not only based on various Host
properties like Device Type, Application, Customer or
similar - but also based on the fact whether credentials have been given
or not.
Prepare required Data Fields
As we already have learned, Fields are what allows us to define
which custom variables can or should be defined following which rules.
We want SNMP version to be a drop-down, and that’s why we first define a
Data List, followed by a Data Field using that list:
Create a new Data List
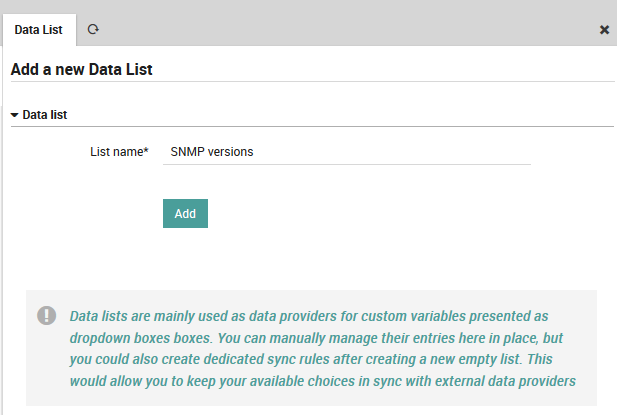
Fig. 38 Create a new Data List
Fill the new list with SNMP versions
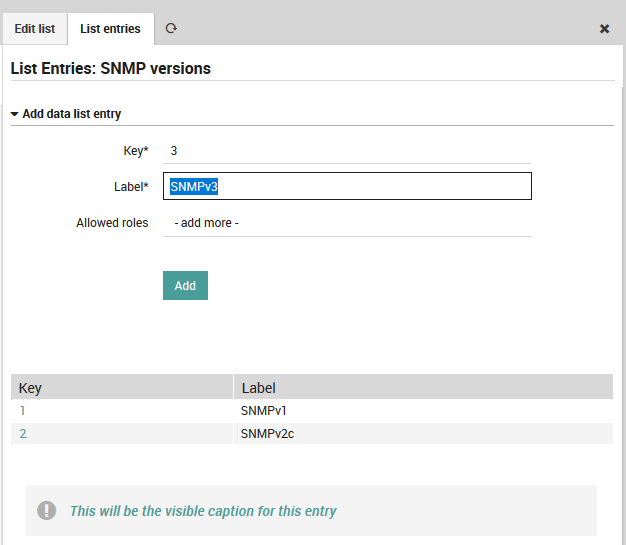
Fig. 39 Fill the new list with SNMP versions
Create a corresponding Data Field
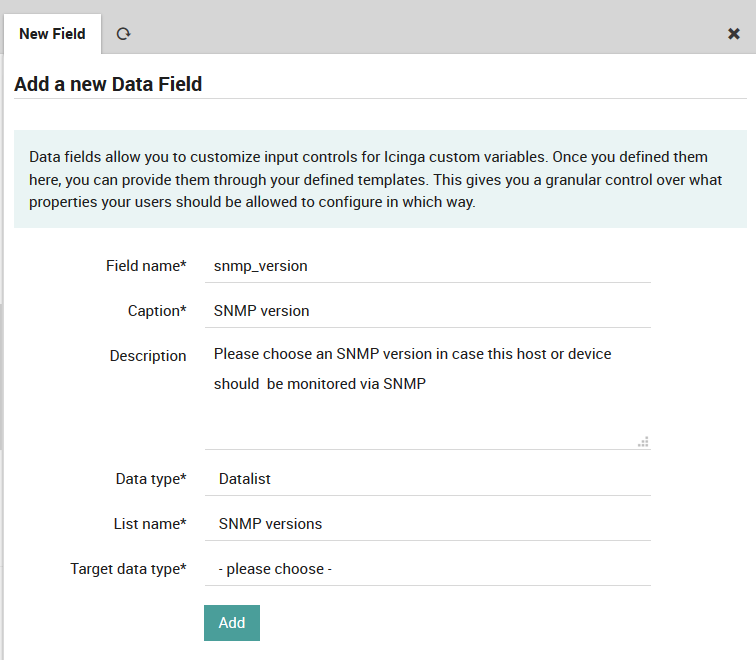
Fig. 40 Create a Data Field for SNMP Versions
Next, please also create the following elements:
a list SNMPv3 Auth Types providing
MD5andSHAa list SNMPv3 Priv Types providing at least
AESandDESa
Stringtype fieldsnmp_communitylabelled SNMP Communitya
Stringtype fieldsnmpv3_userlabelled SNMPv3 Usera
Stringtype fieldsnmpv3_authlabelled SNMPv3 Auth (authentication key)a
Stringtype fieldsnmpv3_privlabelled SNMPv3 Priv (encryption key)a
Data Listtype fieldsnmpv3_authprotlabelled SNMPv3 Auth Typea
Data Listtype fieldsnmpv3_privprotlabelled SNMPv3 Priv Type
Please do not forget to add meaningful descriptions, telling your users about in-house best practices.
Assign your shiny new Fields to a Template
I’m using my default Host Template for this, but one might also choose
to provide SNMP version on Network Devices. Should Network Device be
a template? Or just an option in a Device Type field? You see, the
possibilities are endless here.
This screenshot shows part of my assigned Fields:
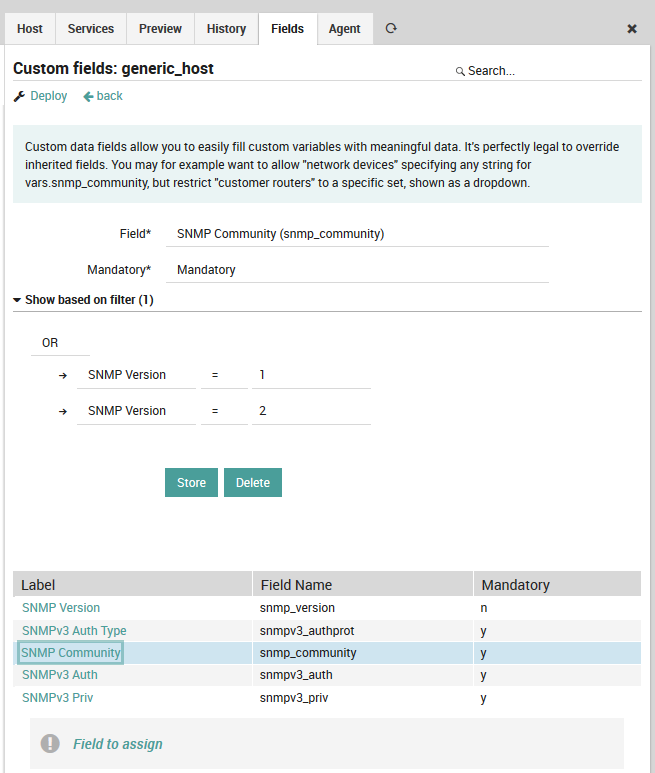
Fig. 41 SNMP Fields on Default Host
While I kept SNMP Version optional, all other fields are mandatory.
Use your Template
As soon as you choose your template, a new field is shown:
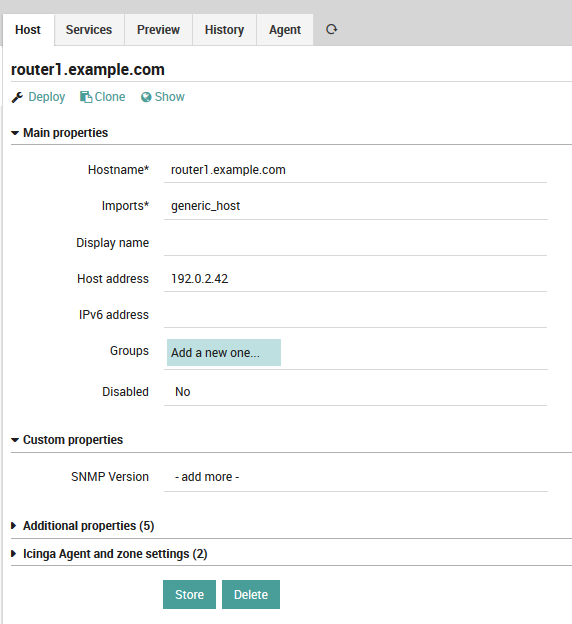
Fig. 42 Choose SNMP version
In case you change it to SNMPv2c, a Community String will be
required:
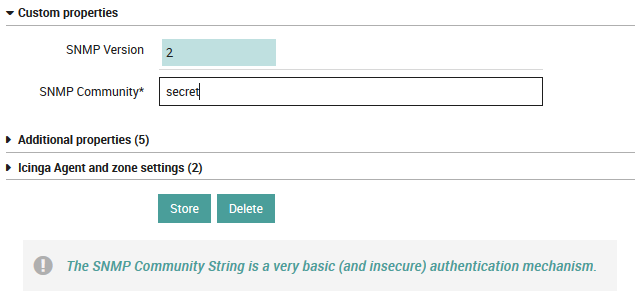
Fig. 43 Community String for SNMPv2c
Switch it to SNMPv3 to see completely different fields:
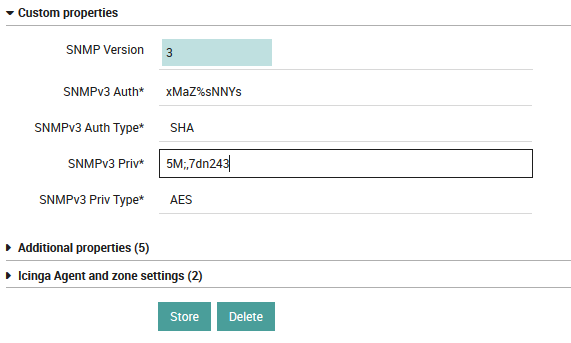
Fig. 44 Auth and Priv properties for SNMPv3
Once stored please check the rendered configuration. Switch the SNMP versions forth and back, and you should see that filtered fields will also remove the corresponding values from the object.
Managing Templates
Templates allow you to inherit properties from parent objects to their children, allowing you to add and change configurations for hundreds of monitored objects with a single click. In Icinga2, every monitored object must have at least one parent template. Thus before adding hosts and services, you must first create host templates and service templates, respectively.
Host Templates
To create a new host template, go to Icinga Director > Host objects > Host Templates. If you are starting with an empty installation, you will see a blank panel with actions labelled “back”, “Add” and “Tree”. Otherwise, you will also see the pre-installed NetEye host templates. You can click “Add” to create a new template as shown on the left side of Fig. 45. Each template will have its own row in the “Template Name” table, and you can use the “Tree” action to switch between Table (flat) and Tree (inheritance) views of the templates.
In an empty installation, the first template will automatically be the top-level host template. Otherwise you will see a “+” icon to the right of the template’s row that will allow you to create a monitored host that is an instance of that host template. The circular arrow icon instead will show you the history panel for that template and let you initiate deployment if desired.
Once you click “Add”, the host template panel will appear to the right. This panel can be used both to add a new template as well as modify an existing template. In the latter case, the green button at the bottom of the panel will change from “Add” to “Store”. At the top is a “Deploy” action if you prefer to immediately write out the template configuration, and a “Clone” action to create a copy of an already-created template.
To create a new host template, fill in the following fields (in general you can click on the title of a field to see instructions in a dialog at the bottom of the panel):
Main Properties:
Name: The name of the template which will appear in the template panel and can be referenced when defining hosts.
Imports: The parent template of the current template if it is not the root.
Groups: Here you can add a host group if you have defined one.
Check command: The default check command for the host as a whole (typically “hostalive” or “ping”)
Custom properties: If you have defined custom fields in the “Fields” tab at the top, they will appear here, otherwise this section will not be visible.
Check execution: Here you can define the parameters for when a command check is run.
Additional properties: Allows you to set URLs and an icon which will appear in the monitoring view.
Agent and zone settings: Allows you to choose whether the host uses agent-based monitoring or not. For more information, see the Active Monitoring section, or the official documentation, which describes distributed monitoring setups in great detail.
Finally, click on “Add” or “Store” to store the template in working memory. You must deploy the template to effect any changes in your monitoring environment.
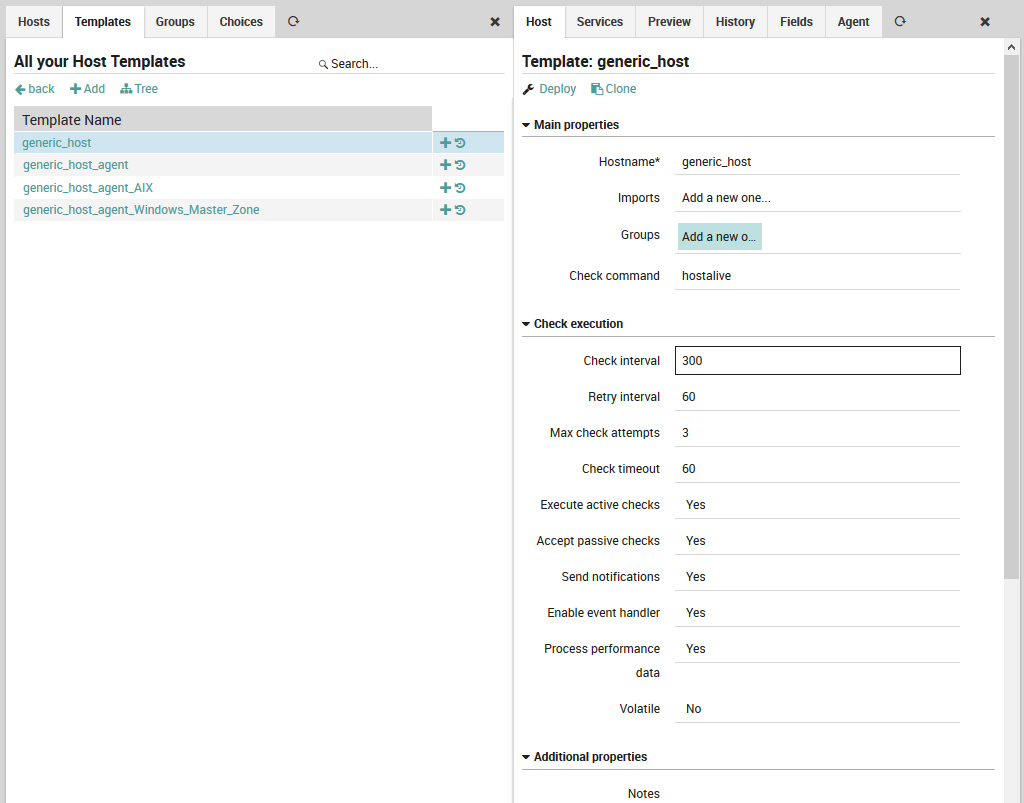
Fig. 45 Creating a host template
Host templates support inheritance, so we can arrange host templates in an hierarchy. The host templates panel at the left of Fig. 46 shows the Tree view of all host templates. In the example in the template panel to the right, the template for “generic_host_agent”, you can see that the “Imports” field has been set to “generic_host”, and in fact in the host templates panel generic_host_agent can be found under generic_host in the hierarchy.
Because this template inherits from another, the default values for checks are inherited from the values we filled in the generic_host template in Fig. 45. In addition, the source of inheritance is mentioned for each field. If we were to override some of the values in this template, and then create a third host template under this one, then the fields in the third host template would reflect whether they were inherited from generic_host or generic_host_template.
There is a subtle case, however, in which inheritance is not working and involves the host group. We clarify this with an example.
Suppose a ACME_host_template host template exists, which has defined
a group ACME-all-hosts. We define now a template
ACME-host-Bolzano-template which inherits ACME_host_template
(and therefore also group ACME-all-hosts). Finally, we create also a
Role which has a director/filter/hostgroups restriction on the
ACME-all-hosts host group.
At this point, against the expectation, users with non-administrative access and possessing this Role, when adding a new host using template ACME-host-Bolzano-template will not be able to see that the host they create are member of group ACME-all-hosts.
In order to let these hosts appear as part of the ACME-all-hosts host group, you need to assign the host group ACME-all-hosts directly to the ACME-host-Bolzano-template host template.
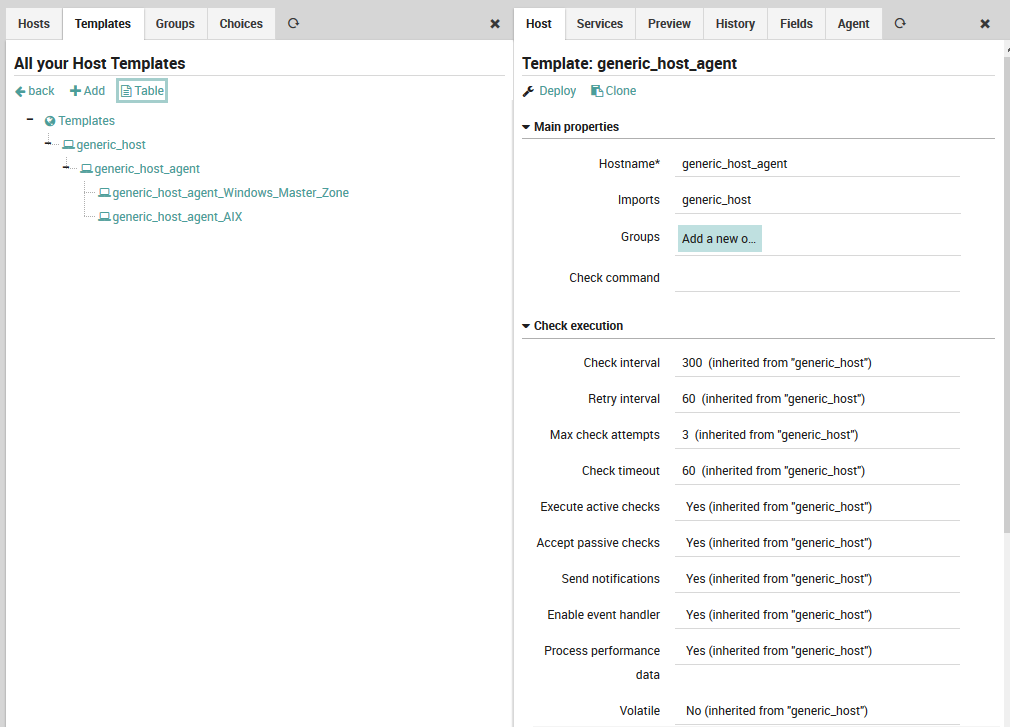
Fig. 46 Tree view of an intermediate host template
Beyond the Host tab, there are five additional tabs which are described briefly here:
Services: Add a service template or service set that will be inherited by (1) every host template under this template and (2) host defined by this template.
Preview: View the configuration as it will be written out for Icinga2.
History: See a list of past deployments of this template. By clicking on “modify”, you can see what changed from the previous version, see the complete previous version, and you can even restore the previous version.
Fields: Create custom fields (and variables for their values) that can be filled in on the host template under the section “Custom properties”. The custom field panel will let you name the field, force a field’s value to be set, and determine whether to show a field based on a user-definable condition.
Agent: Create a self-service API key that will allow Icinga2 to integrate Icinga agents installed on the monitored hosts.
Command Templates
To create a new command template, go to Icinga Director > Commands > Command Templates. The command templates panel (Fig. 47) is similar to that for hosts: it lists all command templates either in a table or tree view, and allows you to add a new command template.
Unlike hosts and services, you can create commands that do not inherit from a command template. However, command templates can be especially useful when you need to share a common set of parameters across many similar command definitions. Also unlike hosts and services, you can inherit one command check from another command check without every creating a command template.
There is also a third category of commands called “External Commands”, which is a library of pre-defined commands not created in Director, and thus not modifiable (although you can add new parameters). External commands include ping, http and mysql.
Clicking on “Add” brings up the command template creation panel on the right. As with host templates, left-clicking on a field name will display a brief description at the bottom of the screen, the green “Add” or “Store” button at the bottom of the panel will change the configuration in memory, the “Deploy” action lets you immediately write out the template configuration, and the “Clone” action will create a copy of an existing template.
The following fields are found in the command template creation panel (Fig. 47):
Command type: Choose a particular command type. These are described in the official Icinga2 documentation.
Plugin Commands: Plugin check command, Notification plugin command, and Event plugin command.
Internal Commands: Icinga check command, Icinga cluster check command, Icinga cluster zone check command, Ido check command, Random check command, and Crl check command.
Command name: Here you can define the name you prefer for the command template.
Imports: Choose a command template to inherit from (leave this blank to create a top-level template).
Command: The command to be executed, along with an optional file path.
Timeout: An optional timeout.
Disabled: This allows you to disable the given check command simultaneously for all hosts implementing this command template.
Zone settings: Select the appropriate cluster zone. For small monitoring setups, this value should be “master”.
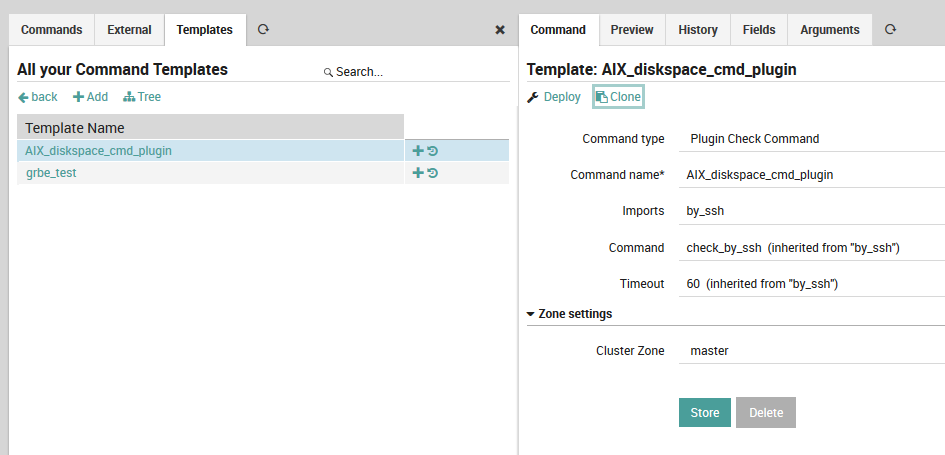
Fig. 47 Adding a new command template
Like the host template panel, here there are additional tabs for Preview, History, and Fields. There is also an Arguments tab (Fig. 48) to allow you to customize the arguments for a particular command. You must create a new command arguments configuration for each argument (using pre-defined command templates can thus save you a significant amount of time).
The most important fields are (click on any field title to see its description at the bottom of the panel):
Name: The name of the argument as it will appear in the command, e.g.
--hostname.Value type: Use type String for standard variables like
$host$.Value: A numeric value, variable, or pre-defined function.
Position: The position of this argument relative to other arguments, expressed as an integer.
More information can be found at the official Icinga2 documentation.
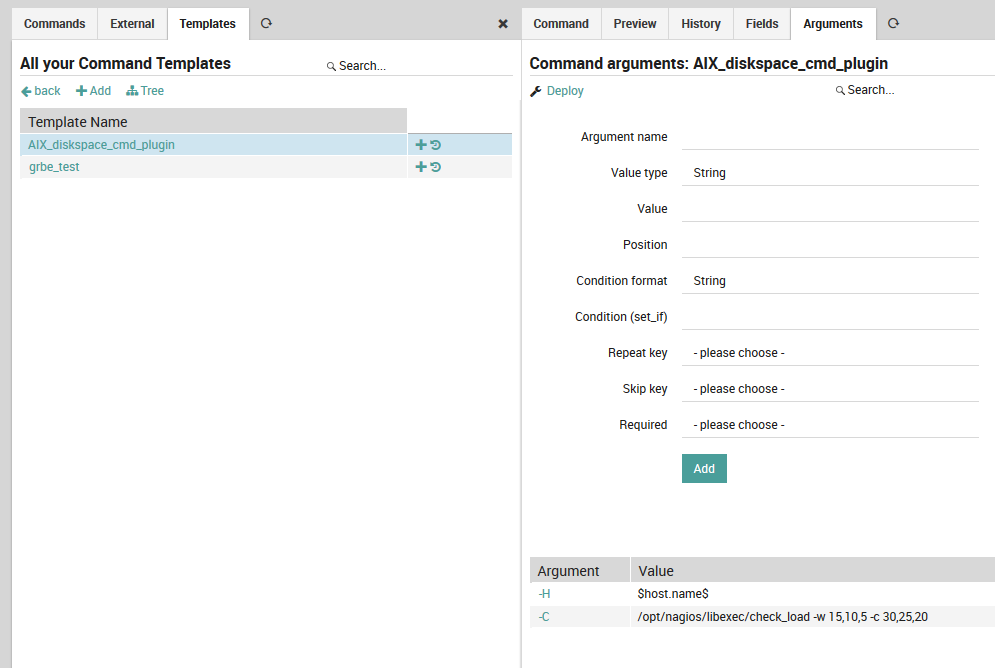
Fig. 48 Adding arguments to a command
Service Templates
To create a new service template, go to Icinga Director > Monitored Services > Service Templates. The services templates panel (Fig. 49) is similar to that for hosts and commands: it lists all service templates either in a table or tree view, and allows you to add a new service template. As for the other templates, clicking the “+” icon at the right of the row will display a panel to add a monitored service as an instance of the corresponding service template, and the circular arrow action will show you that service template’s history panel (activity log).
The new service template panel (Fig. 49) asks you to fill in the following fields:
Name: The name of this service template.
Imports: Specify the parent service template, if one is desired.
Check command: A check to run if it is not overridden by the check for a more specific template or service object, typically from the Icinga Template Library
Run on agent: Specifies whether the check is active or passive.
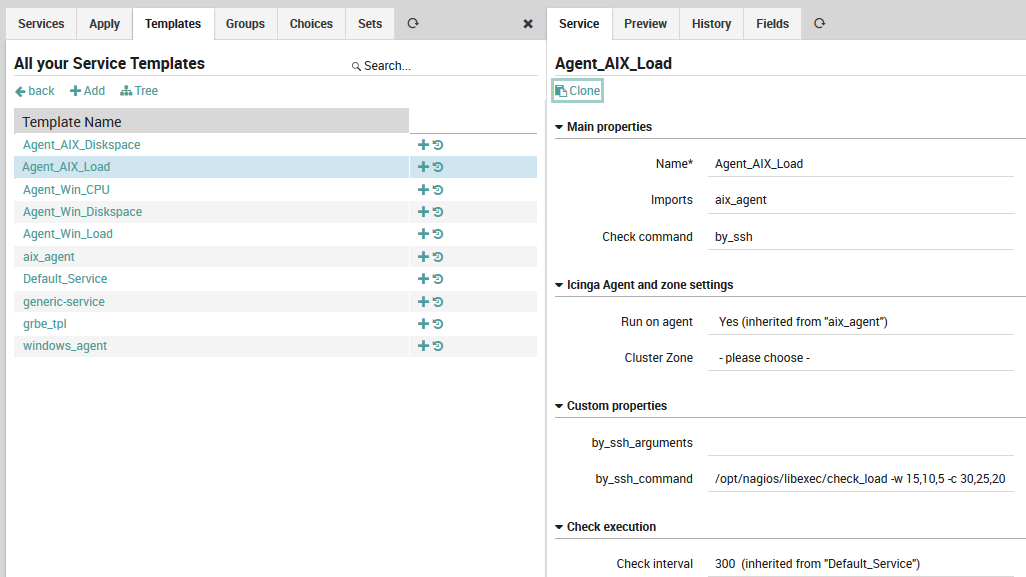
Fig. 49 Creating a service template
As Fig. 49 shows, the check commands on lower-level service templates and monitored services are typically much more detailed. Here, a custom field holds the command to be executed over an SSH connection to a host running AIX.
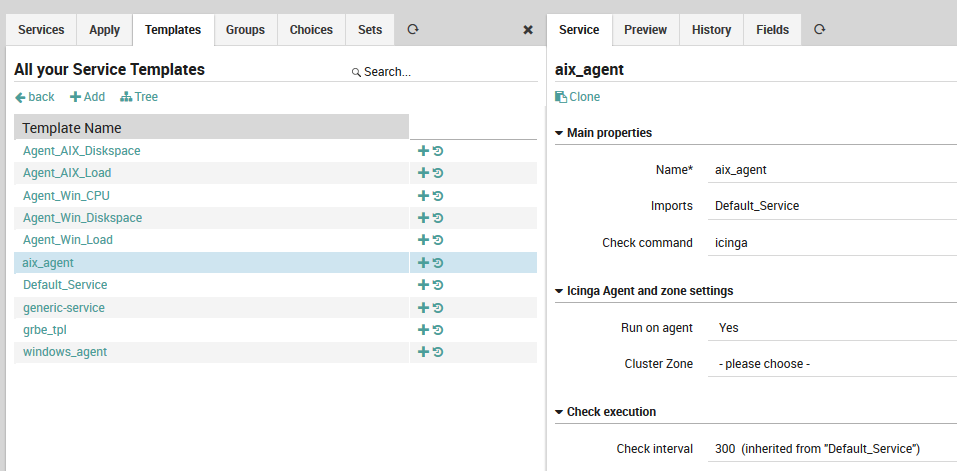
Fig. 50 A low-level service template.
Manage Templates to support Multi-Tenancy
Data security is a major concern in multi-tenancy environments, where sensitive information used in the monitoring configuration of one tenant must not be visible to other tenants after a deployment.
This kind of isolation cannot be solved by the director-global zones because they are not adequate for separation of sensitive information, due to the fact that their contents are distributed among all master, satellites, and agent nodes. Multi-tenancy environments must implement another strategy which is to create a host template for each zone owned by the tenant.
With this strategy, the host template data will be sealed inside the only zone owned by the tenant and will not be visible to other tenants.
Please refer to the How To section that explains how to create a template for each zone to support the multi-tenancy.
Template Configuration
To create host template to support multi-tenancy, please go to the
, click on the “+”
icon and fill the required fields along with the Cluster Zone information which
should be an Icinga Zone belongs to a tenant:
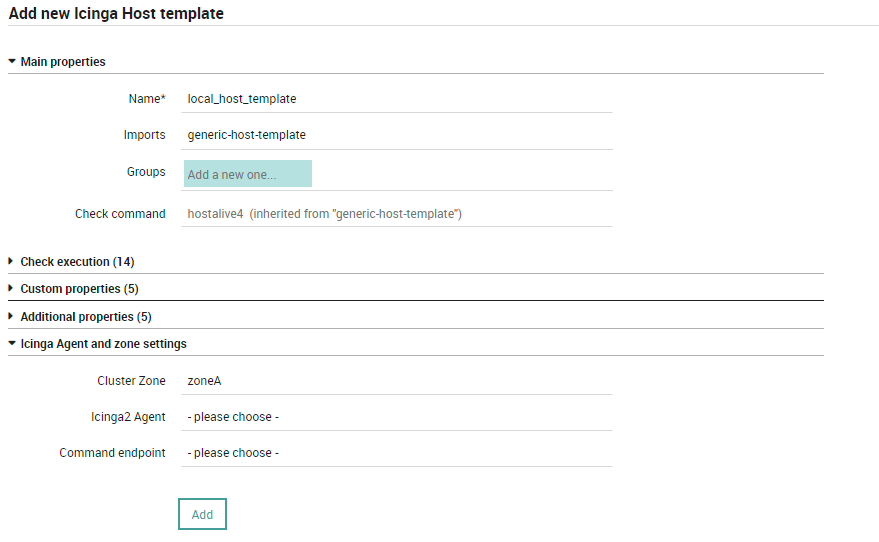
Fig. 51 Creating a host template with Cluster Zone
Finally, click on “Add” to store the template in working memory. You must deploy the template to push the changes in your monitoring environment.
Warning
No sensitive data must be stored on service templates. Please use the host templates for this purpose.
When there is more than one Icinga Zone for a single tenant, you will need to create duplicate
host templates, which are identical except for the Cluster Zone value.
Let’s understand it with an example:
Suppose in a multi-tenancy environment, one of the tenant (i.e., tenantA) has 3
satellites Sat_CloudA, Sat_CloudAA and Sat_Internal and they are in the following
zones:
Zone
cloud=Sat_CloudAandSat_CloudAAZone
local=Sat_Internal
Now, let’s assume they all are checking the same service which requires the same credentials.
In that case, you need 2 identical host templates i.e., cloud-template and local-template
except for Cluster Zone value which will be cloud for cloud-template and
local for local-template.
This additinal configuration is required, because there is no way for the director to deploy a
host template that contains sensitive information in both zones (cloud and local) while
maintaining data secrecy.
Note
You don’t have to touch the service templates since they must not contain sensitive data.
Managing Monitoring Objects
Once you have created templates for hosts, commands and services, you can begin to create instances of monitored objects that inherit from those templates. The guide below shows how to do this manually. In addition, hosts can be imported using automated discovery methods, while services and commands can be drawn from template libraries.
Adding a Host
The New Host Panel (Fig. 52) is similar to the template panels, and is accessible from Director > Host objects > Hosts. Each row in the panel represents a single monitored host with both host name and IP address. Clicking on the host name shows the Host Configuration panel for that host to the right, and the “Add” action brings up an empty Host Configuration panel.
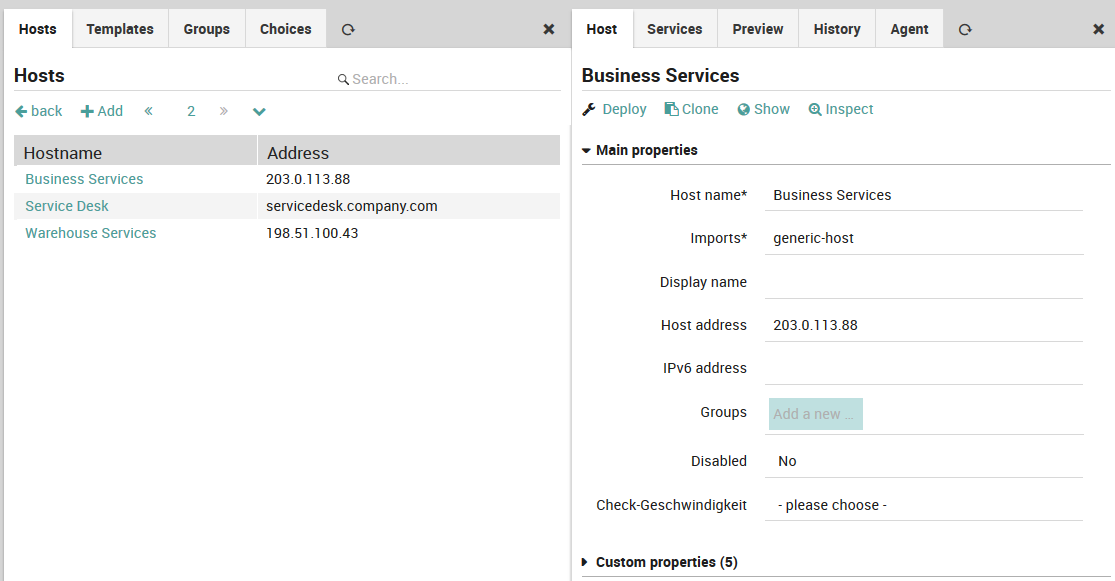
Fig. 52 Adding a new host
Like the template panel, there are tabs for Preview, History and Agent. In addition, there is a Services tab which shows all services assigned to that host, organized by inheritance and service set. Below the tabs is a “Show” action which takes you directly to the host object’s monitoring panel (i.e.,g click on the host under )
The following fields are important:
Hostname: This should be the host’s fully qualified domain name.
Imports: The host template(s) to inherit from.
Display name: A more friendly name shown in monitoring panels which does not have to be a FQDN.
Host address: The host’s IP address.
Groups: A drop down menu to assign this host to a defined host group.
Inherited groups, Applied groups: Assigned host groups, organized by how the group was assigned.
Disabled: Temporarily remove a host from monitoring, without deleting its configuration.
Custom properties: Fields defined for host templates, with the ability to select a value of the pre-defined type.
The remaining fields should be set on one of the host’s parent templates.
Note
You cannot create a host that does not inherit from at least one host template.
Adding a Command Check
The New Command Panel (Fig. 53, Director > Commands > Commands) displays one command per line, including the command name and the check command to be used (without arguments). While you can always click on the name of each field in this panel to see a description at the bottom of the web page, here is a quick summary:
Command Type: This is the same list as in the command template panel section.
Command Name: The reference name used to assign this check command to a service.
Imports: The parent command template(s). Unlike hosts and services, this is optional.
Command: The actual check command to use, without arguments.
Timeout: A timeout that will override an inherited timeout.
Disabled: Disabled commands cannot be assigned.
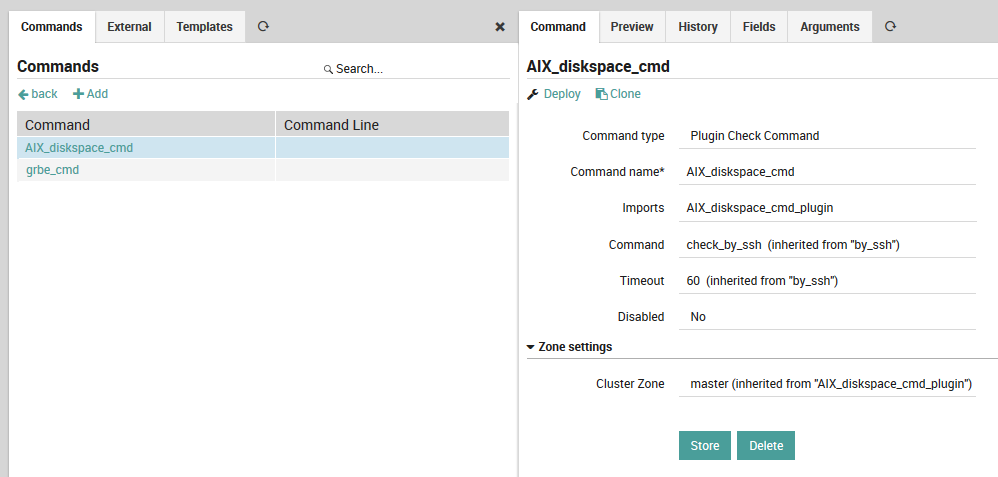
Fig. 53 Adding a new command
As with the command template panel, there is an Arguments tab (Fig. 54) that allows you to create parameter lists for the check commands either from scratch, or by overriding defaults from an inherited command template. You must create a separate entry for each parameter, which will then appear in the table below. To edit an existing parameter, simply click anywhere on its row in that list.
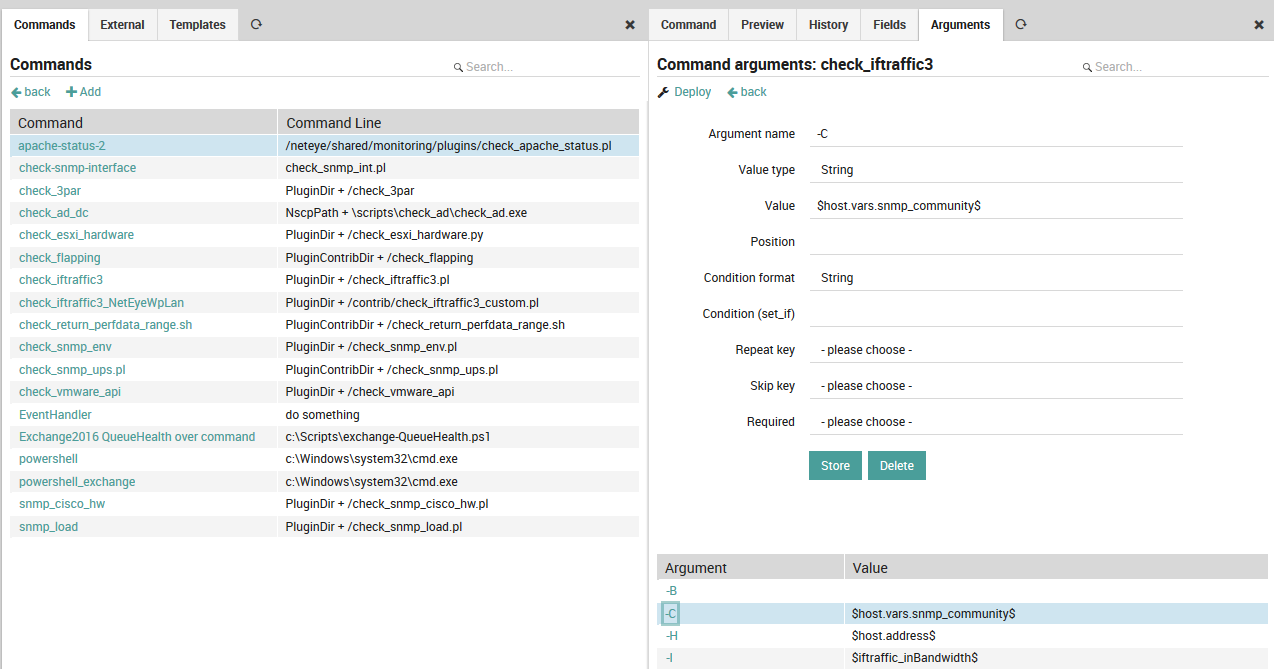
Fig. 54 Adding command arguments
For example, if when executing the check in a shell you need to use a parameter like “-C” with a given value, you will need to add it as an argument. All such arguments need to be listed in the Arguments table. For an argument’s “Value” parameter, you can enter either a system variable or a custom variable, both of which are indicated by a ‘$’ both before and after the variable name. This allows you to parameterize arguments across multiple host or service templates, including with any “Custom properties” fields you have created for those templates. This way you could parameterize for instance the following very common values at the Service level, and later change them all simultaneously if desired:
Credentials such as SNMP community strings, or usernames and passwords for SQL login
Common warning and critical thresholds
Addresses and port numbers
Units
For further details about command arguments, please see the official documentation.
Adding a Service
The Service Panel (Director > Monitored Services > Single Services) lists individual services that can be assigned to monitored hosts.
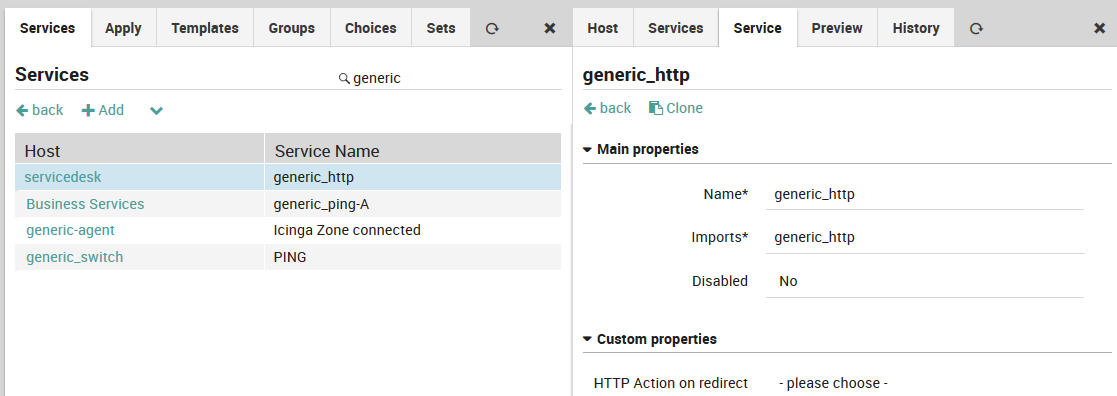
Fig. 55 The list of services in the Service Panel
Click on the “Add” action to display the New Service Panel ((Fig. 56) where you can create a new service by setting the following fields:
Name: Give the service a unique name.
Imports: The parent service template(s).
Host: The name of at least one host or host template to which this service should be applied.
Groups: The name of one or more service groups to which this service should belong.
Disabled: Whether or not this service can be assigned.
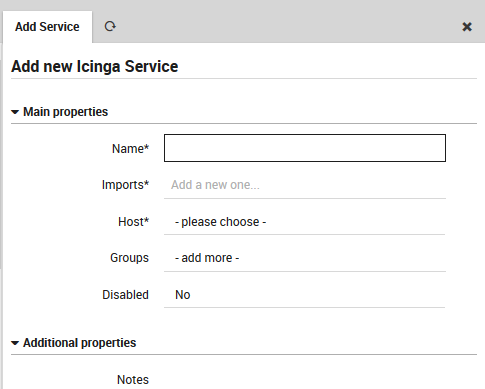
Fig. 56 Adding a new service
Note
You cannot create a service that does not inherit from at least one service template.
Assign Service Templates to Hosts
Once you have created host and service templates, and individual hosts and services, you can assign service templates to hosts. (Only service templates can be assigned, not simple services.) There are three situations in which you can do this, and they are all performed in a similar manner:
Assign a service template to a host
Assign a service template to a host template
Assign a service template to a service set
For instance, to assign a service template to a host, go to Director > Host objects > Hosts and select the desired host. In the panel that appears on the right (see Figure 1), select the Services tab, then click on the “Add service” action and choose the desired service template from the “Service” drop down menu.

Fig. 57 Adding a service template to a host
Then under “Main properties”, choose the appropriate service or service template in the drop down under Service.
To add a service template to a host template, follow the above instructions after choosing a host template at Director > Host objects > Host Templates.
For service sets, follow Director > Services, Service Sets, select the desired service set, change to the Services tab, and click the “Add service” action, choosing the service template from the “Imports” drop down menu.
Working with Apply for rules - tcp ports example
This example wants to show you how to make use of Apply For rule for
services.
First you need to define a tcp_ports data field of type Array
assigned to a Host Template. Refer to Working with fields section to setup a data field. You also
need to define a tcp_port data field of type String, we will
associate it to a Service Template later.
Then, please go to the Dashboard and choose the
Monitored services dashlet:
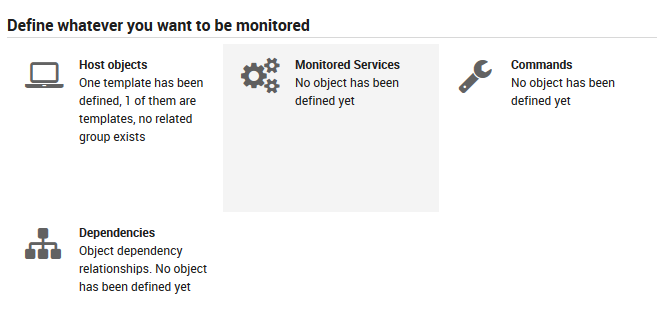
Fig. 58 Dashboard - Monitored services
Then create a new Service template with check command tcp:
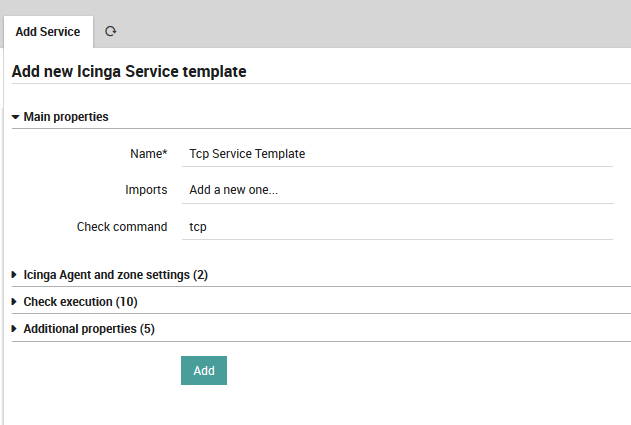
Fig. 59 Define service template - tcp
Then associate the data field tcp_port to this Service template:
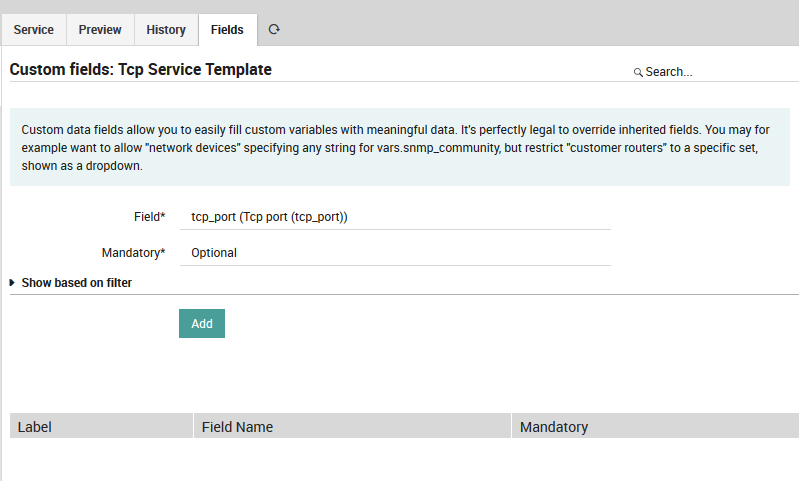
Fig. 60 Associate field to service template - tcp_port
Then create a new apply-rule for the Service template:
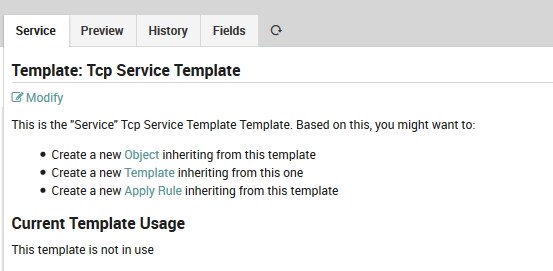
Fig. 61 Define apply rule
Now define the Apply For property, select the previously defined
field tcp_ports associated to the host template. Apply For rule
define a variable config that can be used as $config$, it
corresponds to the item of the array it will iterate on.
Set the Tcp port property to $config$:
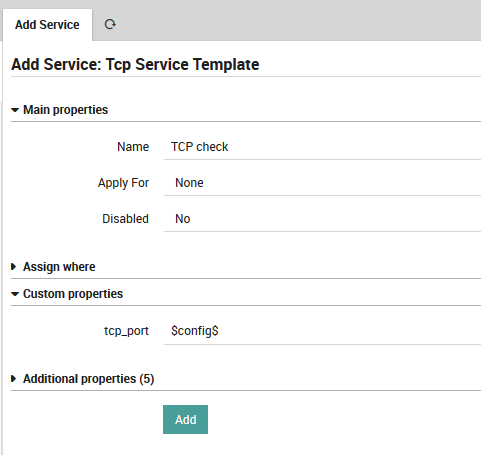
Fig. 62 Add field to template
(Side note: if you can’t see your tcp_ports property in
Apply For dropdown, try to create one host with a non-empty
tcp_ports value.)
That’s it, now all your hosts defining a tcp_ports variable will be
assigned the Tcp Check service.
Importing Monitoring Objects
Automatically importing hosts, users and groups of users can greatly speed up the process of setting up your monitoring environment if the resources are already defined in an external source such as an application with export capability (e.g., vSphere, LDAP) or an accessible, structured file (e.g., a CSV file). You can view the Icinga2 documentation on importing and synchronizing.
The following import capabilities (source types) are part of NetEye Core:
CoreApi: Import from the Icinga2 API
Sql: Import rows from a structured database
REST API: Import rows from a REST API at an external URL
LDAP: Import from directories like Active Directory
Two other import source types are optional modules that can be enabled or disabled from the Configuration > Modules page:
Import from files (fileshipper): Import from plain-text file formats like CSV
VMware: Import hosts/VMs from VMware/vSphere
You can import objects such as hosts or users (for notifications) by selecting the appropriate field for import. For example in LDAP for the field “Object class” you can select “computer”, “user” or “user group”.
The import process retrieves information from the external data source, but by itself it will not permanently change existing objects in NetEye such as hosts or users. To do this, you must also invoke a separate Synchronization Rule to integrate the imported data into the existing monitoring configuration. This integration could either be adding an entirely new host, or just updating a field like the IP address.
For each synchronization rule you must decide how every property should map from the import source field to your field in Neteye (e.g., from dnshostname to host_name). You can also define different synchronization rules on the same import method so that you can synchronize different properties at different times.
To trigger either the import or synchronization tasks, you must press the corresponding button on their panels. Neteye also allows you to schedule background tasks (Jobs) for import and synchronization. You can thus create regular schedules for importing hosts from external sources, for instance importing VMs from vSphere every morning at 7:00AM, then synchronizing them with existing hosts at 7:30AM. As with immediate import and synchronization, you must define a separate job for each task.
To begin importing hosts into NetEye, select Director > Import data sources as in Fig. 63.
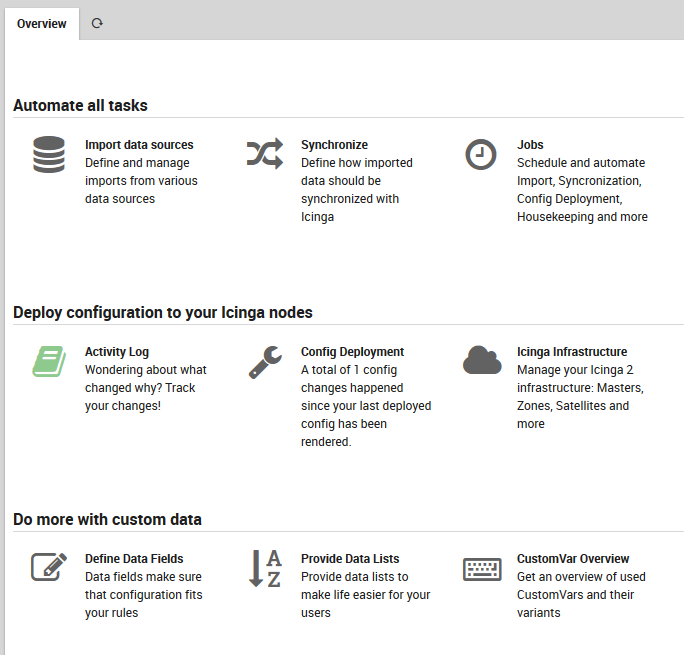
Fig. 63 The Automation menu section within Director.
The Import Source
The “Import source” panel containing all defined Imports will appear. Click on the “Add” action to see the “Add import source” form (Figure 2). Enter a name that will be associated with this configuration in the Import Source panel, add a brief description, and choose one of the source types described above. The links above will take you to the expanded description for each source type.
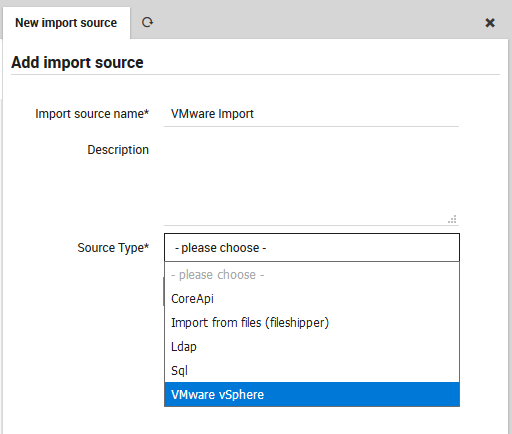
Fig. 64 Adding a new import configuration for VMware/vSphere.
Once you have finished filling in the form, press the “Add” button to validate the new import source configuration. If successful, you should see the new import source added as a row to the “Import source” panel. If you click on the new entry, you will see the additional tabs and buttons in Fig. 65 with the following effects:
Check for changes: This button checks to see whether an import is necessary, i.e. whether anything new would be added.
Trigger Import Run: Make the importable data ready for synchronization.
Modify: This panel allows you to edit the original parameters of this import source.
Modifiers: Add or edit the property modifiers, described in the section below.
History: View the date and number of entries of previous import runs.
Preview: See a preview of the hosts or users that will be imported, along with the effects of any property modifiers on imported values.
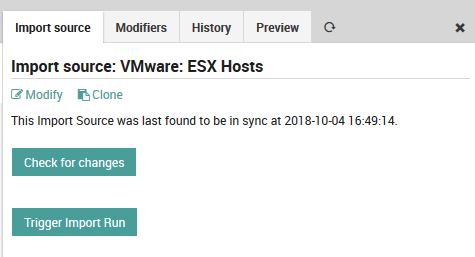
Fig. 65 Import source panels
Figure 3: Additional tabbed panels and actions for the newly defined import source.
Property Modifiers
Properties are the named fields that should be fetched for each object (row) from the data source. One field (column) must be designated as the key indexing column (key column name) for that data source, and its values (e.g., host names) must be unique, as they are matched against each other during the synchronization process to determine whether an incoming object already exists in NetEye. For instance, if you are importing hosts, the key indexing column should contain fully qualified domain names. If these values are not unique, the import will fail.
From the form you can select among these options:
Property: The name of a field in the original import source that you want to modify.
Target Property: If you put a new field name here, the modified value will go into this new field, while the original value will remain in the original property field. Otherwise, the property field will be mapped to itself.
Description: A description that will appear in the property table below the form.
Modifier: The property modifier that will be used to change the values. Once you have created and applied property modifiers, the preview panel will show you several example rows so that you can check that your modifiers work as you intended. Fig. 66 shows an example modifier that sets the imported user accounts to not expire.
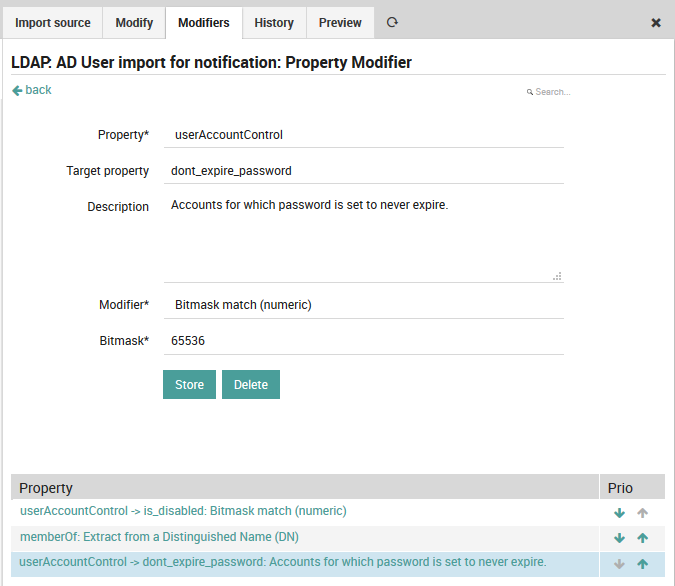
Fig. 66 A property modifier to set imported user accounts as having no expiration.
These modifiers can be selected in the Modifiers drop down box as in Fig. 67. Some of the more common modifiers are:
Modifier |
Source (Property) |
Target |
Explanatio n/Example |
|---|---|---|---|
Convert a latin1 string to utf8 |
guest.guest State |
isRunning |
Change the text encoding |
Get host by name (DNS lookup) |
name |
address |
Find the IP address automatica lly |
Lowercase |
dnshostname |
(none) |
Convert upper case letters to lower |
Regular expression based replacement |
state |
(none) |
/prod.*/i |
Bitmask match (numeric) |
userAccount Control |
is_ad_cont roller |
8192: SERVER_TRU ST_ACCOUNT |
Note
For a description of Active Directory Bitmasks, please see this Microsoft documentation.
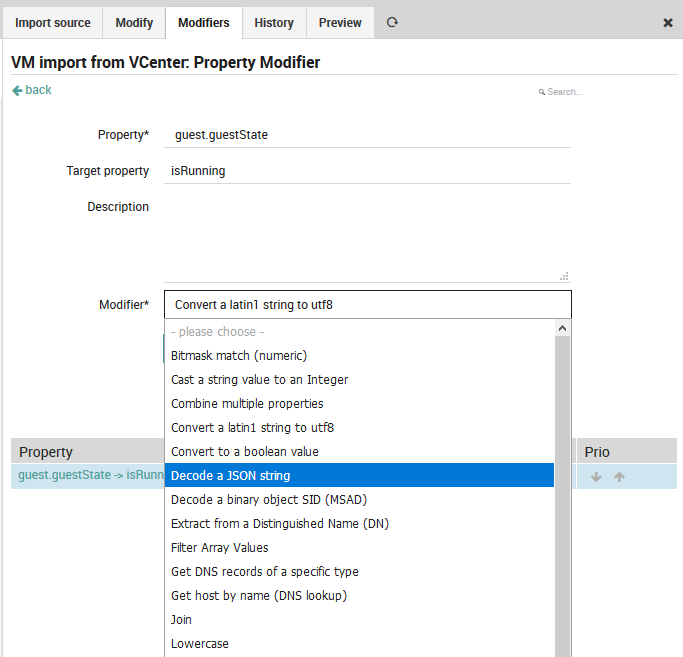
Fig. 67 Available property modifiers
Once you have created the new property modifier, it will appear under the “Property” list at the bottom of the Modifiers panel (see Fig. 66).
Note
Here you can also order the property modifiers. Every modifier that can be applied to its property will be applied, so if you have multiple modifiers for a single property then be aware that they will be applied in the order shown in the list. For instance, if you add two regex rules, the second (lower) rule will be applied to the results of the first (higher).
Synchronization Rules
When rows of data are being imported, it is possible that the new objects created from those rows will overlap with existing objects already being monitored. In these cases, NetEye will make use of Synchronization Rules to determine what to do with each object. You can choose from among the following three synchronization strategies, known as the Update Policy:
Merge: Integrate the fields one by one, where non-empty fields being imported win out over existing fields.
Replace: Accept the new, imported object over the existing one.
Ignore: Keep the existing object and do not import the new one.
In addition, you can combine any of the above with the option to Purge existing objects of the same Object Type as you are importing if they cannot be found in the import source.
Each synchronization rule should state how every property should map from the import source field to your field in Neteye (e.g., dnshostname -> host_name).
To begin, go to Director > Synchronize from the main menu and press the green “Add” action in the Sync rule panel in Fig. 68.

Fig. 68 The Sync Rule panel showing existing synchronization rules.
Now enter the desired information as in Fig. 69, including the name for this sync rule that will distinguish it from others, a longer description, the Object type for the objects that will be synchronized, an Update Policy from the list above, whether to Purge existing objects, and a Filtering Expression. This expression allows you to restrict the imported objects that will be synchronized based on a logical condition. The official Icinga2 documentation lists all operators that can be used to create a filter expression.
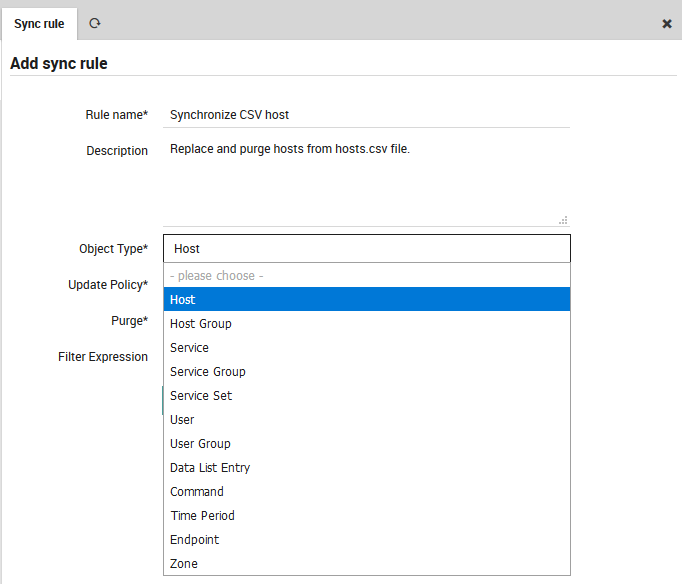
Fig. 69 Choosing the Object Type for a synchronization rule.
Now press the “Add” action. You will be taken to the Modify panel of the synchronization rule, which will allow you to change any parameters should you wish to. You should also see an orange banner (Fig. 70) that reminds you to define at least one Sync Property before the synchronization rule will be usable.
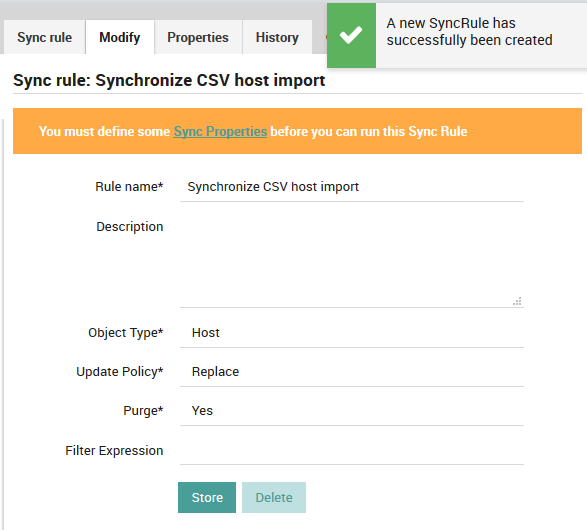
Fig. 70 Adding a new sync rule
Figure 8: Successfully adding a new synchronization rule.
The color of the banner is related to the status icon in the “Sync rule” panel:
Icon |
Banner/Meaning |
|---|---|
Black question mark |
This Sync Rule has never been run before. |
Orange cycling arrows |
There are changes waiting since the last time you ran this rule. |
Green check |
This Sync Rule was correctly run at the given date. |
Red “X” |
This Sync Rule resulted in an error at the given date. |
Synchronization Rule Properties
A Sync Property is a mapping from a field in the input source to a field of a NetEye object. Separating the mapping from the sync rule definition allows you to reuse mappings across multiple import types.
To add a sync property, click on the “Properties” tab (Fig. 71) and then on the “Add sync property rule” action. (Existing sync properties are shown in a table at the bottom of this panel, and you can edit or delete them by clicking on their row in the table.)
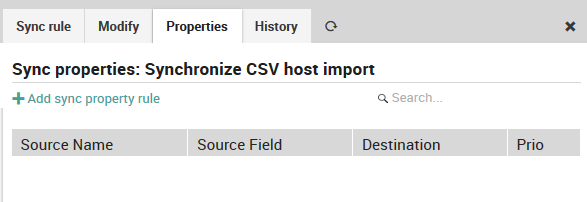
Fig. 71 Adding a first sync property.
Fig. 72 shows the first step, adding a Source Name, which is one of the Import sources you defined in Fig. 64. If you have multiple sources, then this drop down box will be divided automatically into those sources that have been used in a synchronization rule versus those that haven’t.
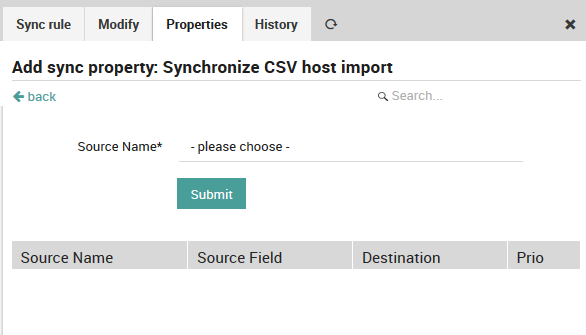
Fig. 72 Setting the Import Source
Next, choose the destination field (Fig. 73), which corresponds to the field in NetEye where imported values will be stored. Destination fields are the pre-defined special properties or object properties of existing NetEye objects. Note that some destination field values like custom variables will require you to fill in additional fields in the form.
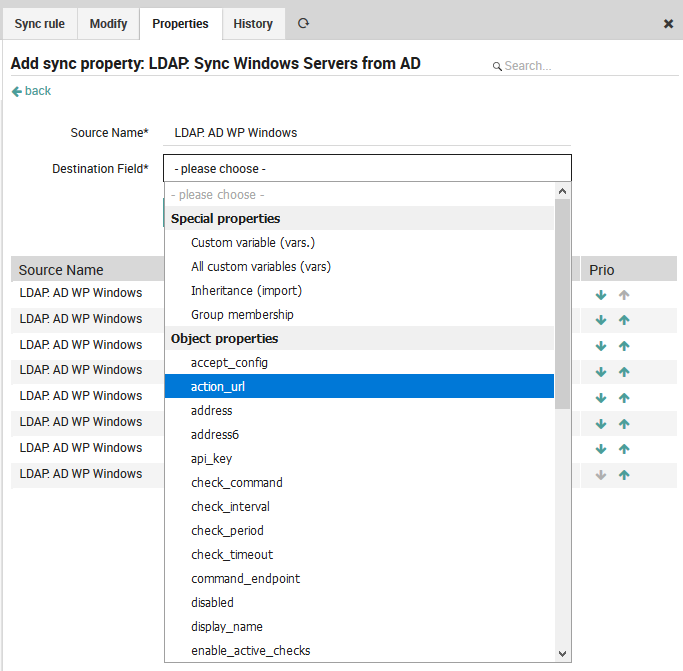
Fig. 73 Setting the Destination Field
If you cannot find the appropriate destination field to map to, consider creating a custom field in the relevant Host Template.
Finally, choose the source column (Fig. 74), which is the list of fields found in the input source.
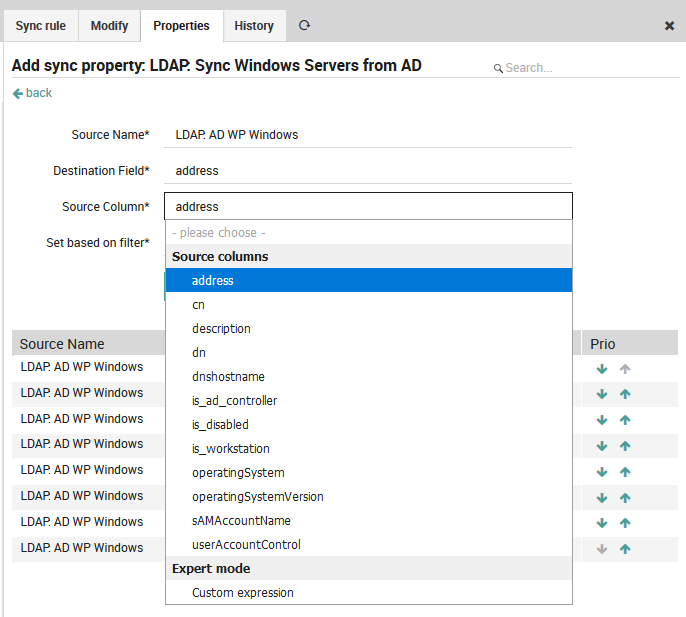
Fig. 74 Setting the Source Column
Note
Remember that the key column name is used as the ID during the matching phase. The automatic sync rule does not allow you to directly add any custom expressions to it.
Once you have finished entering the sync properties for a synchronization rule, you can return to the “Sync rule” tab to begin the synchronization process. As in Fig. 75, this panel will give you details of the last time the synchronization rule was run, and allow you to both check whether a new synchronization will result in any changes, as well as to actually start the import by triggering the synchronization rule manually.
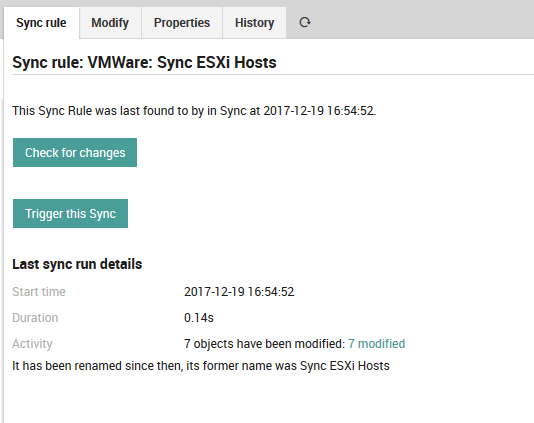
Fig. 75 Preparing to trigger synchronization with our new rule.
Jobs
Both Import Source and Sync Rules have buttons (Fig. 65) that will let you perform import and synchronization at any moment. In many cases, however, it is better to schedule regular importation, i.e., to automate the process. In this case you should create a Job that automatically runs both import and synchronization at set intervals.
The “Jobs” panel is available from Director > Jobs. Clicking on the “Add” action will take you to the “Add a new Job” panel (Fig. 76) Here you will see four types of jobs, only two of which relate to importation and synchronization:
Config: Generate and eventually deploy an Icinga2 configuration.
Housekeeping: Cleans up Director’s database.
Import: Create a regularly scheduled import run.
Sync: Create a regularly scheduled synchronization run.
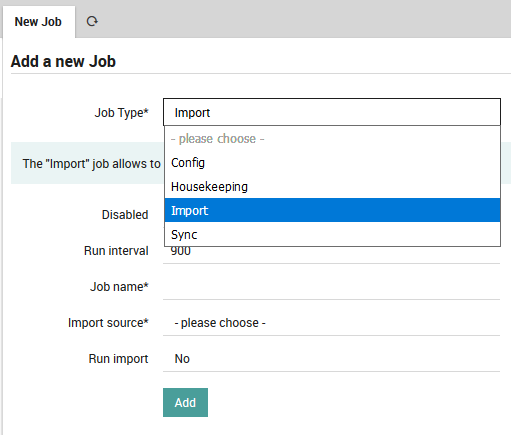
Fig. 76 Choosing the type of job
Select either the Import or Sync type. The following fields are common to both:
Disabled: Temporarily disable this job so you don’t have to delete it.
Run interval: The number of seconds until this job is run again.
Job name: The title of this job which will be displayed in the “Jobs” panel.
If you choose Import, you will see these additional fields:
Import source: The import to run, including the option to run all imports at once.
Run import: Whether to apply the results of the import (Yes), or just see the results (No).
If instead you choose Sync, you will see these other fields:
Synchronization rule: The sync rule to run, including the option to run all sync rules at once.
Apply changes: Whether to apply the results to your configuration (Yes), or just see the results (No).
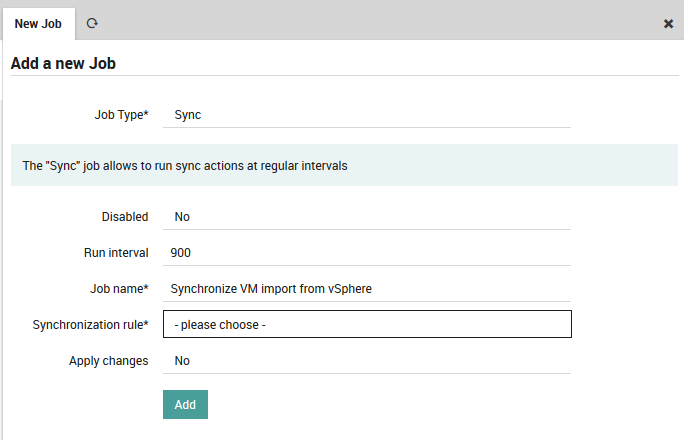
Fig. 77 Filling in the values for a sync job
Once you press the green “Add” button, you will see the “Job” panel which will summarize the recent activity of that job, and the “Config” panel, which will let you change your job parameters.
LDAP/AD Import Source configuration
The LDAP/AD interface allows you to import hosts and users directly from a directory configured for the Lightweight Directory Access Protocol, such as Active Directory.
The documentation below assumes that you are already familiar with importing and synchronization in Director.
Before creating an LDAP import source, you will need to configure a Resource representing the connection to the LDAP server. Resources have multiple purposes:
Import of LDAP groups
Import of hosts
Import of users for notifications
A resource is created once for each external data source, and then reused for each functionality it has. Some resource types are:
Local database / file
LDAP
An SSH identity
In general, you will need to set up a resource for import when you need to know its access methods in order to connect to it. For LDAP, you will need the host, port, protocol, user name, password, and base DN. To create a resource for your LDAP server, go to Configuration > Application > Resources as shown in Fig. 78.
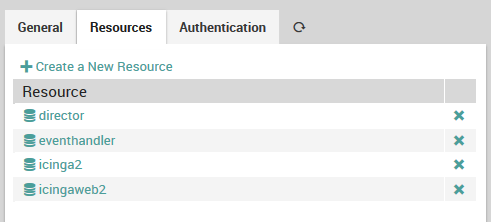
Fig. 78 Adding LDAP server as a resource.
Select the “Create a New Resource” action, which will display the “New Resource” panel. Enter the values for your organization (an example is shown in Fig. 79), then validate and save the configuration with the buttons below the form. Your new resource should now appear in the list at the left.
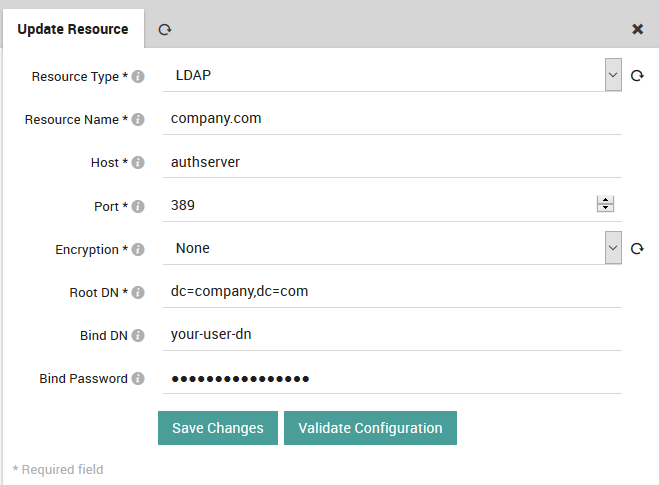
Fig. 79 Configuring the vCenter connection details.
To create a new LDAP import source using the new resource, go to Director > Import data sources, click on the “Add” action, then enter a name and description for this import source. For “Source Type”, choose the “Ldap” option.
As soon as you’ve chosen the Source Type, the form will expand (Fig. 80), asking you for more details. Specify values for:
The object key (key column name)
The resource you created above
The DC and an optional Organizational Unit from where to fetch the objects
The type of object to create in NetEye (typically “computer”, “user” or “group”)
An LDAP filter where you can restrict the results, for instance: * To exclude non-computer types * To exclude disabled elements * With a RegEx to filter for specific DNS host names
A list of all LDAP fields to import in the “Properties” box, with each field name separated by a comma
Fig. 80 shows an example LDAP import configuration. Finally, press the “Add” button.
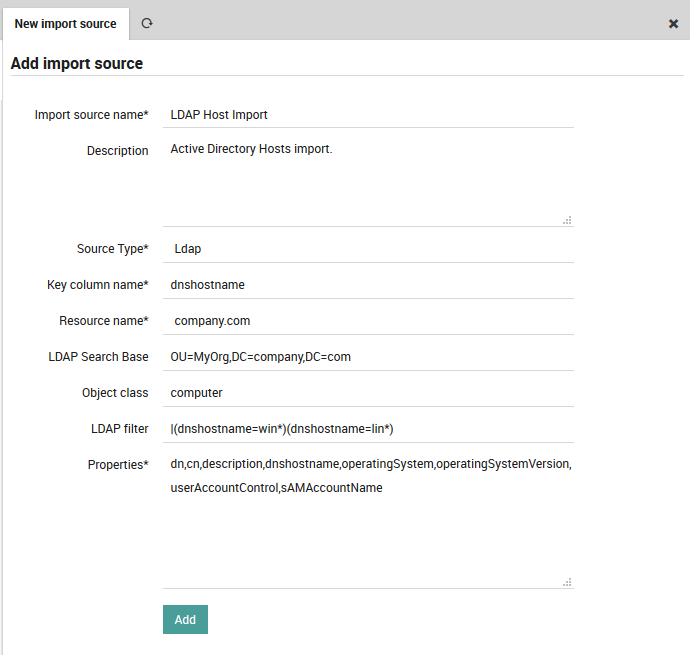
Fig. 80 Configuring the LDAP import configuration details.
Your new import source should now appear in the list to the left, and you can now perform all of the actions associated with importation as described in the section on automation.
You will also need to define a Synchronization Rule for your new LDAP import source. This will allow you to create helpful property modifiers that can change the original fields in a regular way, for instance:
Resolve host names from IP addresses
Check if a computer is disabled
Standardize upper and lower case
Flag workstations or domain controllers
Import and Synchronization
Icinga Director offers very powerful mechanisms when it comes to fetching data from external data sources.
The following examples should give you a quick idea of what you might want to use this feature for. Please note that Import Data Sources are implemented as hooks in Director. This means that it is absolutely possible and probably very easy to create custom data sources for whatever kind of data you have. And you do not need to modify the Director source code for this, you can ship your very own importer in your very own Icinga Web 2 module. Let’s see an example with LDAP.
Import Servers from MS Active Directory
Create a new import source
Importing data from LDAP sources is pretty easy. We use MS Active Directory as an example source:
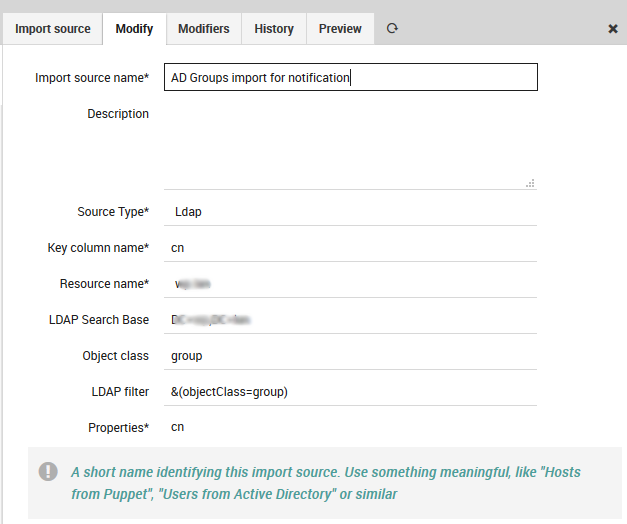
Fig. 81 Import source
You must formerly have configured a corresponding LDAP resource in your Icinga Web. Then you choose your preferred object class, you might add custom filters, a search base should always be set.
The only tricky part here are the chosen Properties. You must know them and you are required to fill them in, no way around this right now. Also please choose one column as your key column.
In case you want to avoid trouble please make this the column that corresponds to your desired object name for the objects you are going to import. Rows duplicating this property will be considered erroneous, the Import would fail.
Property modifiers
Data sources like SQL databases provide very powerful modifiers themselves. With a handcrafted query you can solve lots of data conversion problems. Sometimes this is not possible, and some sources (like LDAP) do not even have such features.
This is where property modifiers jump in to the rescue. Your computer names are uppercase and you hate this? Use the lowercase modifier:
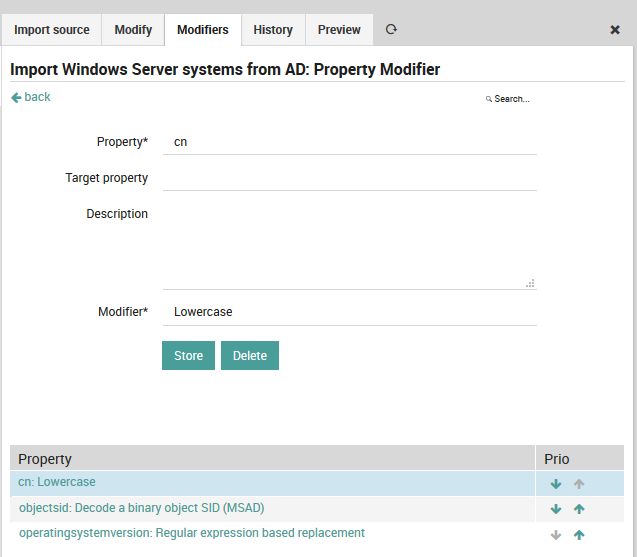
Fig. 82 Lowercase modifier
You want to have the object SID as a custom variable, but the data is stored binary in your AD? There is a dedicated modifier:
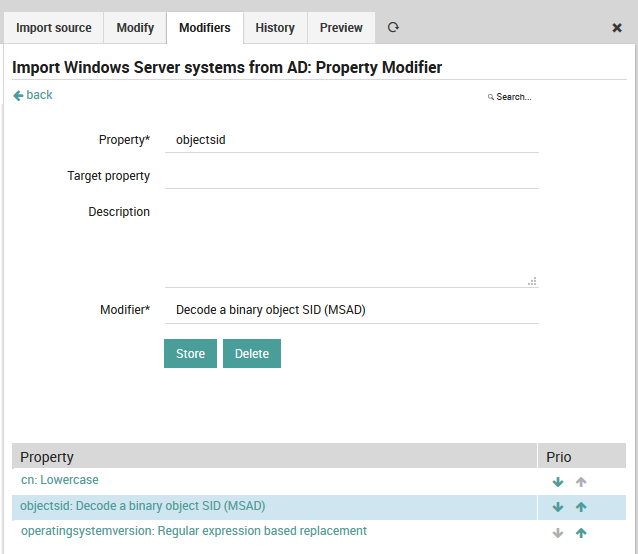
Fig. 83 SID modifier
You do not agree with the way Microsoft represents its version numbers? Regular expressions are able to fix everything:
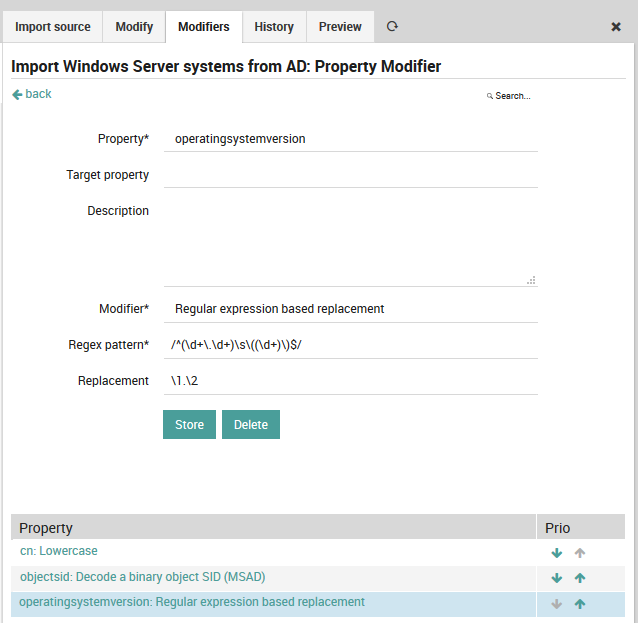
Fig. 84 Regular expression modifier
Synchronization
The Import itself just fetches raw data, it does not yet try to modify any of your Icinga objects. That’s what the Sync rules have been designed for. This distinction has a lot of advantages when it goes to automatic scheduling for various import and sync jobs.
When creating a Synchronization rule, you must decide which Icinga objects you want to work with. You could decide to use the same import source in various rules with different filters and properties.

Fig. 85 Synchronization rule
For every property you must decide whether and how it should be synchronized. You can also define custom expressions, combine multiple source fields, set custom properties based on custom conditions and so on.
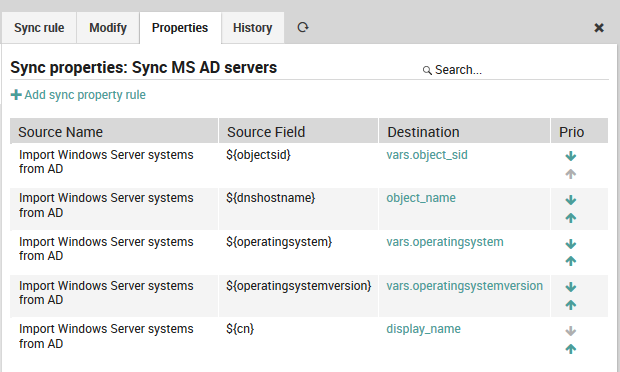
Fig. 86 Synchronization properties
Now you are all done and ready to a) launch the Import and b) trigger your synchronization run.
Use Text Files as an Import Source
The FileShipper interface allows you to import objects like hosts, users and groups from plain-text file formats like CSV and JSON.
The documentation below assumes that you are already familiar with Importing and Synchronization in Director. Before using FileShipper, please be sure that the module is ready by:
Enabling it in Configuration > Modules > fileshipper.
Creating paths for both the configuration and the files:
$ mkdir /neteye/shared/icingaweb2/conf/modules/fileshipper/
$ mkdir /data/file-import
And then defining a source path for those files within the following configuration file:
$ cat > /neteye/shared/icingaweb2/conf/modules/fileshipper/imports.ini
[NetEye File import]
basedir = "/data/file-import"
Adding a new Import Source
From Director > Import data sources, click on the “Add” action, then enter a name and description for this import source. For “Source Type”, choose the “Import from files (fileshipper)” option as in Fig. 87. The form will then expand to include several additional options.
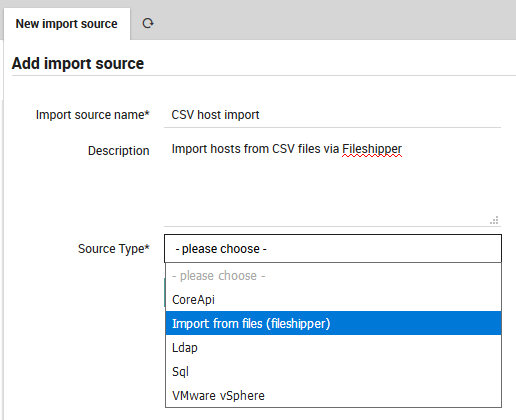
Fig. 87 Add a Fileshipper Import Source
Choose a File Format
Next, enter the name of the principal index column from the file, and choose your desired file type from File Format as in Fig. 88.
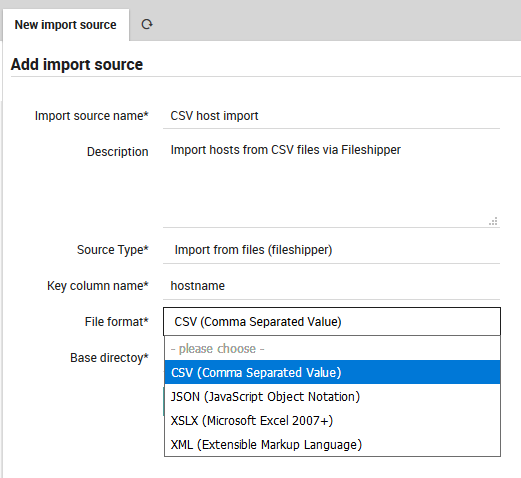
Fig. 88 Choosing the File Format.
If you would like to learn more about the supported file formats, please read the file format documentation.
Select the Directory and File(s)
You will now be asked to choose a Base Directory (Fig. 89).
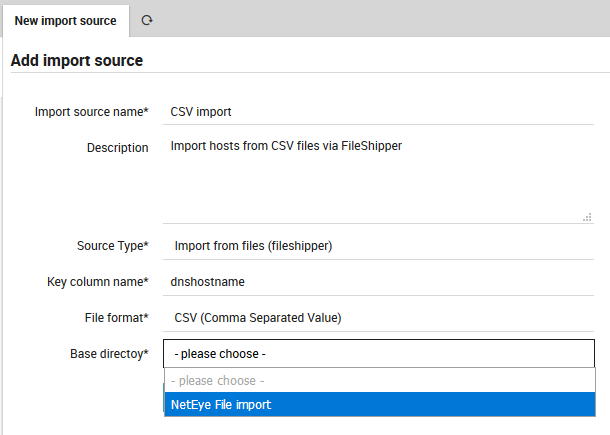
Fig. 89 Choosing the Base Directory.
The FileShipper module doesn’t allow you to freely choose any file on your system. You must provide a safe set of base directories in Fileshipper’s configuration directory as described in the first section above. You can include additional directories if you wish by creating each directory, and then modifying the configuration file, for instance:
[NetEye CSV File Import]
basedir = "/data/file-import/csv"

[NetEye XSLX File Import]
basedir = "/data/file-import/xslx"
Now you are ready to choose a specific file (Fig. 90).
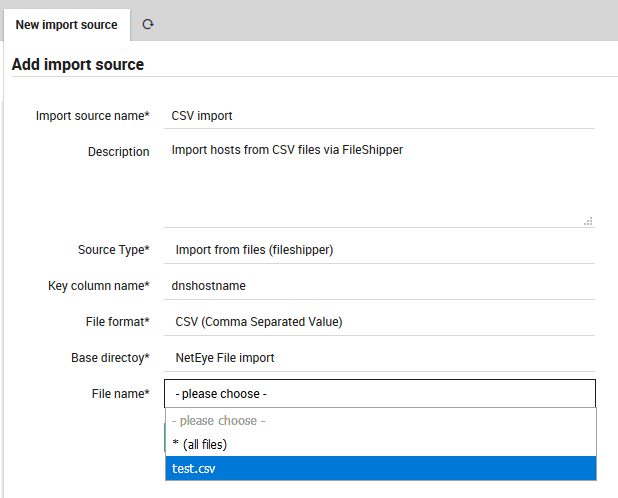
Fig. 90 Choosing a specific file or files.
Note
For some use-cases it might also be quite useful to import all files in a given directory at once.
Once you have selected the file(s), press the “Add” button. You will then see two additional parameters to fill for the CSV files: the delimiter character and field enclosure character (Fig. 91). After filling them out, you will need to press the “Add” button a second time.
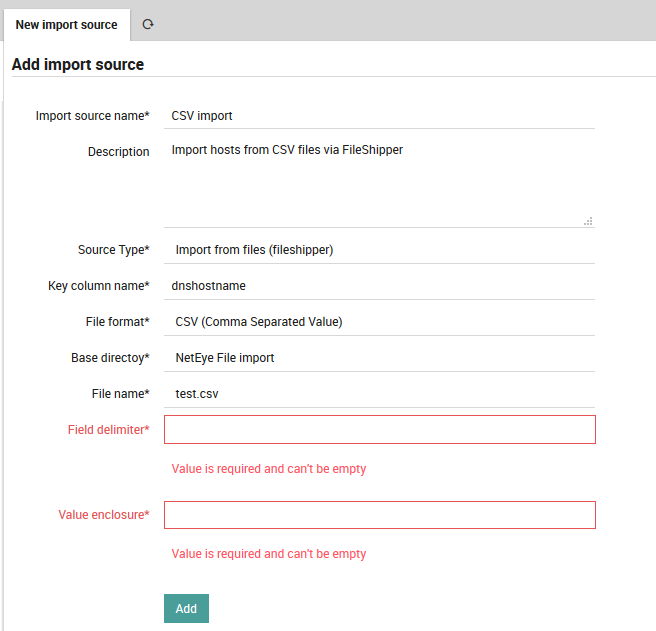
Fig. 91 Add extra parameters.
The new synchronization rule will now appear in the list (Fig. 92). Since you have not used it yet, it will be prefixed by a black question mark.

Fig. 92 The newly added import source.
Now follow the steps for importing at the page on Importing and Synchronization in Director. Once complete, you can then look at the Preview panel of the Import Source to check that the CSV formatting was correctly recognized. For instance, given this CSV file:
dnshostname,displayname,OS
ne4north1.company.com,NE4 North Building 1,Windows
ne4north2.company.com,NE4 North Building 2,Linux
then Fig. 93 shows the following preview:

Fig. 93 Previewing the results of CSV import.
If the preview is correct, then you can proceed to Synchronization, or set up a Job to synchronize on a regular basis.
Supported File Formats
Depending on the installed libraries the Import Source currently supports multiple file formats.
CSV (Comma Separated Value)
CSV is a not so well defined data format, therefore the Import Source has to make some assumptions and ask for optional settings.
Basically, the rules to follow are:
a header line is required
each row has to have as many columns as the header line
defining a value enclosure is mandatory, but you do not have to use it in your CSV files. So while your import source might be asking for
"hostname";"ip", it would also accepthostname;ipin your source filesa field delimiter is required, this is mostly comma (
,) or semicolon (;). You could also opt for other separators to fit your very custom file format containing tabular data
Sample CSV files
Simple Example
"host","address","location"
"csv1.example.com","127.0.0.1","HQ"
"csv2.example.com","127.0.0.2","HQ"
"csv3.example.com","127.0.0.3","HQ"
More complex but perfectly valid CSV sample
"hostname","ip address","location"
csv1,"127.0.0.2","H\"ome"
"csv2",127.0.0.2,"asdf"
"csv3","127.0.0.3","Nott"", at Home"
JSON - JavaScript Object Notation
JSON is a pretty simple standardized format with good support among most scripting and programming languages. Nothing special to say here, as it is easy to validate.
Sample JSON files
Simple JSON example
This example shows an array of objects:
[{"host": "json1", "address": "127.0.0.1"},{"host": "json2", "address": "127.0.0.2"}]
This is the easiest machine-readable form of a JSON import file.
Pretty-formatted extended JSON example
Single-line JSON files are not very human-friendly, so you’ll often meet pretty- printed JSON. Such files also make perfectly valid import candidates:
{
  "json1.example.com": {
    "host": "json1.example.com",
    "address": "127.0.0.1",
    "location": "HQ",
    "groups": [ "Linux Servers" ]
  },
  "json2.example.com": {
    "host": "json2.example.com",
    "address": "127.0.0.2",
    "location": "HQ",
    "groups": [ "Windows Servers", "Lab" ]
  }
}
Microsoft Excel
XSLX, the Microsoft Excel 2007+ format is supported since v1.1.0.
XML - Extensible Markup Language
When working with XML please try to ship simple files as shown in the following example.
Sample XML file
<?xml version="1.0" encoding="UTF-8" ?>
<hosts>
  <host>
    <name>xml1</name>
    <address>127.0.0.1</address>
  </host>
  <host>
    <name>xml2</name>
    <address>127.0.0.2</address>
  </host>
</hosts>
YAML (Ain’t Markup Language)
YAML is anything but simple and well defined, however it allows you to write the same data in various ways. This format is useful if you already have files in this format, but it’s not recommended for future use.
Sample YAML files
Simple YAML example
---
- host: "yaml1.example.com"
  address: "127.0.0.1"
  location: "HQ"
- host: "yaml2.example.com"
  address: "127.0.0.2"
  location: "HQ"
- host: "yaml3.example.com"
  address: "127.0.0.3"
  location: "HQ"
Advanced YAML example
Here’s an example using Puppet for database configuration. as an example, but this might work in a similar way for many other tools.
Instead of a single YAML file, you may need to deal with a directory full of files. The Import Source documentation shows you how to configure multiple files. Here you can see a part of one such file:
--- !ruby/object:Puppet::Node::Facts
  name: foreman.localdomain
  values:
    architecture: x86_64
    timezone: CEST
    kernel: Linux
    system_uptime: "{\x22seconds\x22=>5415, \x22hours\x22=>1, \x22days\x22=>0, \x22uptime\x22=>\x221:30 hours\x22}"
    domain: localdomain
    virtual: kvm
    is_virtual: "true"
    hardwaremodel: x86_64
    operatingsystem: CentOS
    facterversion: "2.4.6"
    filesystems: xfs
    fqdn: foreman.localdomain
    hardwareisa: x86_64
    hostname: foreman
vSphereDB Import Source configuration
The vSphereDB interface allows you to import hosts directly from a vCenter server.
The documentation below assumes that you are already familiar with importing and synchronization in Director. Before using the vSphereDB import interface, ensure that:
the module has been enabled under
at least one Connection to a vCenter was configured in the VMD Module
To create a new VMware vSphereDB import source, go to , click on the Add action, then enter a name and description for this import source. As Source Type, choose the VMware vSphereDB option as in Fig. 94.

Fig. 94 Choosing the VMware vSphereDB option.
As soon as you’ve chosen the correct Source Type, it will ask you for more details, including the type of Objects you want to import and the vCenter Connection to use for the the import, as shown in Fig. 95.
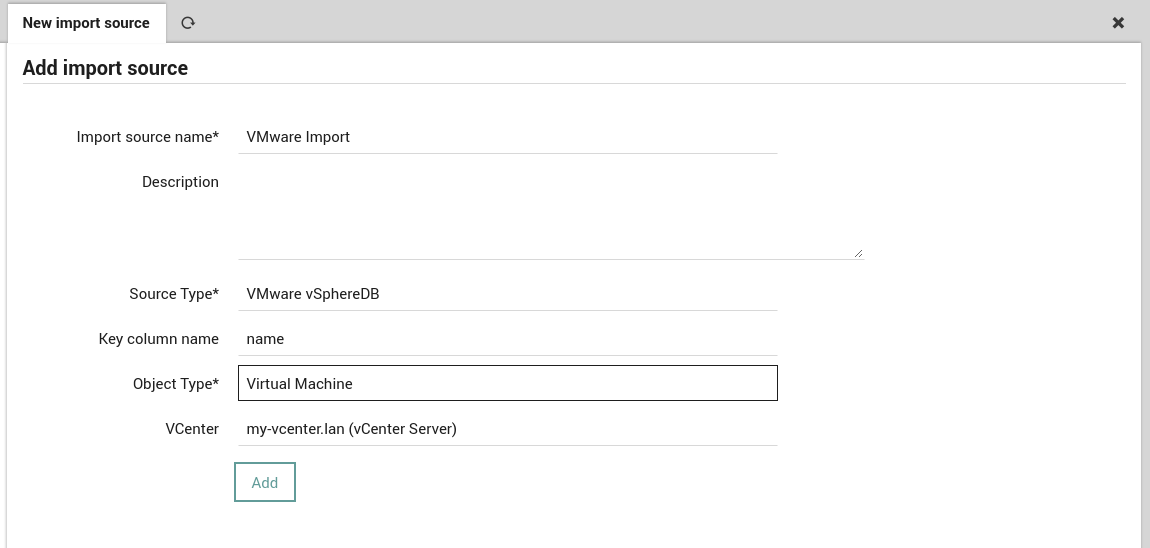
Fig. 95 Configuring the parameters for the VMware vSphereDB source.
That’s it. Once you’ve confirmed that you want to add this new Import Source, you’re all done with the configuration.
Note
As described on the importing page, the value of the key column name is used as the ID during the matching phase.
You can now click on the Preview tab to see what the results look like (See Fig. 96) before deciding whether to run the full import.
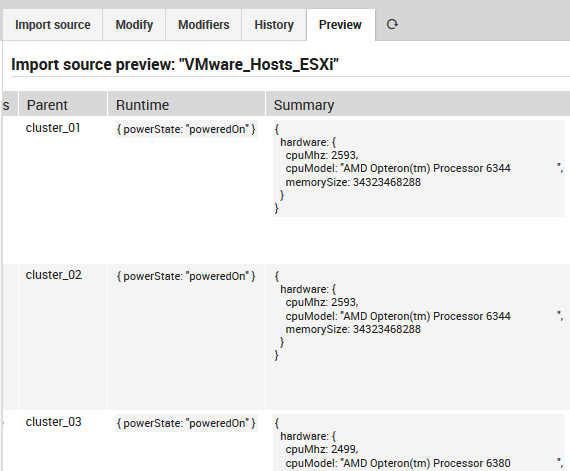
Fig. 96 Previewing the results of importing from the source
Be sure to define a Synchronization Rule for your new import source, as explained in the related Director documentation.
If you prefer to use the Icinga2 CLI commands instead of the web interface, see VSphere CLI reference documentation.
vSphereDB Monitoring Integration
To easily and reliably check the status of a Monitored Object it is fundamental to find all its Monitoring information in a single point. The VMD module integrates the information related to your Virtualization infrastructure next to each Host in the Monitoring.
To integrate the VMD information into the Monitoring module, navigate to and then add a new integration by clicking the Add button.
Configure the parameters related to your vCenter and Monitoring backend (IDO Resource and Source Type), then you only need to configure a mapping that relates each Monitored Host with a VMD Object (Host or Virtual Machine).
For example if you have a VM called my_example_vm whose hostname is example.com and
the Monitoring Host representing this VM has hostname example.com, you need to map
the Virtual Machine Property Guest Hostname with the Monitored Host Property Hostname.
You can add more integrations for all the other property mappings that exists in your infrastructure.
If your integration has been correctly configured, you will see a new section like in Fig. 97 in the status page of those Monitored Host mapped with a VMD Object.
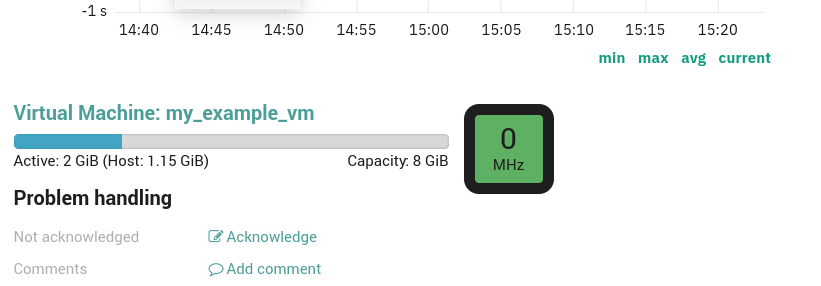
Fig. 97 vSphereDB Monitoring Integration Section.
vSphereDB Dashboards
The NetEye VMD Module installs out-of-the-box dashboards in The ITOA Module, which give you easy access to both an overview and detailed information of your virtualization infrastructure.
In particular, the dashboards are available in the Main Org. Grafana Organization
under the folder neteye-vspheredb-graphs and include the following dashboards:
Top VMs: shows which Virtual Machines are responsible for the most traffic on their Virtual Interfaces in the given time period
Virtual Machine Details: gives you insights on the System-level performance of each Virtual Machine
Since InfluxDB is used to store data used by the Dashboards, please configure the vCenter(s) in NetEye VMD to write the Performance Data of your vCenter(s).
Configure a vCenter to write Performance Data
In Single-Tenant environments it is fine to write the Performance Data of all your vCenters in a single InfluxDB database.
In Multi-Tenant environments, instead, it is necessary that Performance Data of vCenters belonging to different tenants be written on separate databases.
The procedure to follow for these two cases is different and is described below.
Single-Tenant environment
Supposing our vCenter is named example_vCenter, proceed as follows:
Navigate to
Click the Edit button
In the Ship Performance Data form set:
Performance Data Consumer to influx-perfdata
Database to vspheredb
Note
Both influx-perfdata and vspheredb are created by default by NetEye.
Save the changes
Multi-Tenant environment
The procedure in this case is longer because each tenant should access a different database with a different user.
In the following example we will assume that the we need to configure the vCenter example_vCenter within the tenant example_tenant.
Create the InfluxDB database vspheredb_example_tenant and an InfluxDB user with the same name (if they do not exist already):
Connect to the influxdb console with:
neteye# influx -host influxdb.neteyelocal -ssl -username root -password "$(cat /root/.pwd_influxdb_root)"
Create the database:
CREATE DATABASE "vspheredb_example_tenant"
Create the user:
CREATE USER "vspheredb_example_tenant" WITH PASSWORD '<securepassword>'
Note
Substitute
<securepassword>with a secure password and save it in the file/root/.pwd_influxdb_vspheredb_example_tenantto avoid forgetting it.Grant the user vspheredb_example_tenant permissions on the database vspheredb_example_tenant:
GRANT ALL ON "vspheredb_example_tenant" TO "vspheredb_example_tenant"
Create the Performance Data Consumer influx-perfdata-example_tenant:
Go to
Click on the Add button
In the form set:
Name to influx-perfdata-example_tenant
Implementation to InfluxDB
Base URL to https://influxdb.neteyelocal:8086
Username to vspheredb_example_tenant (the InfluxDB user created above)
Password to the password of the vspheredb_example_tenant user (you should have saved it in the file
/root/.pwd_influxdb_vspheredb_example_tenant)
Save the changes
Navigate to
Click on the Edit button
In the Ship Performance Data form set:
Performance Data Consumer to influx-perfdata-example_tenant
Database to vspheredb_example_tenant
Save the changes
You should then repeat this procedure for every tenant of which you want to enable the Dashboards.
Configuration Baskets
Director already takes care of importing configurations for monitored objects. This same concept is also useful for Director’s internal configuration. Configuration Baskets allow you to export, import, share and restore all or parts of your Icinga Director configuration, as many times as you like.
Configuration baskets can save or restore the configurations for almost all internal Director objects, such as host groups, host templates, service sets, commands, notifications, sync rules, and much more. Because configuration baskets are supported directly in Director, all customizations included in your Director configuration are imported and exported properly. Each snapshot is a persistent, serialized (JSON) representation of all involved objects at that moment in time.
Configuration baskets allow you to:
Back up (take a snapshot) and restore a Director configuration…
To be able to restore in case of a misconfiguration you have deployed
Copy specific objects as a static JSON file to migrate them from testing to production
Understand problems stemming from your changes with a diff between two configurations
Share configurations with others, either your entire environment or just specific parts such as commands
Choose only some elements to snapshot (using a custom selection) in a given category such as a subset of Host Templates
In addition, you can script some changes with the following command:
# icingacli director basket [options]
Using Configuration Baskets
To create or use a configuration basket, select Icinga Director > Configuration Baskets. At the top of the new panel are options to:
Make a completely new configuration basket with the Create action
Make a new basket by importing a previously saved JSON file with the Upload action
At the bottom you will find the list of existing baskets and the number of snapshots in each. Selecting a basket will take you to the tabs for editing baskets and for taking snapshots.
Create a New Configuration Basket
To create or edit a configuration basket, give it a name, and then select whether each of the configuration elements should appear in snapshots for that basket. The following choices are available for each element type:
Ignore: Do not put this element in snapshots (for instance, do not include sync rules).
All of them: Put all items of this element type in snapshots (for example, all host templates).
Custom Selection: Put only specified items of this element type in a snapshot. You will have to manually mark each element on the element itself. For instance, if you have marked host templates for custom selection, then you will have to go to each of the desired host templates and select the action Add to Basket. This will cause those particular host templates to be included in the next snapshot.
Uploading and Editing Saved Baskets
If you or someone else has created a serialized JSON snapshot (see below), you can upload that basket from disk. Select the Upload action, give it a new name, use the file chooser to select the JSON file, and click on the Upload button. The new basket will appear in the list of configuration baskets.
Editing a basket is simple: Click on its name in the list of configuration baskets to edit either the basket name or else whether and how each configuration type will appear in snapshots.
Managing Snapshots
From the Snapshots panel you can create a new snapshot by clicking on the Create Snapshot button. The new snapshot should immediately appear in the table below, along with a short summary of the included types (e.g., 2x HostTemplate) and the time. If no configuration types were selected for inclusion, the summary for that row will only show a dash instead of types.
Clicking on a row summary will take you to the Snapshot panel for that snapshot, with the actions
Show Basket: Edit the basket that the snapshot was created from
Restore: Requests the target Director database; clicking on the Restore button will begin the process of restoring from the snapshot. Configuration types that are not in the snapshot will not be replaced.
Download: Saves the snapshot as a local JSON file.
followed by its creation date, checksum, and a list of all configured types (or custom selections).
For each item in that list, the keywords unchanged or new will appear to the right. Clicking on new will show the differences between the version in the snapshot and the current configuration.

