Configuration
Authorization
NetEye Log Analytics
The NetEye Log Analytics module is an analytics and visualization platform designed to work with Elasticsearch. You can use it to search, view, and interact with data stored in Elasticsearch indices, then easily perform advanced data analysis and visualize your data in a variety of charts, tables, and maps.
Configuring access Roles
The permissions and roles must be configured as described in the Authentication section.
Note
Kibana Users who are managed by NetEye will be overwritten at each login.
If you modify such a user using the Kibana admin panel, those changes will be lost!
User Management
Elasticsearch user management is based on three main entities:
User: The authenticated user is defined by a username and password and should be assigned to a role. The users will be automatically created during the NetEye login.
Role mapping: in NetEye this is used for granting access to all those users that are authenticated via certificates. You can check roles in Elastic in the dedicated Elasticsearch Access Control section.
Role: A named set of permissions that translate to privileges on resources. A more detailed description of how the user authorization works in Elasticsearch can be found at the following link Elasticsearch provides some built-in roles you can explicitly assign to users. You can always refer to the official documentation for delving into the topic.
A complete guide on how to create new roles within Elasticsearch can be found on Elasticsearch official documentation about Defining roles.
Each NetEye Role can be mapped to one or more Kibana roles.
If a user belongs to more than one NetEye Role with different Kibana roles, the same mapping will be reflected within Kibana.
The Kibana module adds a kibana/roles field for each role (i.e., a
comma-separated list of kibana roles which must be correctly defined in
Kibana) and also a new role neteye_kibana_sso, which allows to carry
out operations on tokens of Elasticsearch Token Service.
All the users with Administrative Access role in NetEye or belonging to a NetEye role that set Full module access for Kibana, will be by default mapped with all the following built-in Kibana roles:
kibana_admin
superuser
With the introduction of X-Pack security in Elasticsearch, additional roles are available to allow communication with other modules: they are described in Elasticsearch Access Control.
Elasticsearch Access Control
Elasticsearch Access Control is organised in the following three sections, in which are defined roles, users and role mappings. Each section explains which roles can be assigned to a user and their mapping, which allows to communicate with other modules like neteye, kibana, logstash, filebeat, and tornado.
Warning
Default roles, users and role mappings will be
owerwritten every time neteye_secure_install is executed,
therefore the user should not overwrite them but instead create its
own roles, users and role mappings.
Elasticsearch Roles
Each of these roles enables a user to access the authenticated endpoint.
logstash_neteye : This role will enable access for
logstash-*and*beat-*indices with all privileges.filebeat_neteye : This role will enable access for
filebeat-*indices with all privileges.tornado_neteye : This role will enable access for
tornado-*indices with “create_index”, “create”, “write”, “read” privileges.neteye_es_check : This role allows the communication of NetEye with Elasticsearch for monitoring purposes via
NetEyeElasticCheckcertificate.neteye_kibana_sso : This role allows to perform operations on tokens that are generated by the Elasticsearch Token Service.
ebp_user_write_only_neteye : This role allow to create and write any index but does not allow read or other operation. It is intended to write data through the elastic-blockchain-proxy.
elastic_blockchain_proxy_neteye : This role allows only to read “ES_BLOCKCHAIN.iteration” and “ES_BLOCKCHAIN.hash” fields on any index in order to allow the elastic-blockchain-proxy retrieve information required to handle the blockchain.
Elasticsearch User
Each user has a fixed set of privileges.
kibana_root : This is the root user of kibana and is mapped with
kibana_admin, andsuperuserbuilt-in roles.ebp_user : This is the default elastic-blockchain-proxy user used in the
ebp_persistentpipeline and is mapped withebp_user_write_only_neteyebuilt-in role.
Note
Starting from NetEye 4.13, the Elastic Logstash user pre-configured
in NetEye will be deprecated and only authenticated via certificates
and not via basic authentication. Hence, we strongly suggest to
remove the user manually using the Kibana GUI
(Log Analytics > Management > Users).
For more details on built-in roles, please refer to the official Elasticsearch guide.
Elasticsearch Roles Mapping
Role mappings define which roles are assigned to each user. Each mapping has rules that identify users and a list of roles that are granted to those users.
filebeat_neteye : This role mapping allows a user
filebeatmapped withbeats_system(built-in role) andfilebeat_neteyerole to communicate between filebeat and elasticsearch.neteye_es_check : This role mapping allows the communication between neteye and elasticsearch via
NetEyeElasticCheckcertificate.tornado : This role mapping is used for the Tornado Elasticsearch executor to allow a user
tornadoto write events according totornado_neteyerole.logstash : This role mapping allows a user logstash mapped with
beats_admin,logstash_admin,logstash_system(built-in roles) andlogstash_neteyerole to communicate between logstash and neteye.elastic_blockchain_proxy_neteye : This role mapping allows the communication between elastic-blockchain-proxy and Elasticsearch via
NeteyeElasticBlockchainProxy
Debug Elasticsearch Access Control
If you need some extended information about the Elasticsearch access control, for example for troubleshooting, you can add the following lines to the configuration file of Elasticsearch log facility (i.e.``/neteye/local/elasticsearch/conf/log4j2.properties``) for each node in the cluster:
# elasticsearch debug
logger.authc.name = org.elasticsearch.xpack.security.authc
logger.authc.level = DEBUG
Then, Elasticsearch must be restarted on each node and the
Elasticsearch log /neteye/local/elasticsearch/log/neteye.log will
then contain advanced debug information, useful to understand your
problem.
Elastic Blockchain Proxy Configuration
The elastic-blockchain-proxy is carried out thanks to CLI commands that allow you to use the functionality provided. Running the executable without any arguments returns a list of all available commands and global options that apply to every command.
Available commands:
export-logs : Exports the signed logs from ElasticSearch to a local file.
serve : Starts the elastic-blockchain-proxy server ready for processing incoming requests.
verify : Verify the validity of a blockchain.
The elastic-blockchain-proxy configuration is partly based on configuration files and partly based on command line parameters. The location of configuration files in the file system is determined at startup based on the provided CLI options. In addition, each command can have specific CLI arguments required.
Global command line parameters:
config-dir: (Optional) The filesystem folder from which the configuration is read. The default path is /etc/elastic_blockchain_proxy/.
Available command line parameters for the export-logs command only:
output-file: The output file path where the exported logs are written
index-name: The name of the target Elasticsearch index to be used
format: (Optional) The output file format. This can be:
ndjson: (Default) the logs are exported in Newline delimited JSON format
from-date: (Optional) An inclusive ‘From’ date limit in ISO 8601 format
to-date: (Optional) An exclusive ‘To’ date limit in ISO 8601 format
batch-size: (Optional) The size of a each read/write operation. Default is 500.
elasticsearch-authentication-method: (Optional) The method used to authenticate to Elasticsearch. This can be:
none: (Default) the command does not authenticate to Elasticsearch
- basicauth: Username and password are used to authenticate. If this method is specified,
the following parameter is required (and a password will be prompted during the execution):
elasticsearch-username: the name Elasticsearch user used to perform authentication
pemcertificatepath: PKI user authentication is used. If this method is specified, the following parameters are required:
elasticsearch-client-cert path to the client certificate
elasticsearch-client-private-key path to the private key of the client certificate
elasticsearch-ca-cert path to the CA certificate to be trusted during the requests to Elasticsearch
Available command line parameters for the verify command only:
index-name: The name of the target Elasticsearch index to be used
key-file: The path to the file that contains the iteration 0 signature key
batch-size: (Optional) The size of a each read/verify operation. Default is 500.
elasticsearch-authentication-method: (Optional) The method used to authenticate to Elasticsearch. This can be:
none: (Default) the command does not authenticate to Elasticsearch
basicauth: Username and password are used to authenticate. If this method is specified, the following parameter is required (and a password will be prompted during the execution):
elasticsearch-username: the name Elasticsearch user used to perform authentication
pemcertificatepath: PKI user authentication is used. If this method is specified, the following parameters are required:
elasticsearch-client-cert path to the client certificate
elasticsearch-client-private-key path to the private key of the client certificate
elasticsearch-ca-cert path to the CA certificate to be trusted during the requests to Elasticsearch
Besides these parameters, additional configuration entries are
available in the $config-dir/elastic_blockchain_proxy.toml file
and in the $config-dir/elastic_blockchain_proxy_fields.toml file.
The $config-dir/elastic_blockchain_proxy.toml file contains
the following configuration entries:
logger:
level: The Logger level filter; valid values are trace, debug, info, warn, and error. The logger level filter can specify a list of comma separated per-module specific levels, for example: warn,elastic_blockchain_proxy=debug
failure_max_retries: A predefined maximum amount of retry attempts. A value of 0 means that no retries will be attempted.
failure_sleep_ms_between_retries: A fixed amount of milliseconds to sleep between each retry attempt
data_dir: The path to the folder that contains the
key.jsonfilemessage_queue_size: The size of the in-memory queue where messages will be stored before while waiting for being processed
web_server:
address: The address where the elastic-blockchain-proxy Web Server will listen for HTTP requests
tls: TLS options to enable HTTPS (See the
Enabling TLSsection below)
elasticsearch:
url: The URL of the ElasticSearch server
timeout_secs: the timeout in seconds for a connection to Elasticsearch
ca_certificate_path: path to CA certificate needed to verify the identity of the Elasticsearch server
auth: The authentication method to connect to the ElasticSearch server (See the
Elasticsearch authenticationsection below)
The $config-dir/elastic_blockchain_proxy_fields.toml file contains
the following configuration entries:
include_fields: List of fields of the log that will be included in the signature process. Every field not included in this list will be ignored. The dot symbol is used as expander processor; for example, the field “name1.name2” refers to the “name2” nested field inside “name1”.
Secure Communication
When installed on NetEye, the Elastic Blockchain Proxy automatically starts in secure mode using TLS and also authentication with Elasticsearch is protected by certificates. More precise information for advanced users, who can check the location of the configuration files or modify the setup can be found by checking section Elastic Blockchain Proxy Security.
Agents configuration
Installation and Configuration of Beat Agents
Before being able to take fully advantage of the Beat feature, agents
must be installed on the monitored hosts, along with the necessary
certificates. On the hosts, any kind of Beat can be installed; for
example, the Winlogbeat is available from the official download
page;
installation
instructions
are available as well. The agent configuration is stored in the YAML
configuration file winlogbeat.yml. A description of the options
available in the Beat’s configuration file can be found in the official
documentation.
Note
You need to install a Beat whose version is compatible with the Elastic version installed on NetEye, which is 7.10. Tofind out which version of Beat you can install, please check the compatibility matrix
Relevant to the configuration are the following options:
ignore_older, which indicates how many hours/days it should gather data from. By default, indeed, the Beat collects all the data it finds, meaning it can act retroactively. This is the default option if not specified, so make sure to properly configure this option, to not overload the initial import of data and to avoid potential problems like crash of Logstash and ES disk space.
index: ”winlogbeat”, which is needed to match NetEye’s templates and ILM.
Use of SSL certificates
Server certificates of Logstash allowing communication with Beats must
be stored in the /neteye/shared/logstash/conf/certs/ directory, with
names logstash-server.crt.pem and private/logstash-server.key.
Additionally, also the root-ca.crt certificate must be available in
the same directory.
The structure mentioned above for the certificates must be organised as:
certs/
   ├── logstash-server.crt.pem
   ├── root-ca.crt
   └── private/
          └── logstash-server.key
The certificates are stored under the logstash configuration
directory, because it is indeed Logstash that listens for incoming Beat
data flows.
As a consequence, all Beat clients must use a client certificate to send output data to Logstash. Please refer to the Elastic official documentation, for example the Filebeat SSL configuration is available here.
An example of Filebeat to Logstash SSL communication configuration is the following:
#--------- Logstash output ------------------------------------
    output.logstash:
      # The Logstash hosts
      hosts: ["yourNetEyeDomain.example:5044"]

      # List of root certificates for HTTPS server verifications
      ssl.certificate_authorities: ["/root/beat/root-ca.crt"]

      # Certificate for SSL client authentication
      ssl.certificate: "/root/beat/logstash-client.crt.pem"

      # Client Certificate Key
      ssl.key: "/root/beat/private/logstash-client.key.pem"
Self-signed certificates
Note
For production systems, you should upload your own certificates on NetEye. Moreover, you should use your own certificates also for all Beat clients. Self-signed certificates must never be used on production systems, but only for testing and demo purposes.
Self-signed certificates (logstash-server.crt.pem and private/logstash-server.key) and the Root CA (root-ca.crt) are shipped with NetEye for Logstash. Self-signed certificates for Beat clients can be generated from the CLI as follows:
- you can run the script
usr/share/neteye/scripts/security/generate_client_certs.shusing three suitable parameters: The client name
The common name (CN) and information for the other certificate’s field
The output directory
An example of command line is the following:
/bin/bash /usr/share/neteye/scripts/security/generate_client_certs.sh \
    logstash-client \
    "/CN=logstash-client/OU=client/O=client/L=Bolzano/ST=Bolzano/C=IT" \
    "/root/beat/"
Event Processing
Logstash Configuration
We have added an Elastic Stack template which allows us to manage the Logstash configuration within the NetEye environment.
Please note that Elastic merges all templates using a priority order scheme so that when the values of multiple templates conflict, Elastic will determine which value to use based on the “order” field in the template. The higher the value, the higher the priority.
Autoexpand Replicas
We created a Logstash template to configure the Logstash replica that applies to both single instances and clusters. The new indices matching the pattern logstash-* will automatically configure the replica with the range 0-1 using the index.auto_expand_replicas setting.
The name of this template is neteye_logstash_replicas, with a priority order of 100. You can view the full template with the following command:
GET _template/neteye_logstash_replicas
Enabling Elastic Blockchain Proxy
The Elastic Blockchain Proxy receives event from Logstash, it signs them in real time and forwards them to Elasticsearch.
To make the use of the EBP easier, two default pipelines, called input_beats and ebp_persistent pipelines have been provided. The input_beats pipeline always redirects logs to main pipeline. If the Elasticsearch Blockchain Proxy is enabled and the log match the conditions specified in the input_beats pipeline, logs will be redirected to also ebp_persistent pipeline.
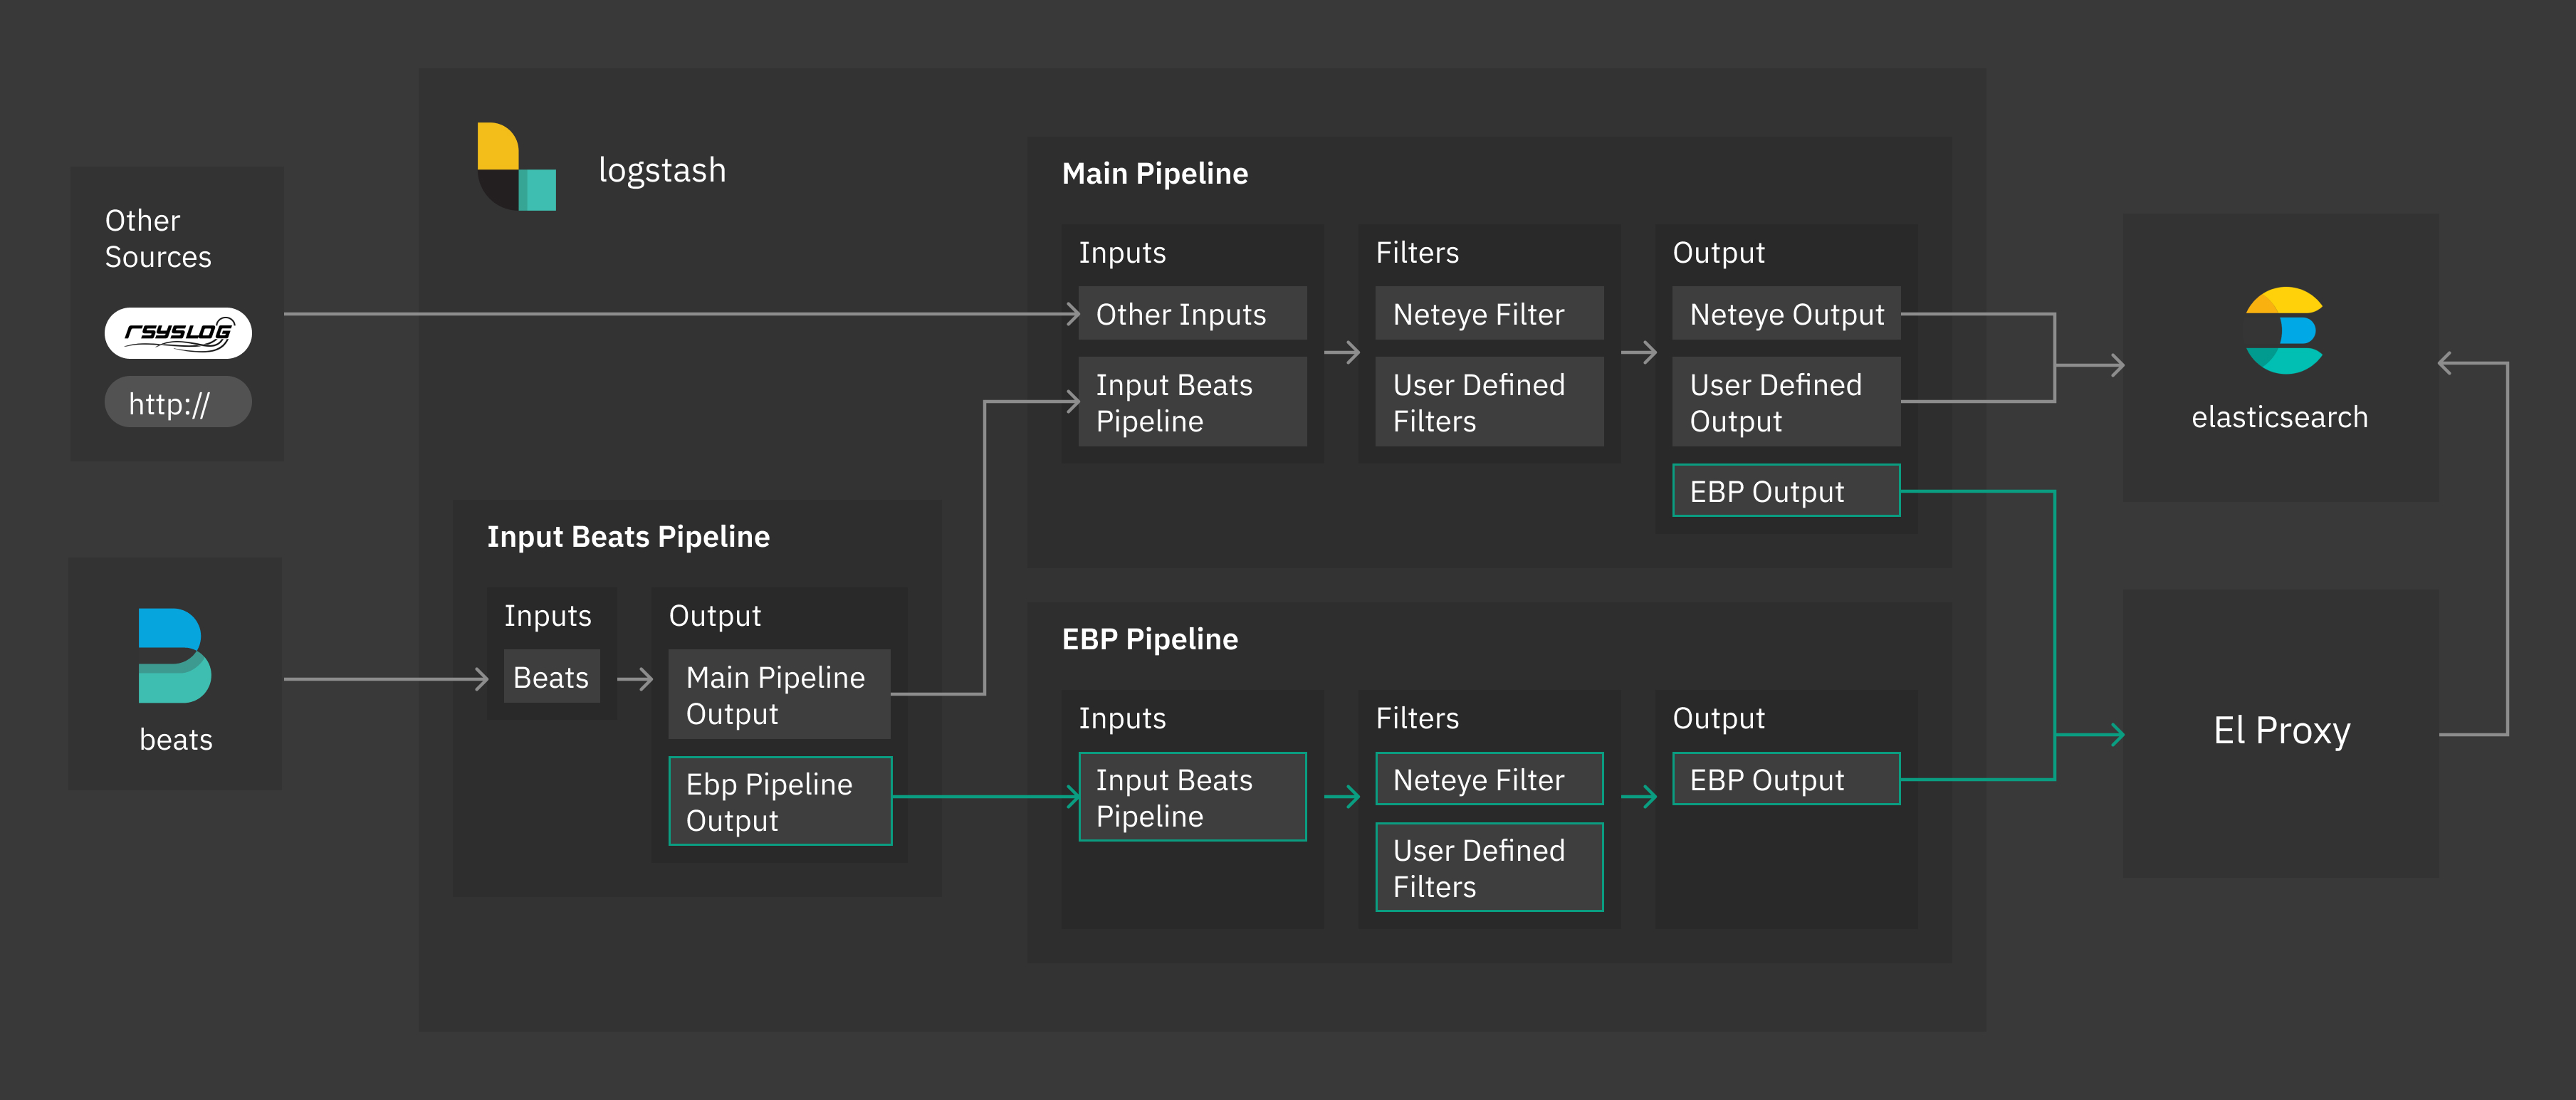
Specifically, the ebp_persistent pipeline enables disk persistency, extracts client certificate details and redirects data to the Elastic Blockchain Proxy.
The user can customize the ebp_persistent pipeline by adding custom Logstash filters in the form of .filters
files in the directory /neteye/shared/logstash/conf/conf.ebp.d.
Please note that the user must neither add .input or .output files nor modify existing configuration files.
To enable the Elastic Blockchain Proxy it is sufficient to set the variable
EBP_ENABLED in the file /neteye/shared/logstash/conf/sysconfig/logstash-user-customization,
as follows:
EBP_ENABLED="true"
Before enabling the Elasticsearch Blockchain Proxy the user must copy the file
/neteye/shared/elastic-blockchain-proxy/data/key.json in a safe storage outside the NetEye machine.
The key contained in the file is mandatory to perform blockchain verification and it will be overwritten
at every blockchain iteration.
For additional information about Elasticsearch Blockchain Proxy refer to Elastic Blockchain Proxy
Elastic Blockchain Proxy Template and Retention
We have added a template called elastic_blockchain_proxy to define static and dynamic mapping for Elastic Blockchain Proxy objects EBP_METADATA and ES_BLOCKCHAIN. We strongly discourage changes to the mapping of Elastic Blockchain Proxy related fields.
Furthermore this template enables also an ILM (Index Lifecycle Management) Policy garante_default_retention to define a default retention policy for blockchain indices. To change the retention policy you need to create a new ILM policy and a new template with higher order which redefines the policy.
Do not change the default template or ILM policy because they will be automatically overwritten.
Backup & Restore
Elasticsearch Backup and Restore
Elasticsearch provides snapshot functionality which is great for backups because they can be restored relatively quickly.
- The main features of Elasticsearch snapshots are:
They are incremental
They can store either individual indices or an entire cluster
They can be stored in a remote repository such as a shared file system
The destination for snapshots must be a shared file system mounted on each Elasticsearch node.
Deleting a snapshot only changes those files that are associated with the deleted snapshot and are not used by any other snapshots. If the deleted snapshot operation is executed while the snapshot is being created, the snapshot process will be aborted and all files created as part of the snapshot process will be removed.
For further details see the Official Elasticsearch snapshot documentation.
Requirements
The snapshot module requires the initialization of a repository which contains a reference to a repository path contained in the Elasticsearch configuration file:
/neteye/local/elasticsearch/conf/elasticsearch.yml
This repository, and consequently the destination path for the snapshot, must be initialized manually.
A shared folder must be mounted on each Elasticsearch node at the following path:
/data/backup/elasticsearch
Note
In a cluster environment, all nodes running Elasticsearch must have the same shared folder mounted.
Backup strategy
The standard behavior of the Elasticsearch snapshot module is to create incremental backups. You may however want to have full backups in addition to incremental backups. Considering that a full backup is not natively supported, the recommended procedure is to create a new repository for each full backup you need.
Note that in an Elasticsearch cluster installation, all commands must be executed on the Elasticsearch master node. The master node can be retrieved with the following command:
/usr/share/neteye/backup/elasticsearch/elasticsearch-backup -M
The following subsections describe the common operations needed to initialize a repository, and to execute, delete and restore snapshots.
Initialize the default repository
The initialization uses the following default mount path:
/data/backup/elasticsearch
In a cluster environment it is mandatory to mount the path on a shared file system for each node:
# The default neteye_log_backup repository will be used
/usr/share/neteye/backup/elasticsearch/elasticsearch-backup -I
Initialize a new repository, or one different from the default
If the new repository uses a custom folder, its path must be added to the Elasticsearch configuration file. In particular, the option “path.repo” in the configuration file:
/neteye/local/elasticsearch/conf/elasticsearch.yml
must be an array containing all destination paths for the snapshot. For instance:
path.repo: ["/data/backup/elasticsearch", "/data/full_backup/"]
Note that if you change the Elasticsearch configuration file, you must restart it:
systemctl restart elasticsearch
You can create a new repository with the name “my_repo” and a custom backup path with this script (if the -r option is not specified, the default neteye_log_backup will be used):
/usr/share/neteye/backup/elasticsearch/elasticsearch-backup -r "my_repo" -i /data/full_backup/
Take a snapshot
When using a default name: snapshot-Year-Month-Day-Hour:Minute:Second
/usr/share/neteye/backup/elasticsearch/elasticsearch-backup -s
When using a custom name (in this example, “test-snapshot”):
/usr/share/neteye/backup/elasticsearch/elasticsearch-backup -S test-snapshot
Delete a snapshot
You can delete one or more snapshots with a regex. In the example here, only the snapshot with the name “test-snapshot” will be removed:
/usr/share/neteye/backup/elasticsearch/elasticsearch-backup -d "test-snapshot"
You can also delete any snapshots that are older than the specified period using the format YY.MM.DD.HH.MM (e.g., 0.1.1.0.0 means 31 days). For more details, see the description of unit.
/usr/share/neteye/backup/elasticsearch/elasticsearch-backup -c 0.1.1.0.0
These two options can be combined, for instance to delete all snapshots that contain “test” in the name and that are older than 1 minute:
/usr/share/neteye/backup/elasticsearch/elasticsearch-backup -d test -C 0.0.0.0.1
Create a full snapshot
A new repository (see the previous section) or an empty repository must be used.
/usr/share/neteye/backup/elasticsearch/elasticsearch-backup -r "my_full_backup" -s
Restoring a snapshot
Restoring a snapshot requires a configuration file that describes the process. Please see the official guide for more details. We have provided three example configurations in the following folder::
/usr/share/neteye/backup/elasticsearch/conf
These can be invoked with the following script:
/usr/share/neteye/backup/elasticsearch/elasticsearch-restore -c <absolute-config-file-path>
Restore the last snapshot
Restore all indices in the most recent snapshot.
actions:
  1:
    action: restore
    options:
      # May be changed according to your setup
      repository: neteye_log_backup
      # If the name is blank, the most recent snapshot by age will be selected
      name:
      # If the indices are blank, all indices in the snapshot will be restored
      indices:
      include_aliases: False
      ignore_unavailable: False
      include_global_state: False
      partial: False
      wait_for_completion: True
      filters:
      filtertype: none
Restore some indices
Restore indices with the name provided in indices in the most recent snapshot with state SUCCESS. The indices option supports multiple indices syntax.
In the following example, all the indices starting with “test-” will be restored.
actions:
  1:
    action: restore
    description:
    options:
      # May be changed according to your setup
      repository: neteye_log_backup
      # If the name is blank, the most recent snapshot by age will be selected
      name:
      indices: [test-*]
      include_aliases: False
      ignore_unavailable: False
      include_global_state: False
      partial: False
      filters:
      filtertype: state
      state: SUCCESS
Restore Snapshot Renaming
Restore all indices in the most recent snapshot by: - Finding any indices being restored that match the rename_pattern. - Changing the name as described in rename_replacement.
The following example will restore all indices which start with “index_”, but rename it to “restored_index_”. E.g., If you have “index_1”, this will restore “index_1”, but rename it to “restored_index_1”. For additional information, see the documentation.
actions:
  1:
    action: restore
    options:
      # May be changed according to your setup
      repository: neteye_log_backup
      # If the name is blank, the most recent snapshot by age will be selected
      name:
      # If the indices are blank, all indices in the snapshot will be restored
      indices:
      include_aliases: False
      ignore_unavailable: False
      include_global_state: False
      partial: False
      "rename_pattern": "index_(.*)"
      "rename_replacement": "restored_index_$1"
      extra_settings:
      wait_for_completion: True
    filters:
      filtertype: none
This website uses cookies that store your theme preferences. These cookies do not store any personally identifiable data.