Visualization
Concepts
ITOA Dashboards
The ITOA module represents the integration of the Grafana project into NetEye, allowing you to display real-time performance metrics.
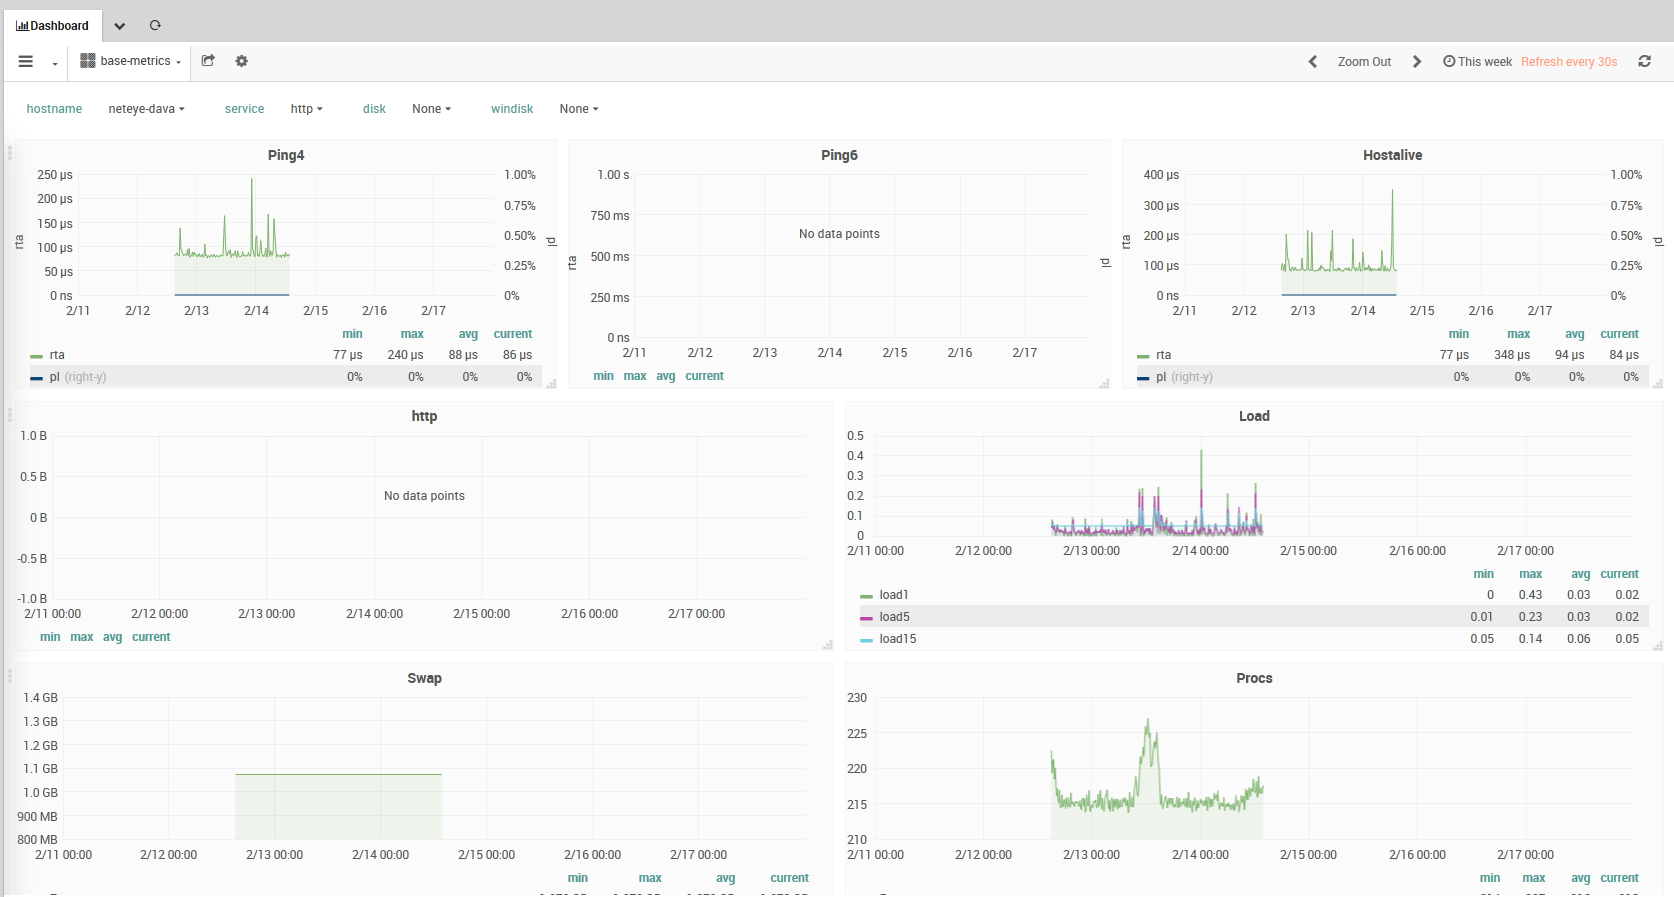
Fig. 146 ITOA Performance Data
You can find more information on how to use Grafana and InfluxDB here:
Consider also using the new Flux language, a functional language alternative to InfluxQL aimed at data query and analysis. Flux overcomes a number of InfluxQL limitations and adds various useful functions, like for example, joins, pivot tables, histograms, geo-temporal data among other. A full list of Flux capabilities and examples can be found in this comparison.
Below are some basic concepts to help you understand how the ITOA module works.
Users
A User in the ITOA module is associated with a named account. A user belongs to an Organization (the ITOA module currently supports only one Organization), and can be assigned different levels of privileges through roles.
User authentication for ITOA is integrated with general NetEye authentication. However, user permission management is not currently integrated and instead must be done within the ITOA module. When a non-administrative user accesses ITOA the first time, an account will be autogenerated with a default role of Viewer. The permissions found in Configuration > Authentication > Roles will not be applied in ITOA. Instead, the administrator must explicitly set those permissions via ITOA > Configuration > Server Admin, clicking on the user’s Login, and setting the Role for each Organization desired at the bottom of the panel.
Data Sources
Grafana supports many different storage backends for your time series data (Data Source). Each data source has a specific Query Editor that is customized for the features and capabilities that that particular data source exposes.
The following data sources are officially supported:
InfluxDB
Elasticsearch
JSON files
The query language and capabilities of each data source are obviously very different. You can combine data from multiple data sources in a single Dashboard, but each individual Panel is tied to a specific data source that belongs to a particular Organization. Thus you cannot mix data from multiple data sources in a single panel.
To support the configuration of datasources, NetEye comes with a preconfigured Elasticsearch data source called “Elasticsearch-Logstash”, which points to the Logstash indices present on Elasticsearch.
This Elasticsearch-Logstash data source uses the grafana user’s TLS certificates (generated during NetEye installation) to authenticate X-Pack Security. The grafana user by default has no permissions on any Elasticsearch index, but you can add necessary permissions from within X-Pack Security, just by mapping its role to the user grafana.
You can also change the configuration of the Elasticsearch-Logstash data source should you need to personalize it, but be aware that if you change its name, a new data source named Elasticsearch-Logstash source will be regenerated the next time neteye_secure_install is run.
Rows
A Row is a logical divider within a Dashboard, and is used to group Panels together.
Rows are always 12 “units” wide. These units are automatically scaled dependent on the horizontal resolution of your browser. You can control the relative width of Panels within a row by setting their own width. We utilize a unit abstraction to ensure that Grafana will look great on all screens, both small and large.
Rows can be collapsed by clicking on the Row Title. If you save a Dashboard with a row collapsed, it will be saved in that state, and will not pre-load those graphs while the row remains collapsed.
Panels
The Panel is the basic visualization building block in the ITOA module. Each Panel provides a Query Editor (whose form is dependent on the Data Source selected in the panel) that allows you to extract the necessary data underlying the visualization that will be shown on the Panel.
There are a wide variety of styling and formatting options that each Panel exposes to allow you to create a great visual. Panels can be dragged and dropped and rearranged on the Dashboard, and can also be resized.
There are currently five Panel types: Graph, Singlestat, Dashlist, Table, and Text.
Panels like the Graph panel allow you to include as many metrics and series as you want. Other panels like Singlestat require a reduction of a single query into a single number. Dashlist and Text are special panels that do not connect to any Data Source.
Panels can be made more dynamic by utilizing Dashboard Templating variable strings within the panel configuration (including queries to your Data Source configured in the Query Editor). Utilize the Repeating Panel functionality to dynamically create or remove Panels based on the Templating Variables selected.
The time range on panels is by default the range set in the Dashboard time picker, although this can be overridden by utilizing panel-specific time settings.
Panels (or an entire Dashboard) can be easily shared in a variety of ways. For instance, you can send a URL to someone who has a user account on your NetEye system. You can also use the Snapshot feature to encode all the data currently being viewed into a static and interactive JSON document. It’s like emailing a screenshot, but also so much better because it will be interactive!
Dashboards
The Dashboard is where it all comes together. Dashboards can be thought of as of a set of one or more panels organized and arranged into one or more rows.
The time period for all panels in the dashboard can be controlled simultaneously by changing the dashboard time picker in the upper right of the Dashboard. Similarly, dashboards can utilize Templating to make them more dynamic and interactive.
Dashboards can even be tagged, and the dashboard picker provides quick, searchable access to all dashboards in a particular Organization.
Telegraf Metrics in NetEye
Telegraf is an agent written in Go for collecting, processing, aggregating, and writing metrics. To use it in NetEye you will need to install the telegraf package using yum.
Telegraf is entirely plugin-driven and has 4 distinct plugin types:
Input Plugins: Collect metrics from the system, services, or 3rd party APIs
Processor Plugins: Transform, decorate, and/or filter metrics
Aggregator Plugins: Create aggregate metrics (e.g. mean, min, max, quantiles, etc.)
Output Plugins: Write metrics to various destinations
For more information about Telegraf please refer to the official documentation on GitHub.
Configuration
Configuring User Permissions
User permissions in the ITOA module can be managed by configuring and assigning Roles in NetEye.
The ITOA Module can be accessed directly from the NetEye GUI (within the ITOA menu) using Single Sign On, if the logged user has permissions to access (see below). Upon the first access to ITOA from a user, that user will be created inside ITOA with ITOA permissions initialized.
Note
The ITOA menu entry will not be visible to the user, if he doesn’t have any of the listed Grafana Organization Role (i.e., Admin, Editor or Viewer) in NetEye.
User Management
In the ITOA Module, each Role can have one assigned Organization and a respective Organization Role, one of Admin, Editor, and Viewer). Optionally, a list of Teams belonging to the Organization can also be specified.
You can refer to the official Grafana docs to learn more about the user management model of Grafana with Organizations and related Permissions.
If a user belongs to more than one Role within different Organizations, they will be able to access each Organization. If a user belongs to more than one Role within the same Organization but different Organization Roles, they will be assigned the most permissive Organization Role ( Admin >> Editor >> Viewer ).
Example: For a Role in NetEye with the ability to edit, delete or create dashboards in the Grafana “Main Org.”, the **Organization* “Main Org.” must be configured with either the “*Editor” or the “Admin” Organization Role.
Performance Graph
To access the Performance Graph visible in the status page for each monitored object, a separate permission is required, but it is not necessary to set it to a specific Organization. Please note that this will expose the performance data of all monitored objects to all users that have this permission.
Configuration Form
The Analytics module adds the following fields for each role:
Organization:* The name of one Grafana organization. This setting also requires a role to be set. If the organization does not exist in Grafana, then nothing will happen.
Role: Either the
Viewer,EditororAdminrole that will be granted on the specified Organization.Teams: A comma-separated list of teams* which must exist in the specified organization.
analytics/view-performance-graph: Enabling this option will allow each user to see the Performance Graph for every monitoring object. However, this will have no effect on a user’s access rights inside Grafana, they will merely be able to navigate the Performance Dashboard from the monitoring view.
Installation and Configuration
On Linux, Telegraf is installed when the package is installed. On Windows, you will need to install the Telegraf agent from a binary setup file, which can be found at this path:
/neteye/shared/share/Telegraf/telegraf.exe
To configure a new instance ${INSTANCE} of Telegraf in NetEye, the following steps are necessary:
Create a new Telegraf configuration in:
/neteye/shared/telegraf/conf/${INSTANCE}.confThe easiest option is to use Telegraf to create a default file by executing:
telegraf config > /neteye/shared/telegraf/conf/${INSTANCE}.confThat file contains a complete list of configuration options as comments. Please refer to the official documentation on how to configure Telegraf for your specific use case.
To be able to run your Telegraf instance as a service, you will just need to start them using systemd using the following scheme
telegraf@${INSTANCE}.service. e.g. telegraf@test.service, will look for a/neteye/shared/telegraf/conf/test.conffilesystemctl start telegraf@%{INSTANCE}.service
Note: If you have a NetEye Cluster, you must ensure that each Telegraf instance is configured as a cluster service. If not, data will not be collected sometimes and/or written out multiple times.
Running Telegraf
The default telegraf instance can can be started as follows
systemctl start telegraf
Logs are collected by the journald agent and can be viewed by using
journalctl
journalctl -u telegraf
However, you can change the destination directory by setting the log file in the configuration file as follows:
logfile = "/neteye/shared/telegraf/log/telegraf.log"
Debugging output can be enabled by setting the debug flag to true in the configuration file:
debug = true
Visualizing Dashboards
We have fully integrated Grafana dashboards into NetEye, accessible by selecting ITOA in the left sidebar menu.
Adding a Dashlet
You can create a widget containing your ITOA Dashboard and add it to the NetEye home page by following the user guide in Using NetEye’s dashlets. Before copying the Grafana URL from the browser you can switch to your preferred Grafana visualization mode by clicking on the img/cycle_view_mode_icon.png icon
One click will remove the left menu
The second click will remove also the top bar
This website uses cookies that store your theme preferences. These cookies do not store any personally identifiable data.