Visualization
This sections describes how to see graphically, for example in Dashboards and maps, the outcome of NetEye’s checks and activities
Dashboard
If you launch NetEye with no hosts or services configured, you will see the empty dashboard shown in Fig. 121.
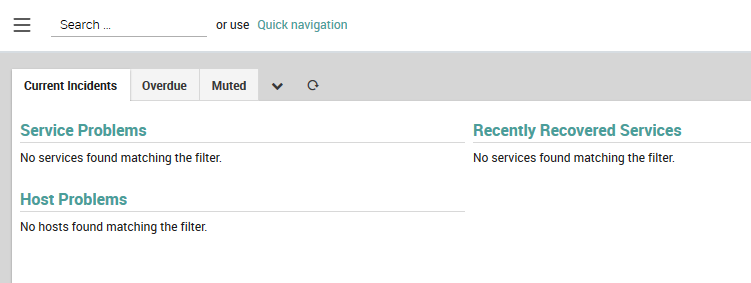
Fig. 121 Empty Dashboard when NetEye is used for the first time.
At the top of the initial dashboard are three default dashboard tabs, which you can click on to switch between the dashboards. The initial dashboards will remain empty until you configure hosts and servers in Director:
Current Incidents: Contains dashlets that list Service Problems, Host Problems, and Recently Recovered Services.
Overdue:* Shows hosts and services with unreturned check results, and acknowledgments and downtimes lasting at least three days.
Muted: Contains notifications about disabled host and services, disabled checks, and acknowledged problems.
Next to the three tabs are two icons: a “Chevron” menu for
customizing the dashboards, and a
refresh button.
Note
If you would like to customize your dashboard, we recommend that you start with a clean dashboard rather than a system-provided one.
The dashboard customization menu has two options:
Add dashlet: Add a dashlet to the currently selected dashboard. A dashlet can be any view within Icinga2 that has an associated URL.
Settings: This will display a panel allowing you to customize the currently selected dashboard by removing the current elements and sorting your custom elements (only your customized elements can be sorted).
Dashlets
Dashlets are the individual panels on a dashboard. To add a dashlet (see Fig. 122), follow these steps:
Copy the URL of the view you want to add from the browser’s URL bar while that view is open.
Go to the desired Dashboard, select “Add Dashlet” from the Chevron menu, and paste the URL from the previous step in the “Url” field. The URL can include filters and other options.
Give the dashlet a display title.
Check the box if you want to add it instead to a brand new dashboard (if so, give the new dashboard a title in the next field).
Otherwise, choose the dashboard you want to add the dashlet to from the list box.
Finally, click on the green “Add To Dashboard” button. Your new dashlet should now be visible on the selected dashboard.
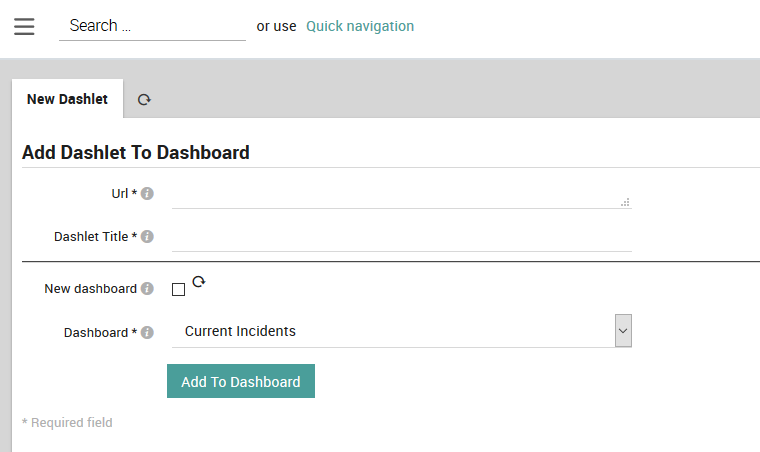
Fig. 122 The panel to add a new dashlet.
To add a new dashboard, select a view, copy its URL, and follow the procedure above to add a dashlet to a new dashboard. To customize your dashboard, select the Settings menu option, which will display the customization panel shown in Fig. 123. In NetEye you can:
Remove a dashboard or dashlet by clicking on the corresponding trash can icon
to the right.
Reorder dashlets by using the up- and down-arrows
,
shown at the right side of Fig. 123. Note that while you can remove the default dashlets, you cannot reorder them. The first dashlet is displayed at the top left of the dashboard, and each subsequent dashlet is shown to the right of the previous one until it wraps around to the next row. To completely customize your dashboard, you should start with a new, blank one.
Edit a dashlet in a dashboard by clicking on the corresponding dashlet name to the left, as shown in Fig. 124
Modify a dashlet’s behavior by clicking on the dashlet’s URL as shown in Fig. 125, for example to change the filtering and search parameters.
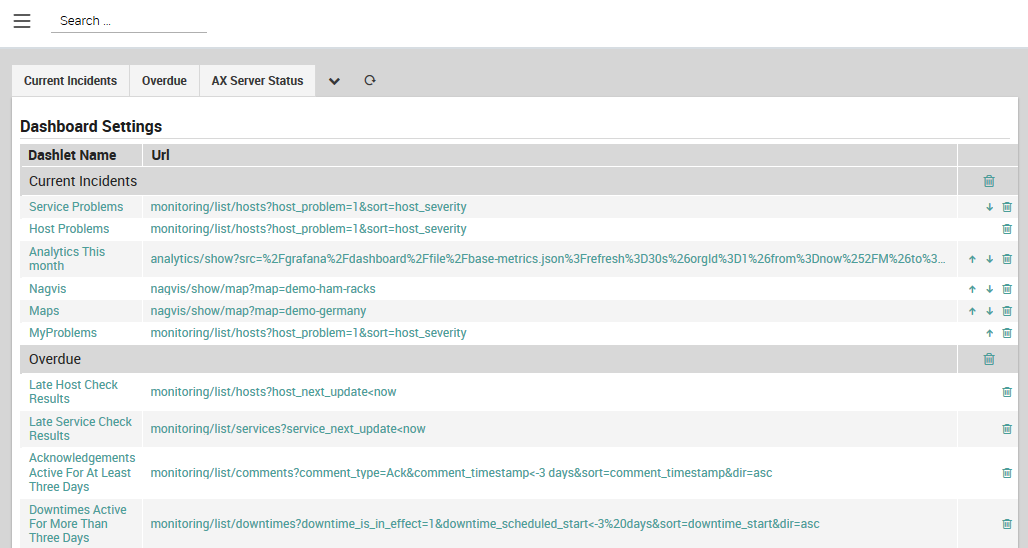
Fig. 123 The dashboard customization panel.
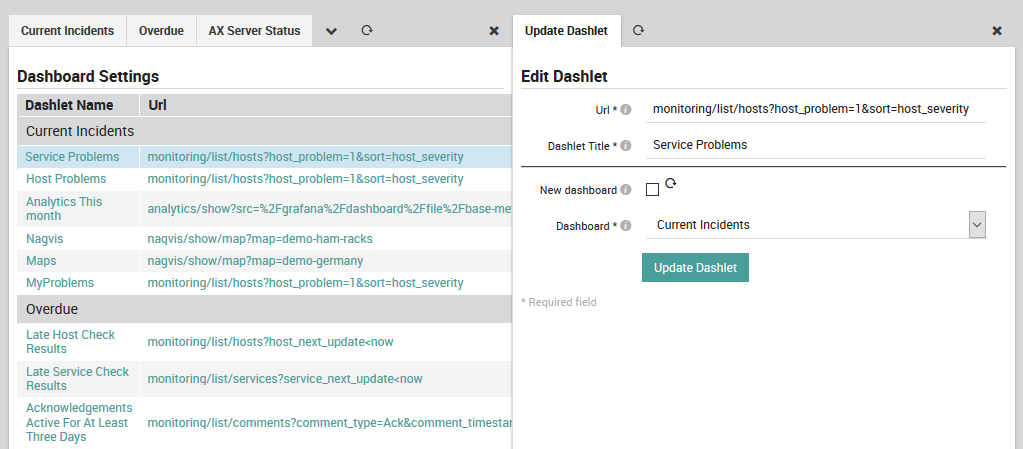
Fig. 124 Editing a dashlet.

Fig. 125 Modifying a dashlet’s behavior.
Monitoring Status
Permissions
The monitoring module provides an additional set of restrictions and permissions that can be used for access control. The following sections will list those restrictions and permissions in detail:
The monitoring module allows to send commands to an Icinga 2 instance. A user needs specific permissions to be able to send those commands when using the monitoring module.
Name |
Permits |
|---|---|
monitoring/command/* |
Allow all commands. |
monitoring/command/schedule-check |
Allow scheduling host and service checks. |
monitoring/command/schedule-check /active-only |
Allow scheduling host and service checks. (Only on objects with active checks enabled) |
monitoring/command/acknowledge-pr oblem |
Allow acknowledging host and service problems. |
monitoring/command/remove-acknowl edgement |
Allow removing problem acknowledgements. |
monitoring/command/comment/* |
Allow adding and deleting host and service comments. |
monitoring/command/comment/add |
Allow commenting on hosts and services. |
monitoring/command/comment/delete |
Allow deleting host and service comments. |
monitoring/command/downtime/* |
Allow scheduling and deleting host and service downtimes. |
monitoring/command/downtime/sched ule |
Allow scheduling host and service downtimes. |
monitoring/command/downtime/delet e |
Allow deleting host and service downtimes. |
monitoring/command/process-check- result |
Allow processing host and service check results. |
monitoring/command/feature/instan ce |
Allow processing commands for toggling features on an instance-wide basis. |
monitoring/command/feature/object /* |
Allow processing commands for toggling features on host and service objects. |
monitoring/command/feature/object /active-checks |
Allow processing commands for toggling active checks on host and service objects. |
monitoring/command/feature/object /passive-checks |
Allow processing commands for toggling passive checks on host and service objects. |
monitoring/command/feature/object /notifications |
Allow processing commands for toggling notifications on host and service objects. |
monitoring/command/feature/object /event-handler |
Allow processing commands for toggling event handlers on host and service objects. |
monitoring/command/feature/object /flap-detection |
Allow processing commands for toggling flap detection on host and service objects. |
monitoring/command/send-custom-no tification |
Allow sending custom notifications for hosts and services. |
Restrictions
The monitoring module allows filtering objects:
Keys |
Restricts |
|---|---|
monitoring/filter/objects |
Applies a filter to all hosts and services. |
This filter will affect all hosts and services. Furthermore, it will also affect all related objects, like notifications, downtimes and events. If a service is hidden, all notifications, downtimes on that service will be hidden too.
Filter Column Names
The following filter column names are available in filter expressions:
Column |
Description |
|---|---|
instance_name |
Filter on an Icinga 2 instance. |
host_name |
Filter on host object names. |
hostgroup_name |
Filter on hostgroup object names. |
service_description |
Filter on service object names. |
servicegroup_name |
Filter on servicegroup object names. |
all custom variables prefixed with
|
Filter on specified custom variables. |
Restrict Access to Custom Variables
Restriction name: monitoring/blacklist/properties
Restriction value: Comma separated list of GLOB like filters
Imagine the following host custom variable structure:
host.vars.
|-- cmdb_name
|-- cmdb_id
|-- cmdb_location
|-- wiki_id
|-- passwords.
|   |-- mysql_password
|   |-- ldap_password
|   `-- mongodb_password
|-- legacy.
|   |-- cmdb_name
|   |-- mysql_password
|   `-- wiki_id
`-- backup.
    `-- passwords.
        |-- mysql_password
        `-- ldap_password
host.vars.cmdb_name
Blacklists cmdb_name in the first level of the custom variable
structure only. host.vars.legacy.cmdb_name is not blacklisted.
host.vars.cmdb_*
All custom variables in the first level of the structure which begin
with cmdb_ become blacklisted. Deeper custom variables are ignored.
host.vars.legacy.cmdb_name is not blacklisted.
host.vars.*id
All custom variables in the first level of the structure which end with
id become blacklisted. Deeper custom variables are ignored.
host.vars.legacy.wiki_id is not blacklisted.
host.vars.*.mysql_password
Matches all custom variables on the second level which are equal to
mysql_password.
host.vars.*.*password
Matches all custom variables on the second level which end with
password.
host.vars.*.mysql_password,host.vars.*.ldap_password
Matches all custorm variables on the second level which equal
mysql_password or ldap_password.
host.vars.**.*password
Matches all custom variables on all levels which end with password.
Please note the two asterisks, **, here for crossing level
boundaries. This syntax is used for matching the complete custom
variable structure.
If you want to restrict all custom variables that end with password for both hosts and services, you have to define the following restriction.
host.vars.**.*password,service.vars.**.*password
Escape Meta Characters
Use backslash to escape the meta characters
*
,
host.vars.\*fall
Matches all custom variables in the first level which equal *fall.
Add Columns to List Views
The monitoring module provides list views for hosts and services. These lists only provide the most common columns to reduce the backend query load.
If you want to add more columns to the list view e.g. in order to use
the URL in your dashboards or as external iframe integration, you need
the addColumns URL parameter.
Example for adding the host address attribute in a host list::
http://localhost/icingaweb2/monitoring/list/hosts?addColumns=host_address
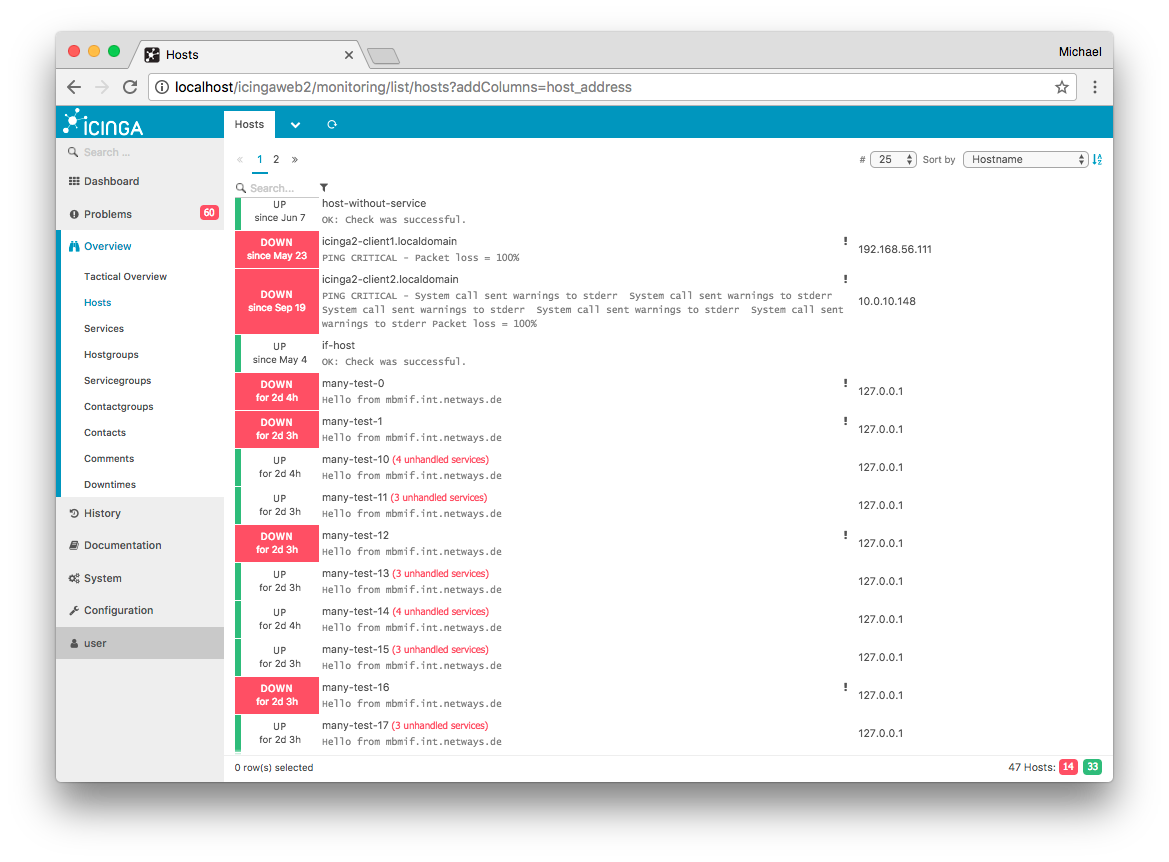
Fig. 126 Screenshot
Example for multiple columns as comma separated parameter string. This
includes a reference to the Icinga 2 host object custom attribute os
using _host_ as custom variable identifier:
http://localhost/icingaweb2/monitoring/list/services?addColumns=host_address,_host_os
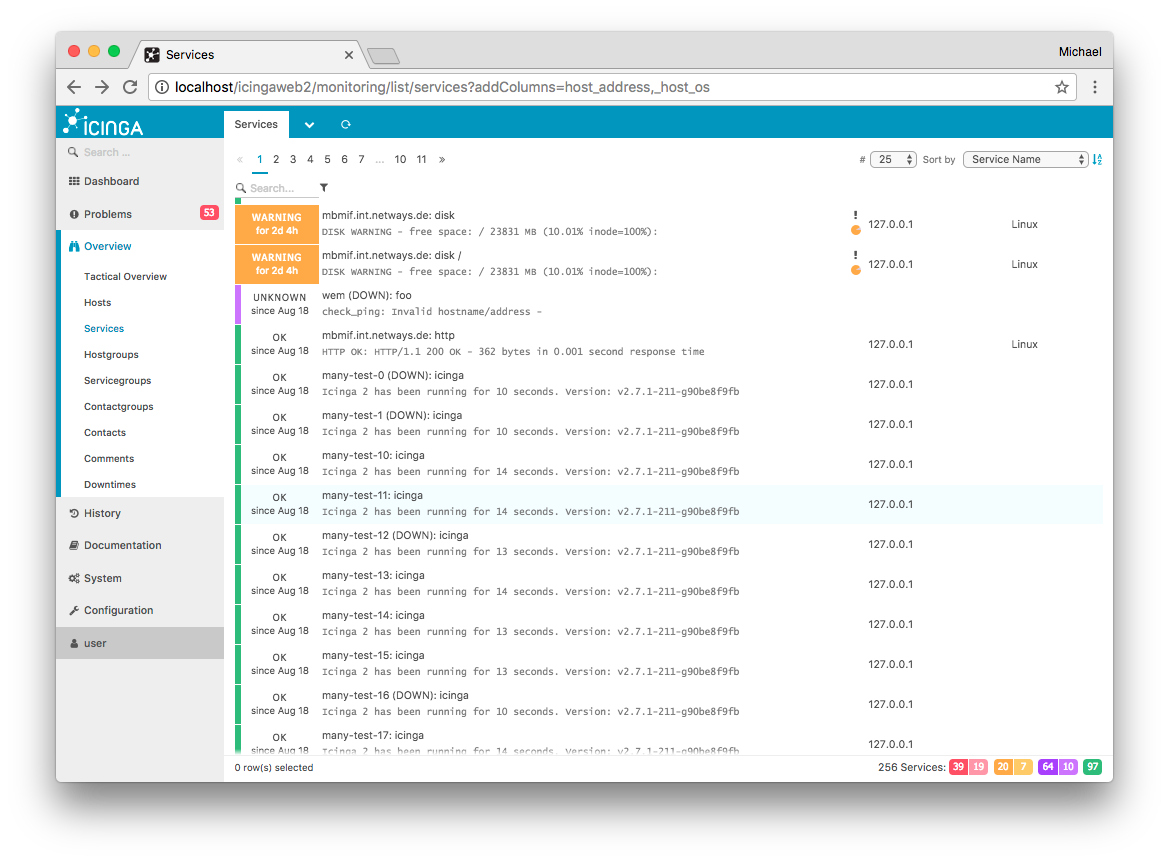
Fig. 127 Screenshot
Protecting Credentials in the Monitoring Views
The monitoring views display the values for all fields configured for a host or service. These views will also display any custom variables you define as fields in the view. If one or more fields contain sensitive information such as MySQL accounts, passwords, or SNMP Community Strings, best practice is to hide the values of those fields in the monitoring views (they will remain visible in Director’s configuration panels).
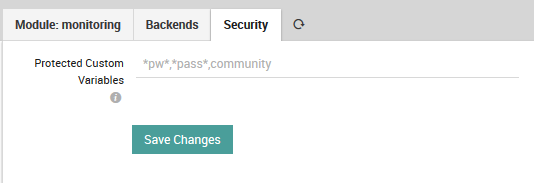
Fig. 128 Specifying fields containing credentials.
You can do this by going to Configuration > Modules > monitoring > Security (Fig. 128) and setting a pattern that will hide the values for all fields derived from custom variables where those fields’ names match the pattern. This pattern goes in the field “Protected Custom Variables”, where the syntax is defined by Icinga.
To summarize, this field should contain a comma separated list of case insensitive pattern strings, where * is the only allowed matching operator. Note that any spaces you include will count as part of the pattern between commas. The field is initially empty, with the suggested example *pw*,*pass*,community*, which would match the strings “pw”, “password”, and “Community”, among others.
If a field name matches the pattern, then that field’s value will be replaced with asterisks as shown in Fig. 129, hiding the real contents from view.

Fig. 129 Protected password in the host monitoring view.
Monitoring view
The Monitoring panels in NetEye are divided into several sections, each carrying different information. Access to the Monitoring View requires the user to have a role with appropriate permissions in the Monitoring module; a Role with General Access Module usually suffices for this purpose.
Starting from Release 4.14, the new monitoringview module introduces a new functionality to selectively hide or show each section of the monitoring panels to a role - and therefore to a user. You can grant these permissions in Configuration > Authentication > Roles under the monitoringview module; each section as an associated permission with the same name:
Plugin Output:
monitoringview/plugin-outputProblem handling:
monitoringview/problem-handlingPerformance Data:
monitoringview/performance-dataNotifications:
monitoringview/notificationsCheck execution:
monitoringview/check-executionFeature Commands:
monitoringview/feature-commandCustom variables:
monitoringview/custom-variables
Note
Monitoring Panels have two additional sections,
Performance Graph and Quick Actions, which are not managed
within this module. You can hide or show these sections by modifying
the corresponding permission in their modules:
Performance Graph: Already present in ITOA module, this section can be hidden or shown by acting on
general module accessandanalytics/view-performance-graphpermission from analytic module.Quick Actions: It is a monitoring module permission that can be used to hide complete or specific command with the
monitoring/command/*permission. This Quick Actions section has commands likecheck now,Comment,Notification,Downtime.
Using the Custom Problem View
Access to the Problem View requires the user to have a role with appropriate permissions in the Monitoring module; a Role with General Access Module suffices for the purpose.
Starting from Release 4.13, a new functionality has been added to
the Problems View. The new module customproblemview indeed, defines a
new permission in the form of a filter called
customproblemview/excludefilter/objects, which allows to define a
suitable filter to show only a subset of host problems, service
problems, or both.
In Configuration > Authentication > Roles, you can define the
customproblemview/excludefilter/objects, that represents the
monitoring filter, selecting the monitoring objects you want to filter
out from the Problem View.
For example, let’s suppose that your monitoring system is monitoring
both production and test environments. All hosts belonging to test
environment belong to a “test-system” hostgroup. If you wan to see only
the production hosts in the Problem View, you just need to create a role
with the proper filter in customproblemview/excludefilter/objects
(e.g. hostgroup=test-system).
Note that if a user belongs to more than one role with a specified
customproblemview/excludefilter/objects, the filter will become more
and more selective, showing only objects that belong to all the filters.
Performance Graphs
When you need to go beyond having a single, default dashboard for every host, it’s time to make a customized dashboard for those hosts that need them.
Custom Dashboards for Hosts and Services
If you need to create a custom dashboard for a particular service/host, you can set the parameter in Director’s service/host configuration. The custom dashboard should be specified as dataSource/dashboardName.
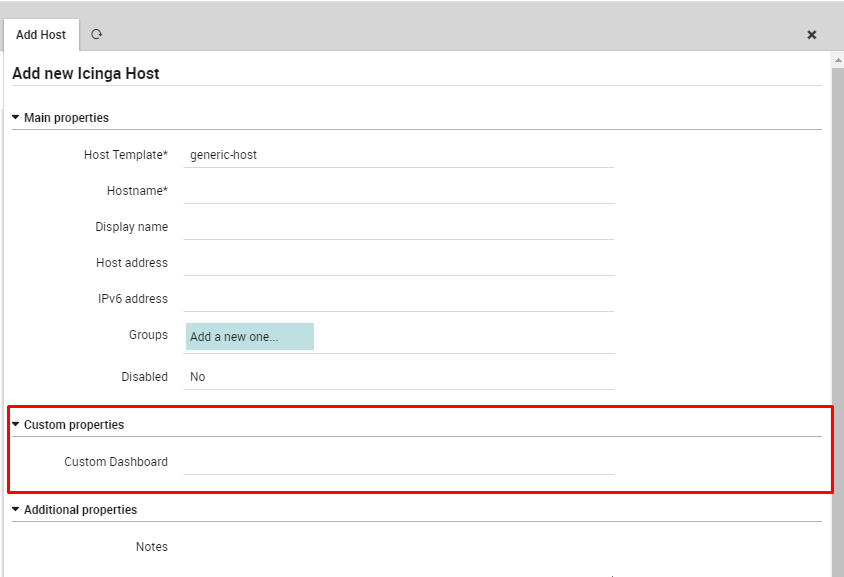
Fig. 130 ITOA hook configuration
The following steps show how you can create just such a custom dashboard field (for a service, follow the procedure below while starting from a service configuration rather than from a host).
First, click on Director in the left navigation sidebar, scroll to the bottom of the page, and select “Define Data Field” (Figure 2).
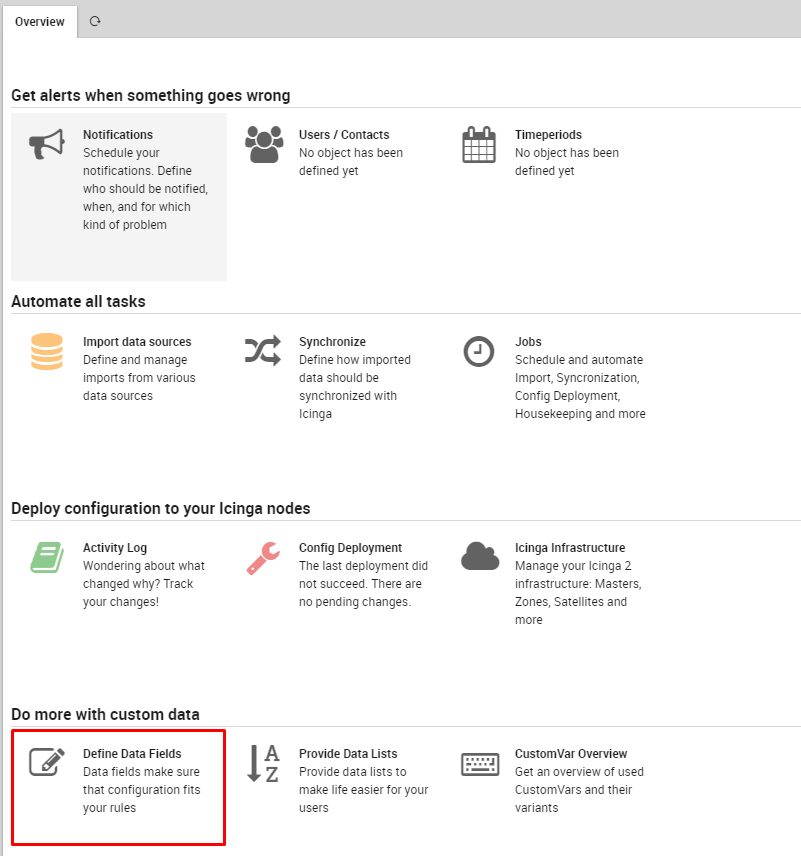
Fig. 131 Director Data Field
Now click “Add” and create a field with the field name set to custom_analytics_dashboard, then enter a caption of your choice (like “Custom Dashboard” in Figure 3).
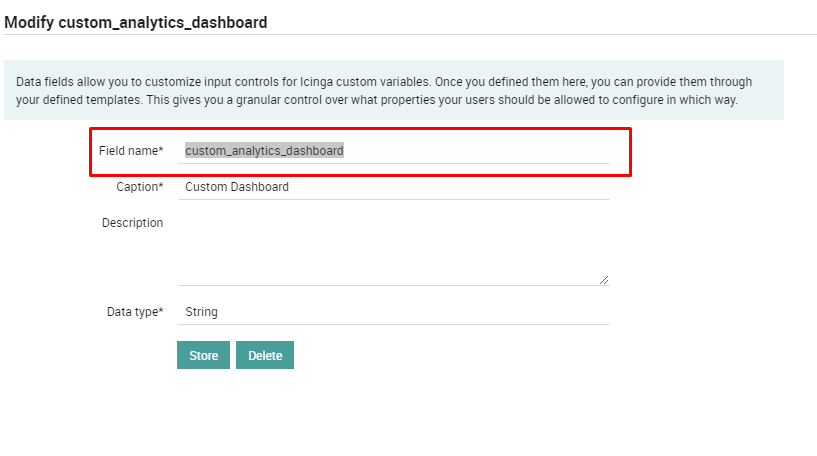
Fig. 132 Custom ITOA Dashboard Field
Once you add the new data field, you should add it to a service/host template. Open an existing template or create a new one (the same procedure works both for hosts and services). Click on the Fields tab, select the custom_analytics_dashboard field in the drop down box, and add that field to the template. (Do not set it as mandatory, because not all hosts/services will have or need a custom ITOA dashboard.)
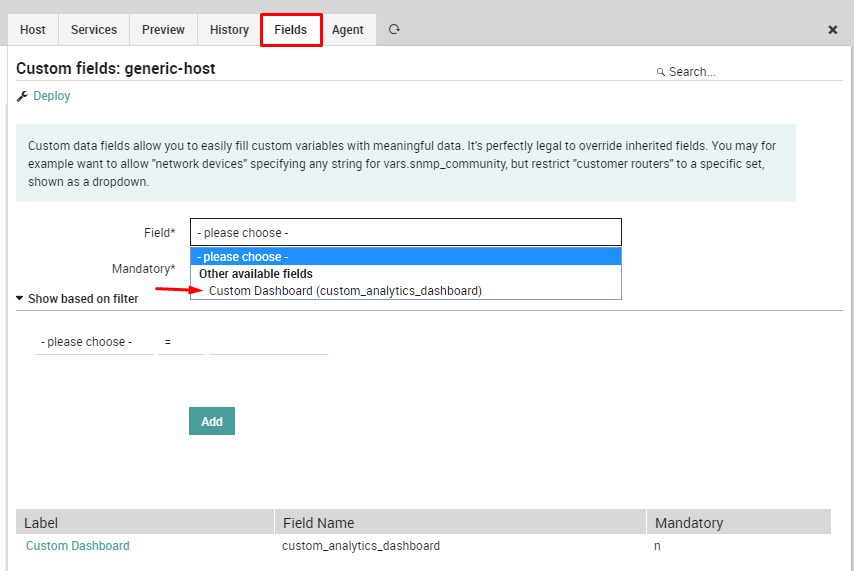
Fig. 133 Add Custom Field To Template
Lastly, deploy the final configuration. Now you can create a new host/service starting from the modified template and add a custom ITOA dashboard to it.
Maps
Map Viewer
When you click on the Geo Map menu item, you will see a list of the available, defined maps (Fig. 134). Clicking on a map entry will take you to the map itself.
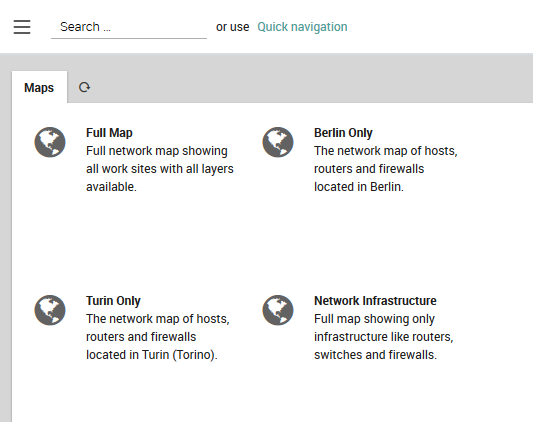
Fig. 134 List of available maps.
On the map, clicking on a marker will show the monitoring view for the host(s) associated with that marker in a panel to the right (see the section on The Host Information Page below.)
The pushpin icon at the top left will reposition the map at your inferred location with a blue dot representing you, and the estimated position error with a larger light blue circle (Fig. 135). You can enable and disable layers with the checkbox panel at the top right.
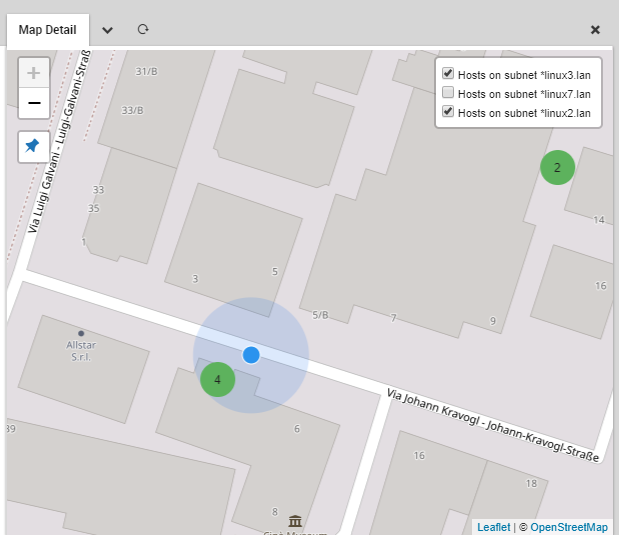
Fig. 135 Viewing the map and localizing your position.
You can add a map whose properties you have configured to the dashboard as a dashlet. Set the active map layers as desired, and then select “Add To Dashboard” from the chevron menu next to the map panel’s title. The URL with the active layers will be automatically filled in for you, and you only need to fill in the dashlet’s title.
The Host Information Page
The host information page contains data on the hosts located at a location represented by a marker on the map. It opens as a panel on the right side of the screen (Fig. 136) and contains the following:
- (Cluster) State: The state of the host (or hosts) as determined
by the status calculation.
Common Host Information: Information that is the same for all hosts at the marker, which typically includes at least the geographical coordinates. If optional fields are present, they follow the order determined in the Map Configurator.
Detailed Information: A list of all hosts whose fields contain values that differ from each other.
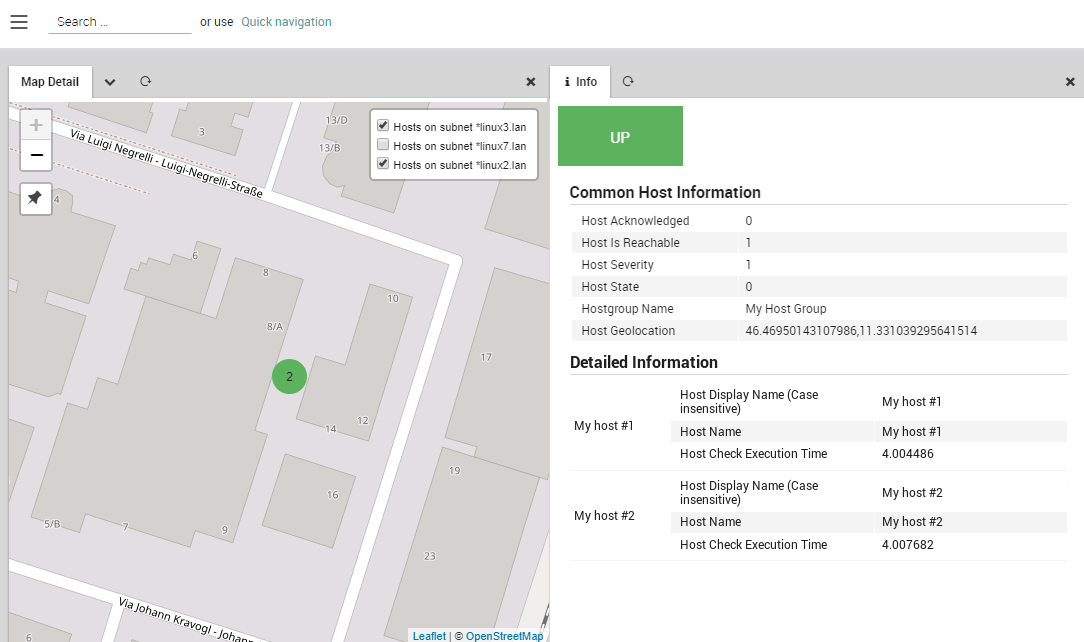
Fig. 136 The host information page.
The NetEye Geo Map Visualizer
The NetEye Geo Map module allows you to overlay the position and status of hosts on top of a customizable map based on OpenStreetMap. You can access Geo Map by clicking on the “Geo Map” menu item to the left.
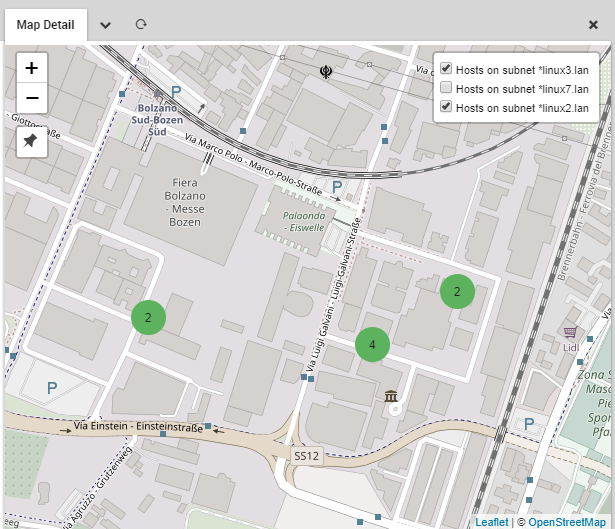
A Geo Map map.
Geo Map Features
Geo Map uses a standard map interface that allows you to zoom in and out of your chosen map. On each map you can place map markers corresponding to hosts or groups of hosts, where the color of the marker reflects the current status of the monitored objects. Alternatively, markers can be configured to display the status of a host’s services rather than the host status itself.
When multiple markers are placed at the same location, e.g. a server room, the marker will show the worst status of all hosts or services included in that marker. Clicking on a marker will launch a panel containing information on all hosts represented by that marker.
Hosts are assigned to map layers as elements of a host group. Each layer can be enabled and disabled via the map interface. You can optionally save any map as a dashlet on the NetEye dashboard, including multiple dashlets of the same map each having different layers enabled.
The Geo Map module is fully integrated with Lampo search and IcingaWeb2 Global search. With both search tools you can query for map names and find results both for map configuration and the map itself.
By default it is integrated with Audit Log module, which means that every change done in the module configuration is logged and tracked into the Audit Log section (see Auditlog user guide). If the Audit Log module is not installed this feature is disabled. Following, the list of the tracked actions:
Map create, modify and delete.
Layer create, modify, delete and sorting.
Field list modify and sorting.
Module configuration modify.
The Geo Map module also allows you to add map plugins that are compatible with the Leaflet JavaScript library.
Configuring Geo Maps
NetEye is pre-configured to use OpenStreetMap’s standard tile layer as a map tile server. Should you desire to change to a different server that is compatible with OpenStreetMap, go to Configuration > Modules > geomap and find the field “Server Url for Tiles”. Change the URL structure, making sure to keep the placeholder variables ({s}, {x}, etc.) in the correct positions in the new URL so that the appropriate tiles will be retrieved from the new tile server.
The OpenStreetMap.org URL format is the following:
Var |
Explanation |
|---|---|
s |
A subdomain to get around limitations by browsers on the number of simultaneous HTTP connections to the tile server. |
x |
The index of a map tile along the x-axis of the map under spherical Mercator projection. |
y |
The index of a map tile from the North pole (0) to the South pole (2z - 1). |
z |
The zoom level, where 0 represents the entire world, 18 is the maximum zoom, and each level n in between represents a 2n by 2n zoom factor. |
In the same panel, you can also configure the maximum radius in map pixels that will determine which hosts are included in a cluster.
Entering Device Coordinates
For each device (host, router, etc.) that you wish to appear on the map, you will have to enter its longitude and latitude in its configuration within Director. For instance, for a host, navigate to Director > Host objects > Hosts, then click on the desired host (optionally, you can set the coordinates for a wide range of hosts/devices by setting them for a Host Template).
Next, scroll down to and expand the “Custom properties” section. You will see the field “Location (lat,lng)” next to a text field with a globe icon below it. Clicking on that icon allows you to use a world map to set the coordinates with the MapDataType plugin rather than entering them by hand.
To use the plugin map, click on the pushpin and wait until the map has changed to your position. (You may need to explicitly tell your browser to allow location access.) Zoom out to ensure that the localization is correct, and then left click on the exact position (to drag the map, left click and hold the cursor while you move). Then click on the “check” button below the map. The coordinates of the location you selected will then automatically be entered in the location field.
If instead you prefer to enter the coordinates by hand, you can type then directly into the text field, or disable the MapDataType plugin with the following shell command:
# icingacli module disable mapDatatype
Configuring Maps
To create a new map, go to Geo Map > Configurator > Maps
Configurator and click on Add. (To edit an existing map, just
click on the map’s tile instead.) Then in the Add Map panel that
appears, fill in the following values:
Name: The name of this map that distinguishes it from other maps.
Description: Add a short description that better explains the map.
Show counts in cluster installation: If set to yes, the map will display all the monitored objects with the same geo-location under a single cluster-icon, displaying the number of “clusterized” objects. Otherwise, a single marker will appear, showing the icon set for the upper layer visible on the map.
Status calculation: Selects the method that chooses how to set a map marker’s color
Host status: The color corresponding to the status of the host at that marker (or all hosts at that cluster of markers).
Services worst state of all hosts: The color corresponding to the worst status of any service over the host at that marker (or all hosts at that cluster of markers).
There are two additional tabs on the right for creating layers that will appear on the map and fields that will appear on the host information page. These are described in the sections below.
Configuring Layers
Each layer that appears on a map represents the location and status for a set of hosts. Map Layers allow you to toggle the visibility of each layer independently of the others, without having to change the visibility of each host individually.
You can see the layers associated with a map by going to Geo Map > Configurator > Map > Map Layers. Each layer corresponds to a row in the table, consisting of the layer’s name and ordering options. Layer ordering works on the order of processing principle, where each layer is processed in turn, with information from farther down the table overwriting any information already written out earlier.
To add a new layer to the map, click on Add. (To edit an existing map,
just click on the map’s name.) Then in the Add Layer panel that appears,
fill in the following values:
Layer Name: The name of this layer to distinguish it from other layers.
Enabled by default: Whether this layer is visible when you first load a new map.
Icon for markers: A field to insert an SVG icon for markers (in an XML text representation).
Host Groups: The hosts to include (via their host groups) in this layer. Use the multi-select tool to select host groups by moving them to the box on the right. You can include a host group in more than one layer if desired.
You can use custom marker icons, with a distinct icon for each layer. In the “Icon for markers” field, insert the XML text for an SVG icon (SVG is required so that the icon can change color reflecting the current host status). You will need to edit the icon XML to make sure that it doesn’t contain any width or height attributes that may cause the icon to be too large or small. By default, the text area will include the XML of a standard marker SVG icon when you initially create the layer.
Custom icons will only be shown either when there is a single host at that point on the map, or when all hosts in a cluster have the same icon type. Otherwise, the default map icon will be displayed to avoid showing multiple icons at the same point.
Note
the host groups that are available in the left side of the multi-select tool are those that have at least one host configured in Director with valid coordinates for the “Location” property.
Configuring Fields
To add fields that you would like to appear on a host’s information page to a particular map, go to Geo Map > Configurator > Map > Map Fields. Then choose the fields that you want to be displayed on the host information page for that map.
To select fields, use the multi-select tool to move them to the box on the right. You can also change the order of the fields you have selected by clicking on that field and pressing the up or down button. The order in which the fields appear here will be reflected in the order they are shown on the host information page.
User Permissions in Geo Map
A NetEye 4 administrator can set 3 types of Geo Map permissions for users via Roles:
Map Admin: Create, modify and view maps.
Map Editor: Modify and view maps, where map names can be filtered by a regular expression set by a system admin (where no regex means all maps can be modified or viewed).
Map Viewer: View maps, where map names can be filtered by a regular expression set by a system admin (where no regex means all maps can be modified or viewed).
To set the regex filters, a NetEye administrator can go to the Roles page at Configuration > Authentication and fill in the “geomap/filter/maps” field.
Authorization (nagvis)
Permissions
Name |
Description |
|---|---|
nagvis/overview |
NagVis general overview |
nagvis/edit |
Modify all NagVis maps |
nagvis/admin |
NagVis administration |
Restrictions
Name |
Description |
|---|---|
nagvis/map/filter |
Comma-separated set of case insensitive map name patterns (wildcard: *) a role is allowed to view |
Aggregated view
Overview (Cube)
The Cube module shows statistics and state for hosts and services grouped by the custom properties that they have been configured with. The subsets of monitored objects are then displayed in up to three dimensions for a quick overview to show the differences between them.
It is especially helpful in large environments, and can help give quick answers to questions like:
Which project uses how many servers per environment at which location/site?
How many of those are used in production?
Which operating system is used for which project and in which environment?
Are we still using Debian Lenny?
Do we have applications where the operating systems used differ in staging and production?
Which project uses which operating system version for which application?
Which projects have homogeneous environments?
Which projects are at a consistent patch level?
How many RHEL 6 variants (6.1, 6.2, 6.3…) do we use?
Who is running the oldest ones? In production?
Which projects are still using physical servers in which environments?
You can ask as many questions as you have combinations of configured custom properties. The results are displayed with as many boxes as there are values of the highest priority custom property.
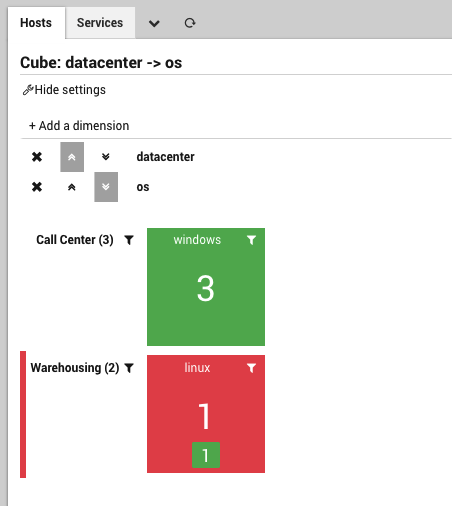
Fig. 137 Cube Dashboard
User Permissions
The Cube module checks restrictions set in the monitoring module and only shows those monitored objects that the user is allowed to view (this includes counts and states). Blacklist properties also restrict what can be viewed. Restrictions applied to other modules will have no effect.
Getting Started
To use Cube in NetEye 4, click on the “Reporting” section in the left-side navigation bar, and then the “Cube” subsection.
Note that if you haven’t yet configured any custom properties for monitored objects, you will see an empty dashboard.
As an example, consider the custom properties “Datacenter” and “Operating System” that have been configured with values on a set of monitored objects:
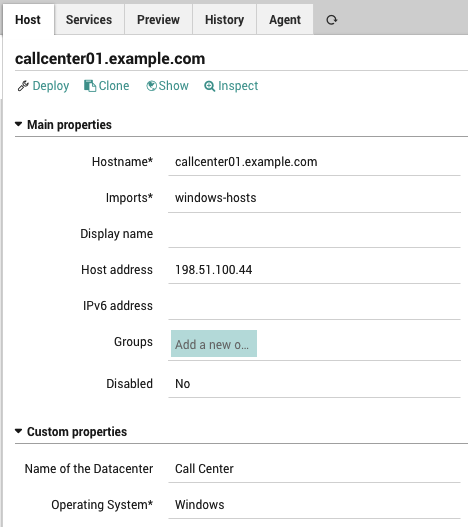
Fig. 138 Host Custom Properties
You can view the resulting Cube as shown in Figure 1, where each box shows the worst state and number of hosts for each discrete value of “datacenter”. You can then further drill down and rotate the cube by adding and reprioritizing parameters (dimensions) in the dashboard.

