Concepts
This section presents the overall NetEye’s architecture and the available monitoring functionalities. The section is completed by an overview of the Orchestrated Datacenter Shutdown functionality and its integration with NetEye.
Architecture
Active Monitoring
As expressed in the Icinga2 Documentation, the monitoring environment is organized according to Roles and Zones. In Icinga2 you do not communicate directly with individual monitored computers, but instead commands are passed along an encrypted set of paths defined according to their Role:
Master: The node which sends your monitoring configurations to monitored objects, controlled by IcingaWeb2 and Director.
Satellite: A node which forwards configurations from the master to each client in its zone.
Client: A node which receives configurations from a satellite, implements them, runs checks, and reports back the results.
Note
In order to use all the functionalities of NetEye 4, use our Icinga2 Packages userguide to get icinga2 packages for different OS/distributions via the NetEye repositories for Icinga2 agent installation.
Zones are logical collections of clients that should receive similar configuration sets, headed by a Satellite.
Endpoints are nodes which are members of a zone, and are characterized mainly by their IP address for implementing secure communication.
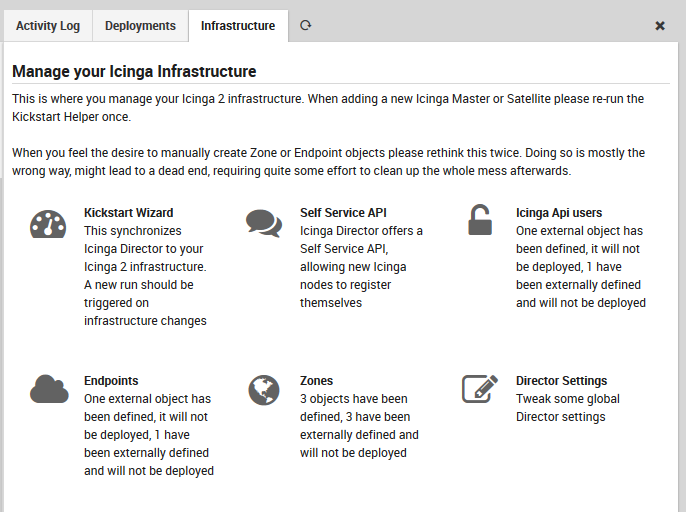
The monitoring environment is configured within the Director module. You can configure Zones and Endpoints by using the Infrastructure menu within Director as in Fig. 14.

Fig. 14 The infrastructure menu in Director
The Zones panel allows you to create new Master and Satellite nodes, as shown in Figure 2. Here you can add, modify, and preview zones.

Fig. 15 The Zones management panel
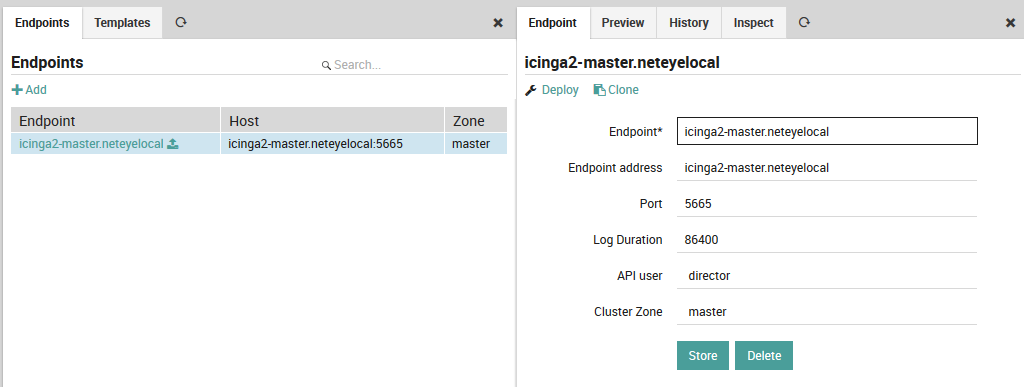
Similarly, the endpoints panel allows you to create, modify and preview endpoints, as in Figure 3.

Fig. 16 The Endpoints management panel
For further information about configuring your monitoring setup, go to next section, Configuration.
Passive Monitoring
NetEye’s passive monitoring abilities count on Tornado, a Complex Event Processor that receives reports of events from data sources such as monitoring, email, and telegram, matches them against pre-configured rules, and executes the actions associated with those rules, which can include sending notifications, logging to files, and annotating events in a time series graphing system.
Tornado is a high performance, scalable application, and is intended to handle millions of events each second on standard server hardware. This

Fig. 17 Tornado architecture
Tornado Architecture
Tornado is structured as a library, with three example binaries included that show how it can be used. The three main components of the Tornado architecture are:
The Tornado Collector(s), or just Collector(s)
The Tornado Engine, or Engine
The Tornado Executor(s), or Executor(s)*
The term Tornado refers to the whole project or to a deployed system that includes all three components.
Along with the main components, the following concepts are fundamental to the Tornado architecture:
A Datasource: A system that sends External Events* to Tornado, or a system to which Tornado subscribes to receive External Events.
An External Event: An input received from a datasource. Its format depends on its source. An example of this is events from rsyslog.
A Tornado (or Internal) Event: The Tornado-specific Event format.
A Rule: A group of conditions that an Internal Event must match to trigger a set of Actions.
An Action: An operation performed by Tornado, usually on an external system. For example, writing to Elastic Search or setting a state in a monitoring system.
Architecturally, Tornado is organized as a processing pipeline, where input events move from collectors to the engine, to executors, without branching or returning.
When the system receives an External Event, it first arrives at a Collector where it is converted into a Tornado Event. Then it is forwarded to the Tornado Engine where it is matched against user-defined, composable Rules. Finally, generated Actions are dispatched to the Executors.
The Tornado pipeline:
Datasources (e.g. rsyslog)
  |
  | External Events
  |
  \-> Tornado Collectors
        |
        | Tornado (or Internal) Events
        |
        \-> Tornado Engine (matches based on Rules)
              |
              | Actions
              |
              \-> Tornado Executors (execute the Actions)
Collectors
The purpose of a Collector is to receive and convert external events into the internal Tornado Event structure, and forward them to the Tornado Engine.
Collectors are Datasource-specific. For each datasource, there must be at least one collector that knows how to manipulate the datasource’s Events and generate Tornado Events.
Out of the box, Tornado provides a number of Collectors for handling inputs from snmptrapd, rsyslog, JSON from Nats channels and generic Webhooks.
Because all Collectors are defined with a simple format, Collectors for new event types can easily be added or extended from existing types for:
Monitoring events
Email messages
Telegram
DNS
Cloud monitoring (AWS, Azure, Cisco/Meraki, etc.)
Netflow
Elastic Stack
SMS
Operating system and authorization events
Engine
The Engine is the second step of the pipeline. It receives and processes the events produced by the Collectors. The outcome of this step is fully defined by a processing tree composed of Filters and Rule Sets.
A Filter is a processing node that defines an access condition on the children nodes.
A Rule Set is a node that contains an ordered set of Rules, where each Rule determines:
The conditions a Tornado Event has to respect to match it
The actions to be executed in case of a match
The processing tree is parsed at startup from a configuration folder where the node definitions are stored in JSON format.
When an event matches one or more Rules, the Engine produces a set of Actions and forwards them to one or more Executors.
Executors
The Executors are the last element in the Tornado pipeline. They receive the Actions produced from the Engine and trigger the associated executable instructions.
An Action can be any command, process or operation. For example it can include: * Forwarding the events to a monitoring system * Logging events locally (e.g., as processed, discarded or matched) or remotely * Archiving events using software such as the Elastic Stack * Invoking a custom shell script
A single Executor usually takes care of a single Action type.
Tornado Crates Documentation Links
Tornado’s crate docs are produced according to the Rust documentation standards. The shortcuts below, organized thematically, will take you to the documentation for each module.
Common Traits and Code
The Common API page describes the API and defines the Event and Action structures.
The Logger page describes how Tornado logs its own actions.
Collectors
This crate describes the commonalities of all Collector types.
Describes a collector that receives a MIME email message and generates an Event.
This page illustrates the Collector for JSON events using the JMESPath JSON query language.
Presents the standard JSON collector that deserializes an unstructured JSON string into an Event.
Engine
The Matcher page describes the structure of the rules used in matching.
Executors
This crate describes the commonalities of all Executor types.
This page describes how the Archive executor writes to log files on locally mounted file systems, with a focus on configuration.
The Icinga2 executor forwards Tornado Actions to the Icinga2 API.
The Logger executor simply outputs the whole Action body to the standard log at the info level.
The Executor Script page defines how to configure Actions that launch shell scripts.
Network
This page contains high level traits not bound to any specific network technology.
Describes tests that dispatch Events and Actions on a single process without actually making network calls.
Executables
Describes the structure of the Tornado binary executable, and the structure and configuration of many of its components.
An executable that processes incoming emails and generates Tornado Events.
An executable that subscribes to Icinga2 Event Streams API and generates Tornado Events.
An executable that subscribes to Nats channels and generates Tornado Events.
The description of a binary executable that generates Tornado Events from rsyslog inputs.
A Perl trap handler for Net-SNMP’s to subscribe to snmptrapd events.
A standalone HTTP server binary executable that listens for REST calls from a generic Webhook.
Tornado License
Licensed under the Apache License, Version 2.0 <LICENSE-APACHE or https://www.apache.org/licenses/LICENSE-2.0> or the MIT license <LICENSE-MIT or https://opensource.org/licenses/MIT>, at your option. All files in the project carrying such notice may not be copied, modified, or distributed except according to those terms.
Business Monitoring
Business Monitoring allows you to:
Visualize part of your IT infrastructure in a hierarchical way
See the Business Impact of individual services
Check what would happen in case you power down a specific server
Would it have any influence on your most important services?
Which applications would be affected?
Create custom process-based dashboards
Trigger notifications at the process or sub-process level
Provide a quick top-level view for thousands of components on a single screen
The following list contains a few pointers for the use of the Business Monitoring
How to configure the business process node container
How to create your first node and populate that container with intermediate nodes, hosts and services
How to use the various web tools to improve and customize your views
How to manage sets of configurations
See also
The updated documentation for these topics can be found at the following link:
https://icinga.com/docs/icinga-business-process-modelling/latest/
Orchestrated Datacenter Shutdown
Shutting down large numbers of hosts can be very useful in the event of emergencies like fire or extended power loss. Shutting down servers in an orderly manner can prevent data loss and speed up recovery time.
The Shutdown Manager lets you define one or more shutdown groups, either manually, or automatically when triggered by a condition based on monitoring results. For a higher efficiency, groups have a declared order in which they will be turned off. Hosts within the same group will be turned off concurrently, while subsequent groups will only be shut down after a specified amount of time has elapsed after the previous group shutdown had started.
Architecture of the Shutdown Module
The Shutdown Manager module is organised on three levels: the top level is called Shutdown Definition and contains a definition of the actions to be taken; a Shutdown Group, which consists of a group of hosts that will be acted upon in the same time-span; and a Shutdown Host which consists of the single hosts on which the shutdown action will be carried out.
Each Shutdown Definition contains three main information: a name, a condition on either a host or a service, and a list of groups. It must then be deployed in Tornado, writing a rule that verifies the shutdown condition; afterwards, whenever the condition is met, a shutdown is scheduled on the groups. As an example, consider a host connected to a sensor which monitors the temperature in the server room. The condition can be a high temperature, and the groups to be shutdown contain the servers in the room, according to the order in which they must be turned off.
The Shoutdown Group contains the list of hosts that will be processed in parallel and a few information about them, and the timeout; i.e., the amount of time after which the next group will be processed.
The Shoutdown Host consists of an host and of the commands that will be executed on it during when a shutdown is invoked. The command definition might include variables, i.e., placeholders that will be replaced with suitable values when they are executed on each host.
The following sections describe the components comprising the Shutdown Manager and how to use the CLI to configure automatic shutdown scenarios and manually shut down groups and individual hosts.

