Monitoring Status
Permissions
The monitoring module provides an additional set of restrictions and permissions that can be used for access control. The following sections will list those restrictions and permissions in detail:
The monitoring module allows to send commands to an Icinga 2 instance. A user needs specific permissions to be able to send those commands when using the monitoring module.
Name |
Permits |
|---|---|
monitoring/command/* |
Allow all commands. |
monitoring/command/schedule-check |
Allow scheduling host and service checks. |
monitoring/command/schedule-check /active-only |
Allow scheduling host and service checks. (Only on objects with active checks enabled) |
monitoring/command/acknowledge-pr oblem |
Allow acknowledging host and service problems. |
monitoring/command/remove-acknowl edgement |
Allow removing problem acknowledgements. |
monitoring/command/comment/* |
Allow adding and deleting host and service comments. |
monitoring/command/comment/add |
Allow commenting on hosts and services. |
monitoring/command/comment/delete |
Allow deleting host and service comments. |
monitoring/command/downtime/* |
Allow scheduling and deleting host and service downtimes. |
monitoring/command/downtime/sched ule |
Allow scheduling host and service downtimes. |
monitoring/command/downtime/delet e |
Allow deleting host and service downtimes. |
monitoring/command/process-check- result |
Allow processing host and service check results. |
monitoring/command/feature/instan ce |
Allow processing commands for toggling features on an instance-wide basis. |
monitoring/command/feature/object /* |
Allow processing commands for toggling features on host and service objects. |
monitoring/command/feature/object /active-checks |
Allow processing commands for toggling active checks on host and service objects. |
monitoring/command/feature/object /passive-checks |
Allow processing commands for toggling passive checks on host and service objects. |
monitoring/command/feature/object /notifications |
Allow processing commands for toggling notifications on host and service objects. |
monitoring/command/feature/object /event-handler |
Allow processing commands for toggling event handlers on host and service objects. |
monitoring/command/feature/object /flap-detection |
Allow processing commands for toggling flap detection on host and service objects. |
monitoring/command/send-custom-no tification |
Allow sending custom notifications for hosts and services. |
Restrictions
The monitoring module allows filtering objects:
Keys |
Restricts |
|---|---|
monitoring/filter/objects |
Applies a filter to all hosts and services. |
This filter will affect all hosts and services. Furthermore, it will also affect all related objects, like notifications, downtimes and events. If a service is hidden, all notifications, downtimes on that service will be hidden too.
Filter Column Names
The following filter column names are available in filter expressions:
Column |
Description |
|---|---|
instance_name |
Filter on an Icinga 2 instance. |
host_name |
Filter on host object names. |
hostgroup_name |
Filter on hostgroup object names. |
service_description |
Filter on service object names. |
servicegroup_name |
Filter on servicegroup object names. |
all custom variables prefixed with
|
Filter on specified custom variables. |
Restrict Access to Custom Variables
Restriction name: monitoring/blacklist/properties
Restriction value: Comma separated list of GLOB like filters
Imagine the following host custom variable structure:
host.vars.
|-- cmdb_name
|-- cmdb_id
|-- cmdb_location
|-- wiki_id
|-- passwords.
|   |-- mysql_password
|   |-- ldap_password
|   `-- mongodb_password
|-- legacy.
|   |-- cmdb_name
|   |-- mysql_password
|   `-- wiki_id
`-- backup.
    `-- passwords.
        |-- mysql_password
        `-- ldap_password
host.vars.cmdb_name
Blacklists cmdb_name in the first level of the custom variable
structure only. host.vars.legacy.cmdb_name is not blacklisted.
host.vars.cmdb_*
All custom variables in the first level of the structure which begin
with cmdb_ become blacklisted. Deeper custom variables are ignored.
host.vars.legacy.cmdb_name is not blacklisted.
host.vars.*id
All custom variables in the first level of the structure which end with
id become blacklisted. Deeper custom variables are ignored.
host.vars.legacy.wiki_id is not blacklisted.
host.vars.*.mysql_password
Matches all custom variables on the second level which are equal to
mysql_password.
host.vars.*.*password
Matches all custom variables on the second level which end with
password.
host.vars.*.mysql_password,host.vars.*.ldap_password
Matches all custorm variables on the second level which equal
mysql_password or ldap_password.
host.vars.**.*password
Matches all custom variables on all levels which end with password.
Please note the two asterisks, **, here for crossing level
boundaries. This syntax is used for matching the complete custom
variable structure.
If you want to restrict all custom variables that end with password for both hosts and services, you have to define the following restriction.
host.vars.**.*password,service.vars.**.*password
Escape Meta Characters
Use backslash to escape the meta characters
*
,
host.vars.\*fall
Matches all custom variables in the first level which equal *fall.
Add Columns to List Views
The monitoring module provides list views for hosts and services. These lists only provide the most common columns to reduce the backend query load.
If you want to add more columns to the list view e.g. in order to use
the URL in your dashboards or as external iframe integration, you need
the addColumns URL parameter.
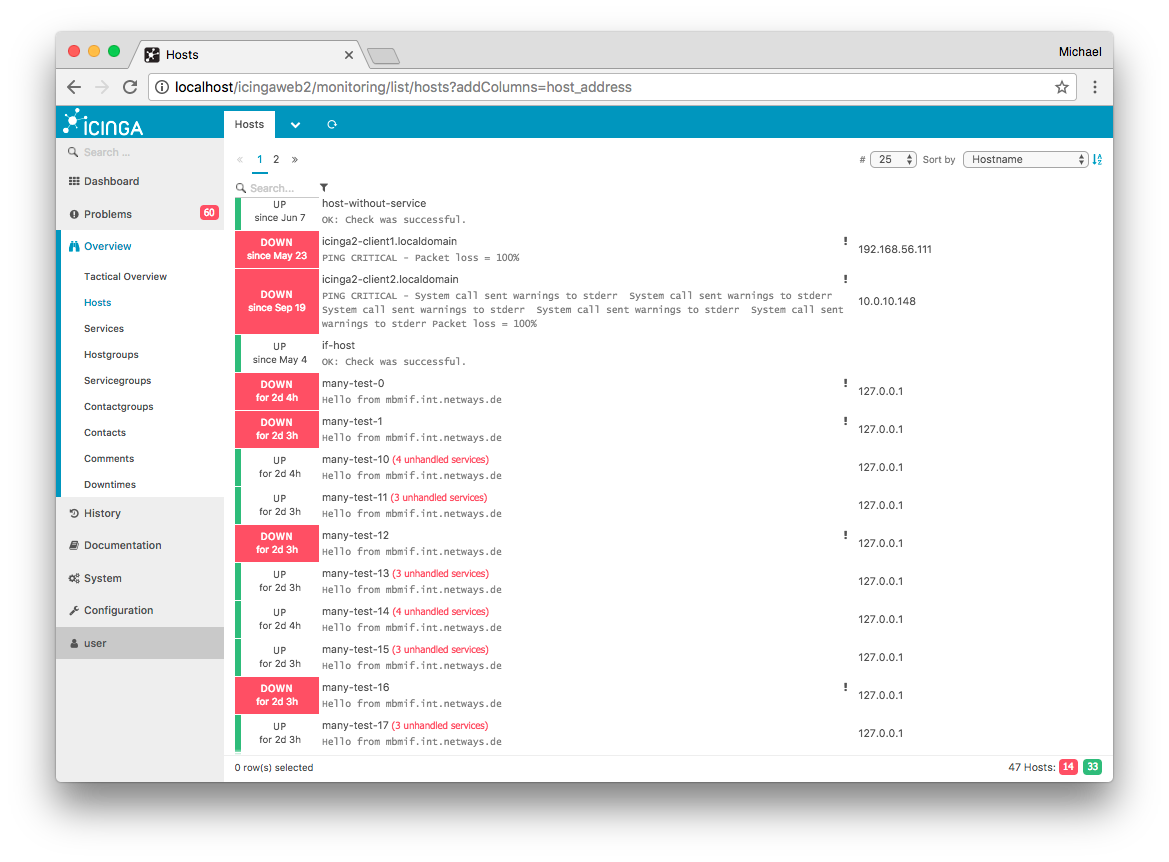
Example for adding the host address attribute in a host list::
http://localhost/icingaweb2/monitoring/list/hosts?addColumns=host_address

Fig. 124 Screenshot
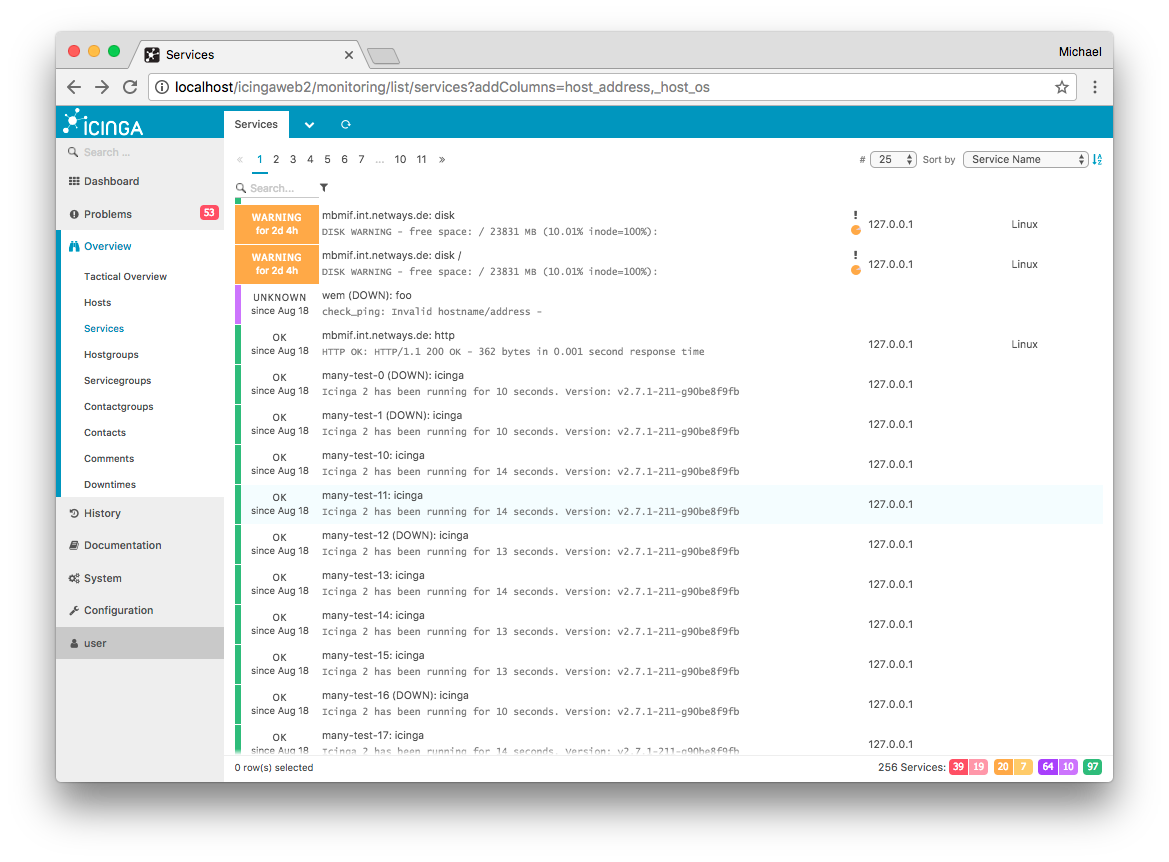
Example for multiple columns as comma separated parameter string. This
includes a reference to the Icinga 2 host object custom attribute os
using _host_ as custom variable identifier:
http://localhost/icingaweb2/monitoring/list/services?addColumns=host_address,_host_os

Fig. 125 Screenshot
Monitoring view
The Monitoring panels in NetEye are divided into several sections, each carrying different information. Access to the Monitoring View requires the user to have a role with appropriate permissions in the Monitoring module; a Role with General Access Module usually suffices for this purpose.
Starting from Release 4.14, the new monitoringview module introduces a new functionality to selectively hide or show each section of the monitoring panels to a role - and therefore to a user. You can grant these permissions in Configuration > Authentication > Roles under the monitoringview module; each section as an associated permission with the same name:
Plugin Output:
monitoringview/plugin-outputProblem handling:
monitoringview/problem-handlingPerformance Data:
monitoringview/performance-dataNotifications:
monitoringview/notificationsCheck execution:
monitoringview/check-executionFeature Commands:
monitoringview/feature-commandCustom variables:
monitoringview/custom-variables
Note
Monitoring Panels have two additional sections,
Performance Graph and Quick Actions, which are not managed
within this module. You can hide or show these sections by modifying
the corresponding permission in their modules:
Performance Graph: Already present in ITOA module, this section can be hidden or shown by acting on
general module accessandanalytics/view-performance-graphpermission from analytic module.Quick Actions: It is a monitoring module permission that can be used to hide complete or specific command with the
monitoring/command/*permission. This Quick Actions section has commands likecheck now,Comment,Notification,Downtime.
Using the Custom Problem View
Access to the Problem View requires the user to have a role with appropriate permissions in the Monitoring module; a Role with General Access Module suffices for the purpose.
Starting from Release 4.13, a new functionality has been added to
the Problems View. The new module customproblemview indeed, defines a
new permission in the form of a filter called
customproblemview/excludefilter/objects, which allows to define a
suitable filter to show only a subset of host problems, service
problems, or both.
In Configuration > Authentication > Roles, you can define the
customproblemview/excludefilter/objects, that represents the
monitoring filter, selecting the monitoring objects you want to filter
out from the Problem View.
For example, let’s suppose that your monitoring system is monitoring
both production and test environments. All hosts belonging to test
environment belong to a “test-system” hostgroup. If you wan to see only
the production hosts in the Problem View, you just need to create a role
with the proper filter in customproblemview/excludefilter/objects
(e.g. hostgroup=test-system).
Note that if a user belongs to more than one role with a specified
customproblemview/excludefilter/objects, the filter will become more
and more selective, showing only objects that belong to all the filters.
Protecting Credentials in the Monitoring Views
The monitoring views display the values for all fields configured for a host or service. These views will also display any custom variables you define as fields in the view. If one or more fields contain sensitive information such as MySQL accounts, passwords, or SNMP Community Strings, best practice is to hide the values of those fields in the monitoring views (they will remain visible in Director’s configuration panels).

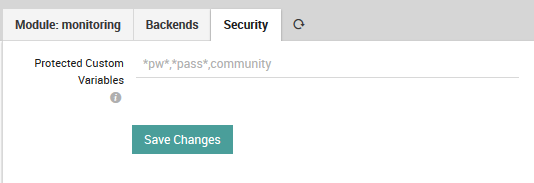
Fig. 126 Specifying fields containing credentials.
You can do this by going to Configuration > Modules > monitoring > Security (Fig. 126) and setting a pattern that will hide the values for all fields derived from custom variables where those fields’ names match the pattern. This pattern goes in the field “Protected Custom Variables”, where the syntax is defined by Icinga.
To summarize, this field should contain a comma separated list of case insensitive pattern strings, where * is the only allowed matching operator. Note that any spaces you include will count as part of the pattern between commas. The field is initially empty, with the suggested example *pw*,*pass*,community*, which would match the strings “pw”, “password”, and “Community”, among others.
If a field name matches the pattern, then that field’s value will be replaced with asterisks as shown in Fig. 127, hiding the real contents from view.

Fig. 127 Protected password in the host monitoring view.

