Concepts
Overview of ntopng and NetEye Integration
NetEye includes the ntopng software to allow for inspection of networks flows. The module can be accessed using Single Sign On.
The ntopng UI can be reached by clicking the menu item on the left-hand side. Depending on the roles of the users accessing the module, available options and features may vary. Please check ntop configuration section for more details about the permissions.
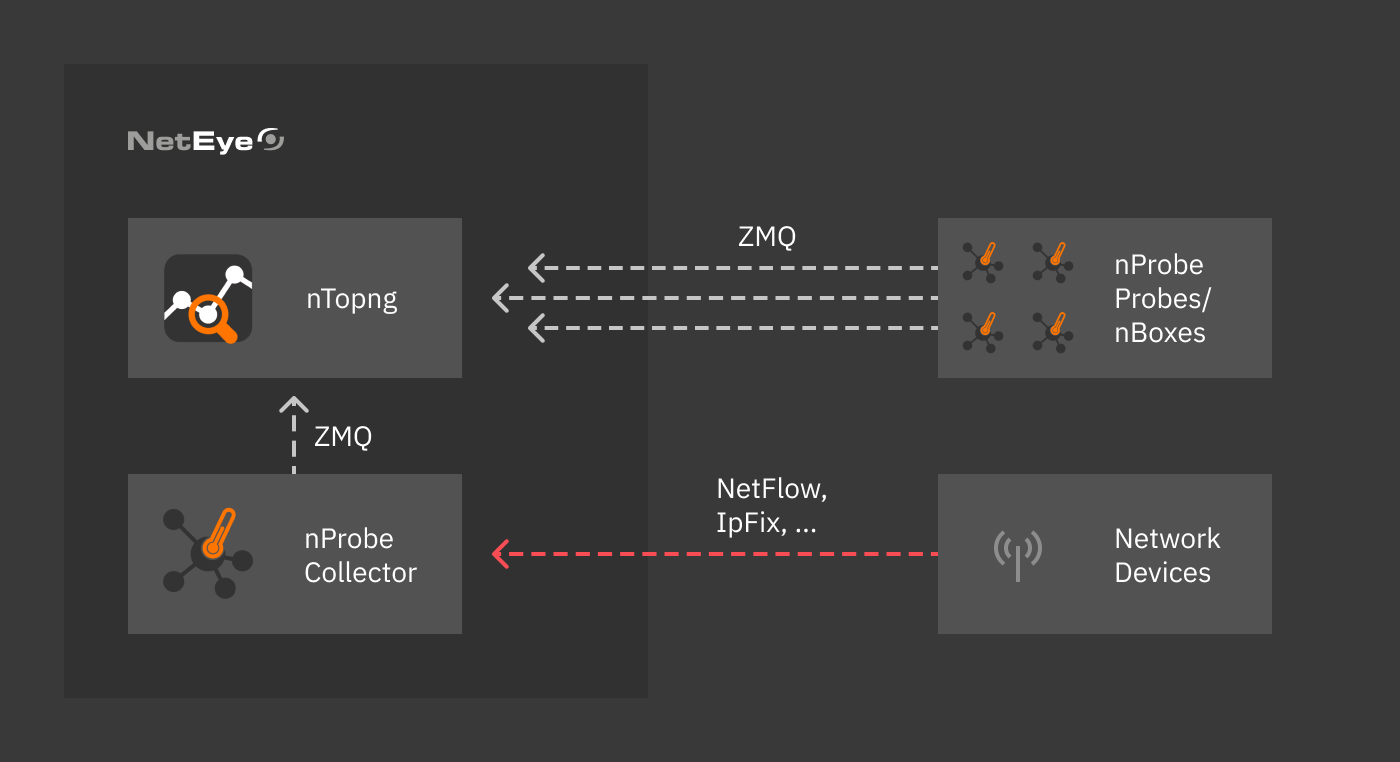
On NetEye, both ntopng and nProbe are running, with the latter being in Collector Mode, i.e. it only collects flows sent to the 6363 port and sends them to ntopng. Flows are collected by nProbe from any capable network device (including, but not limited to, switches, servers, printers, workstations) that can be reached within the local networks accessible by NetEye.
Collected flows are sent to ntopng as ZMQ streams and processed; if additional nProbes are installed on the local network, they can as well be configured to send their flows to ntopng.
The realtime traffic information on the currently active flows can be visualized by clicking on the entry in the sidebar. The flows recorded in the past can be accessed from the menu entry. ntopng stores historical flows and alerts thanks to an integration with ClickHouse (an high-performance SQL database).
See also
The official documentation of ntopng, nProbe, ClickHouse contains more information about their architecture.

Fig. 137 NetEye - ntopng architecture

