User Guide Functional Overview Requirements Architecture System Installation NetEye Additional Components Installation Setup The neteye Command Director NetEye Self Monitoring Tornado Business Service Monitoring IT Operation Analytics - Telemetry Geo Maps NagVis Audit Log Shutdown Manager Reporting ntopng Visual Monitoring with Alyvix Elastic Stack IT Operations (Command Orchestrator) Asset Management Service Level Management Cyber Threat Intelligence - SATAYO NetEye Update & Upgrade How To NetEye Extension Packs Troubleshooting Security Policy Glossary
module icon Architecture
Introduction Single Node Cluster NetEye Master Master-Satellite Architecture Underlying Operating System
Functional Overview Requirements Architecture System Installation NetEye Additional Components Installation Setup The neteye Command Introduction to NetEye Monitoring Business Service Monitoring IT Operation Analytics Visualization Network Visibility Log Management & Security Orchestrated Datacenter Shutdown Application Performance Monitoring User Experience Service Management Service Level Management & Reporting Requirements for a Node Cluster Requirements and Best Practices NetEye Satellite Requirements TCP and UDP Ports Requirements Additional Software Installation Introduction Single Node Cluster NetEye Master Master-Satellite Architecture Underlying Operating System Acquiring NetEye ISO Image Installing ISO Image Single Nodes and Satellites Cluster Nodes Configuration of Tenants Satellite Nodes Only Nodes behind a Proxy Additional NetEye Components Single Node Cluster Node Satellites Nodes only Verify if a module is running correctly Accessing the New Module Cluster Satellite Security Identity and Access Management External Identity Providers Configure federated LDAP/AD Emergency Reset of Keycloak Configuration Advanced Configuration Authorization Resources Tuning Advanced Topics Basic Concepts & Usage Advanced Topics Monitoring Environment Templates Monitored Objects Import Monitored Objects Data Fields Deployment Icinga 2 Agents Configuration Baskets Dashboard Monitoring Status VMD Permissions Notifications Jobs API Configuring Icinga Monitoring Retention Policy NetEye Self Monitoring 3b Concepts Collecting Events Add a Filter Node WHERE Conditions Iterating over Event fields Retrieving Payload of an Event Extract Variables Create a Rule Tornado Actions Test your Configuration Export and Import Configuration Example Under the hood Development Retry Strategy Configuration Thread Pool Configuration API Reference Configure a new Business Process Create your first Business Process Node Importing Processes Operators The ITOA Module Configuring User Permissions Telegraf Metrics in NetEye Telegraf Configuration Telegraf on Monitored Hosts Visualizing Dashboards Customizing Performance Graph The NetEye Geo Map Visualizer Map Viewer Configuring Geo Maps NagVis 3b Audit Log 3b Overview Shutdown Manager user Shutdown Manager GUI Shutdown Commands Advanced Topics Overview User Role Management Cube Use Cases ntopng and NetEye Integration Permissions Retention Advanced Topics Overview User Roles Nodes Test Cases Dashboard Use Cases Overview Architecture Authorization Elasticsearch Overview Enabling El Proxy Sending custom logs to El Proxy Configuration files Commands Elasticsearch Templates and Retentions El Proxy DLQ Blockchain Verification Handling Blockchain Corruptions El Proxy Metrics El Proxy Security El Proxy REST Endpoints Agents Logstash Elastic APM Elastic RUM Log Manager - Deprecated Overview Authorization in the Command Orchestrator Module Configuring CLI Commands Executing Commands Overview Permissions Installation Single Tenancy Multitenancy Communication through a Satellite Asset collection methods Display asset information in monitoring host page Overview Customers Availability Event Adjustment Outages Resource Advanced Topics Introduction Getting Started SATAYO Items Settings Managed Service Mitre Attack Coverage Changelog Before you start Update Procedure Single Node Upgrade from 4.41 to 4.42 Cluster Upgrade from 4.41 to 4.42 Satellite Upgrade from 4.41 to 4.42 DPO machine Upgrade from 4.41 to 4.42 Create a mirror of the RPM repository Sprint Releases Feature Troubleshooting Tornado Networking Service Management - Incident Response IT Operation Analytics - Telemetry Identity Provider (IdP) Configuration Introduction to NEP Getting Started with NEPs Online Resources Obtaining NEP Insights Available Packages Advanced Topics Upgrade to NetEye 4.31 Setup Configure swappiness Restarting Stopped Services Enable stack traces in web UI How to access standard logs Director does not deploy when services assigned to a host have the same name How to enable/disable debug logging Activate Debug Logging for Tornado Modules/Services do not start Sync Rule fails when trying to recreate Icinga object How to disable InfluxDB query logging Managing an Elasticsearch Cluster with a Full Disk Some logs are not indexed in Elasticsearch Elasticsearch is not functioning properly Reporting: Error when opening a report Debugging Logstash file input filter Bugfix Policy Reporting Vulnerabilities Glossary 3b

NetEye Master

Active or passive monitoring processes are concentrated within the main NetEye instance - the NetEye Master. Based on the role distribution within the environment, the Master instance is responsible for:

  • holding configuration files

  • sending monitoring configurations to monitored objects previously created in the Director

  • receiving reports of events from various data sources, and matching those events with the predefined rules

  • executing actions based on the outcome of the performed analysis

  • configuring and initiating availability checks on a monitored infrastructure

The NetEye Master functionality for processing received data is granted by Icinga 2 monitoring server, Tornado Engine and Telegraf Consumers. The process of configuring monitoring tasks is controlled via the Director module.

Agents and Data Collecting

Retrieving data from the data sources is done by the local agents.

Collecting data for monitoring purposes is performed by means of Agents. Agent is a software that is to be installed on a node to monitor hosts and services. Apart from collecting data, agents are set to perform different tasks, e.g. process data or pass it to the Master, perform health ckecks.

In NetEye hierarchy agents can only have a parent node, i.e. either Master or Satellite. In case Satellites are not involved in the process of data communication, an Agent communicates directly with the Master instance.

While a Satellite can handle a set of hosts, different Agents can be installed on them. In their turn, Agents, can be grouped into tenants.

In order for an agent to operate successfully, make sure that versions of all involved instances are compatible. Namely, agent version should be the same as the version of a Satellite or Master it’s connected to.

Depending on the type of monitoring you would like to perform, i.e. NetEye module you would like to utilize, different agents can be installed on hosts: Icinga agent for Active monitoring purposes, Beats agent (Elastic Stack), Telegraf agent, APM agent, AX Monitor agent, etc.

Icinga Agents

Icinga Agents communicate with the Master within their own Icinga infrastructure. Agents recieve configuration from the Master or a Satellite, and send collected data back to the Icinga instance on the Master. Configurations are generated and distributed to Icinga agents based on the zones.

Telegraf Agents

Local Telegraf Agents are to be configured manually as per which metrics are to be collected. Collected data is then passed to a Telegraf consumer on the Master for further processing. You can learn more on the Telegraf configuration at this page.

Elastic Agents

Elastic Agent is designed to collect and ship data from various sources to Elasticsearch. It is used to replace and consolidate multiple Beats and other agents previously used for data collection. Elastic Agents are pre-configured in the NetEye Master to serve as Fleet Servers: this allows you to easily install and manage Elastic Agents on you monitored hosts via the Fleet UI in Kibana.

GLPI Agents

GLPI Agents are to be installed and configured manually to collect assets and send them to the GLPI Server on the Master. They can be installed on any Windows/Linux machine and configured to send data directly to the Master or trough a NetEye Satellite as a Proxy.

To learn more about how to configure GLPI for Single- or Multitenant environments, please consult GLPI Single Tenancy.

Alyvix Nodes

The Alyvix Node is to be installed and configured manually. NetEye communicates with the Alyvix Service via API calls through the HTTPS communication channels, while NATS serves as a communication channel to send the performance metrics from the Alyvix Nodes to the NetEye Master for service monitoring purposes. Alyvix Test Case execution reports are stored instead on the Alyvix Node.

../../_images/multitenancy-neteye-agents.jpg

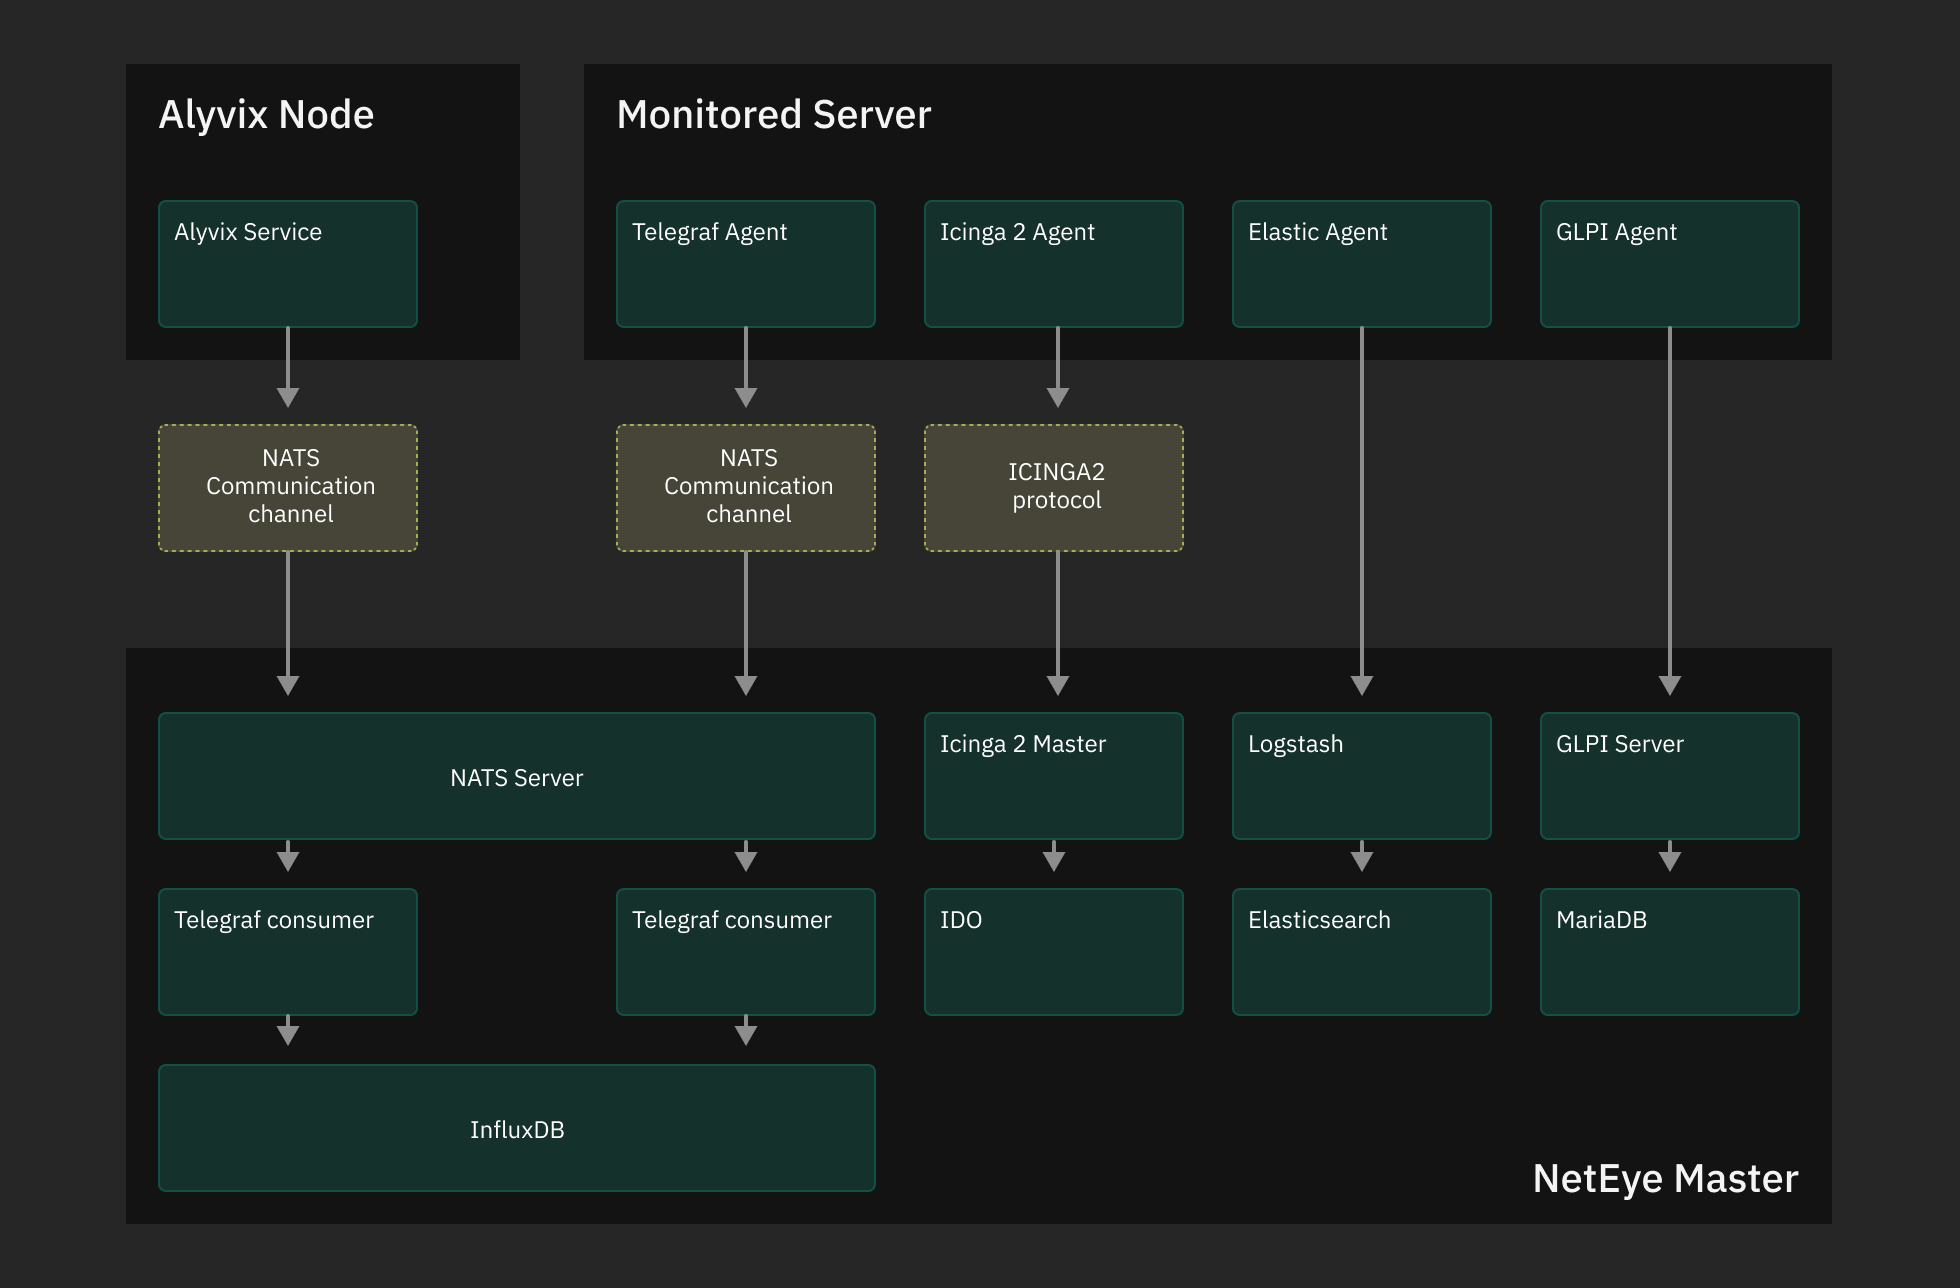
Fig. 3 Data communication from Agents to the Master.

Tornado Collectors

Data gathering for passive monitoring is performed by Tornado Collectors. Collected data flows down the Tornado pipeline, which, apart from the Collectors, contains Tornado Engine and Tornado Executors. The Engine and the Executors are deployed within the Master instance.

A Collector receives information from one or more unstructured sources (e.g. emails or log files), treated as External Events. Based on this a Collector converts External Events into structured Tornado-specific Events, and sends them to the Tornado Engine for further processing. Its main function is to match received events against preconfigured rules, and execute actions in case of a match.

../../_images/architecture_tornado_pipeline.svg

Fig. 4 Outline of the Tornado Pipeline

See Passive Monitoring for more information on Tornado.