


 Monitoring
Problems View
The Problems view helps you focus on the parts of your monitored environment that currently require attention. Use this view when you want to move from a general overview to a more detailed investigation of active problems affecting hosts, services, or planned maintenance periods.
In the Problems view, you can work with several sections: Host problems, Service problems, Service grid, and information about current downtimes. Depending on the section you open, you can see the hosts and services that are not in a healthy state, check which issues are already known or planned, and decide what needs immediate action.
The host and service problem lists give you a focused view of affected objects. You can filter these lists by details such as name, severity, current state, and the last change of state. These filters help you narrow down the information and build a clearer picture of what is happening in your environment, for example by showing only critical issues, recently changed states, or a specific host or service name.
The Service grid gives you a matrix-style overview of service health across affected hosts. It includes all hosts with at least one service that’s not working and all services that run on a host with at least one service that’s not working. The result is a color-coded table that lets you quickly compare the status of hosts and services and identify where problems are concentrated.
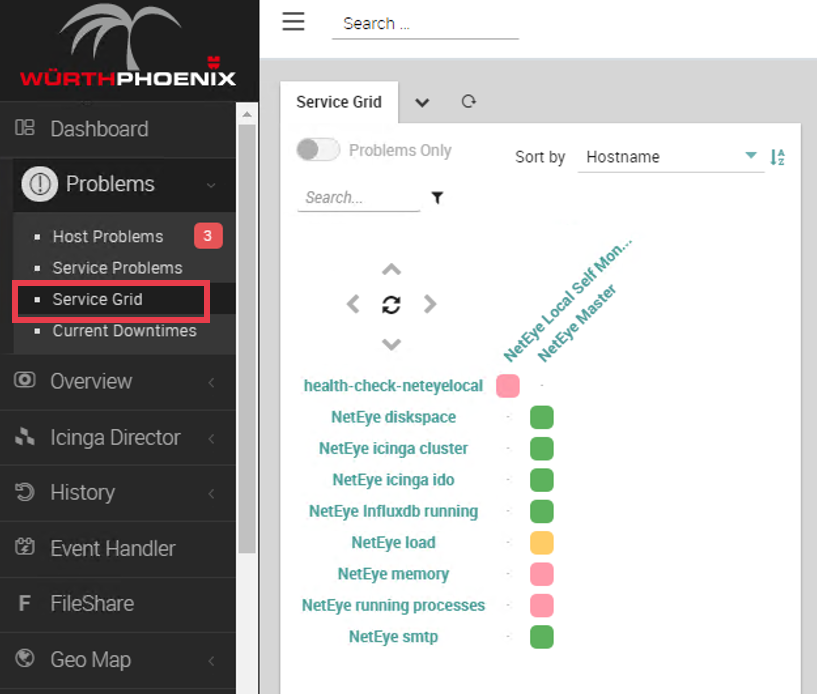
Fig. 200 Problems View - Service Grid
The downtime information helps you distinguish between unexpected problems and objects that are currently in a planned maintenance window. This is useful when you assess whether an alert requires immediate action or is already covered by scheduled work.

