


 Monitoring
Dashboard
The Dashboard area gives you a flexible workspace where you can organize the monitoring information that is most relevant to your daily work. It is designed for ease and efficiency: instead of opening several monitoring views one by one, you can collect the views, summaries and widgets most important to you in one place and arrange them according to your preferred workflow.
For NetEye.Cloud users the Dashboard is typically pre-configured, so you can immediately start from a standard set of dashlets that provide commonly used monitoring information.
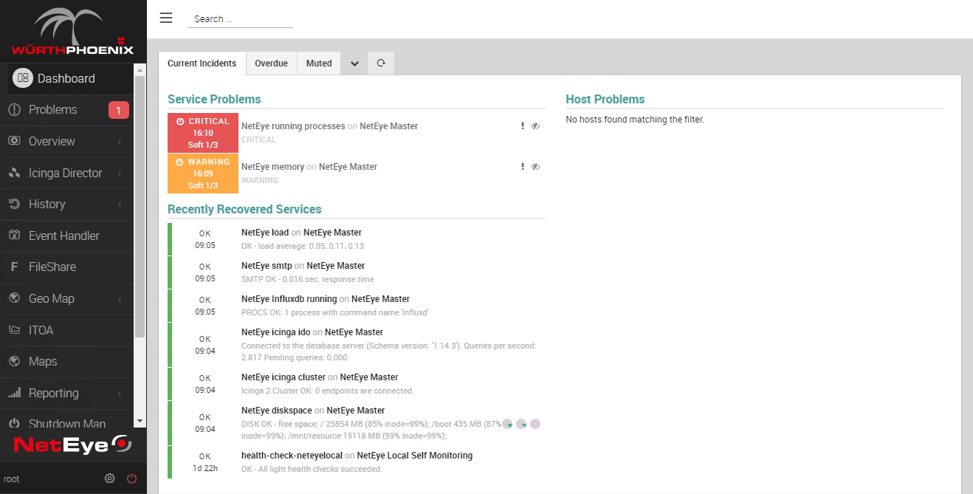
Fig. 201 The Dashboard for current incidents
Even in this case you can adapt the Dashboard to your own needs.
Choose the monitoring views you use most often and add them either as a dedicated dashboard or as a dashlet inside one of your existing dashboards. This helps you create different workspaces for different purposes, such as a general operational overview, focused host or service monitoring, troubleshooting, or team-specific monitoring responsibilities.
In practice, the dashboard helps you personalize how you consume monitoring data. Standard dashlets provide a ready-to-use starting point, while configurable views and additional dashlets let you keep the most relevant information visible and reduce the time you need to navigate between monitoring pages.
For explicit information on how to tune your dashboards and dashlets please see the the Dashboard documentation.

