User Guide Functional Overview Requirements Architecture System Installation NetEye Additional Components Installation Setup The neteye Command Director NetEye Self Monitoring Tornado Business Service Monitoring IT Operation Analytics - Telemetry Geo Maps NagVis Audit Log Shutdown Manager Reporting ntopng Visual Monitoring with Alyvix Elastic Stack IT Operations (Command Orchestrator) Asset Management Service Level Management Cyber Threat Intelligence - SATAYO NetEye Update & Upgrade How To NetEye Extension Packs Troubleshooting Security Policy Glossary
module icon Visual Monitoring with Alyvix
Overview User Roles Nodes RDP Client Building Tools Editor: Interface Overview Editor: Script Building Editor: Managing Scripts Designer: Interface Overview Designer: Interface Options Designer: Component Tree Selector: Interface Overview Test Case Management Dashboard Use Cases
ntopng Visual Monitoring with Alyvix Elastic Stack IT Operations (Command Orchestrator) Asset Management Service Level Management Cyber Threat Intelligence - SATAYO Introduction to NetEye Monitoring Business Service Monitoring IT Operation Analytics Visualization Network Visibility Log Management & Security Orchestrated Datacenter Shutdown Application Performance Monitoring User Experience Service Management Service Level Management & Reporting Requirements for a Node Cluster Requirements and Best Practices NetEye Satellite Requirements TCP and UDP Ports Requirements Additional Software Installation Introduction Single Node Cluster NetEye Master Master-Satellite Architecture Underlying Operating System Acquiring NetEye ISO Image Installing ISO Image Single Nodes and Satellites Cluster Nodes Configuration of Tenants Satellite Nodes Only Nodes behind a Proxy Additional NetEye Components Single Node Cluster Node Satellites Nodes only Verify if a module is running correctly Accessing the New Module Cluster Satellite Security Identity and Access Management External Identity Providers Configure federated LDAP/AD Emergency Reset of Keycloak Configuration Advanced Configuration Roles Single Page Application in NetEye Module Permissions and Single Sign On Within NetEye Importing User Federation Groups inside another Group Importing OIDC IdP Groups inside another Group Resources Tuning Advanced Topics Basic Concepts & Usage Advanced Topics Monitoring Environment Templates Monitored Objects Import Monitored Objects Data Fields Deployment Icinga 2 Agents Configuration Baskets Dashboard Monitoring Status Icinga2 Features VMD Permissions Notifications Jobs API Configuring Icinga Monitoring Retention Policy NetEye Self Monitoring Concepts Collecting Events Add a Filter Node WHERE Conditions Iterating over Event fields Retrieving Payload of an Event Extract Variables Create a Rule Tornado Actions Test your Configuration Export and Import Configuration Example Under the hood Development Retry Strategy Configuration Thread Pool Configuration API Reference Configure a new Business Process Create your first Business Process Node Importing Processes Operators The ITOA Module Configuring User Permissions Telegraf Metrics in NetEye Telegraf Configuration Telegraf on Monitored Hosts Visualizing Dashboards Customizing Performance Graph The NetEye Geo Map Visualizer Map Viewer Configuring Geo Maps NagVis Audit Log Overview Shutdown Manager user Shutdown Manager GUI Shutdown Commands Advanced Topics Overview User Role Management Cube Use Cases ntopng and NetEye Integration Permissions Retention Advanced Topics Overview User Roles Nodes RDP Client Building Tools Editor: Interface Overview Editor: Script Building Editor: Managing Scripts Designer: Interface Overview Designer: Interface Options Designer: Component Tree Selector: Interface Overview Test Case Management Dashboard Use Cases Overview Architecture Authorization Kibana Elasticsearch Cluster Elasticsearch Configuration Replicas on a Single Node Elasticsearch Performance tuning Overview Enabling El Proxy Sending custom logs to El Proxy Configuration files Commands Elasticsearch Templates and Retentions El Proxy DLQ Blockchain Verification Handling Blockchain Corruptions El Proxy Metrics El Proxy Security El Proxy REST Endpoints Agents Logstash Elastic APM Elastic RUM Elastic XDR Log Manager - Deprecated Overview Authorization in the Command Orchestrator Module Configuring CLI Commands Executing Commands Overview Permissions Installation Single Tenancy Multitenancy Communication through a Satellite Asset collection methods Display asset information in monitoring host page Overview Customers Availability Event Adjustment Outages Resource Advanced Topics Introduction Getting Started SATAYO Items Settings Managed Service Mitre Attack Coverage Changelog Before you start Update Procedure Single Node Upgrade from 4.45 to 4.46 Cluster Upgrade from 4.45 to 4.46 Satellite Upgrade from 4.45 to 4.46 DPO machine Upgrade from 4.45 to 4.46 Create a mirror of the RPM repository Sprint Releases Feature Troubleshooting Tornado Networking Service Management - Incident Response IT Operation Analytics - Telemetry Identity Provider (IdP) Configuration NetEye Cluster on Microsoft Azure Introduction to NEP Getting Started with NEPs Online Resources Obtaining NEP Insights Available Packages Advanced Topics Upgrade to NetEye 4.31 Setup Configure swappiness Restarting Stopped Services Enable stack traces in web UI How to access standard logs Director does not deploy when services assigned to a host have the same name How to enable/disable debug logging Activate Debug Logging for Tornado Modules/Services do not start Sync Rule fails when trying to recreate Icinga object How to disable InfluxDB query logging Managing an Elasticsearch Cluster with a Full Disk Some logs are not indexed in Elasticsearch Elasticsearch is not functioning properly Reporting: Error when opening a report Debugging Logstash file input filter Bugfix Policy Reporting Vulnerabilities Glossary

Editor: Interface Overview

Alyvix Editor lets you visually create, edit and run complex scripts allowing Alyvix to interact with your applications just like a human user would. Each script consists of multiple test case objects, organized as sequential, conditional and loop commands, along with Sections and Maps.

The Editor interface includes the Alyvix Selector and Designer modules as collapsible panels, which lets you easily inspect and choose test case objects to include when building your scripts.

To run Alyvix Editor from the command prompt, use the following command:

C:\Alyvix\testcases> alyvix_editor -f <alyvix-file-name>

This loads the Editor interface, whose layout has the following elements:

Alyvix Editor with Designer and Selector.
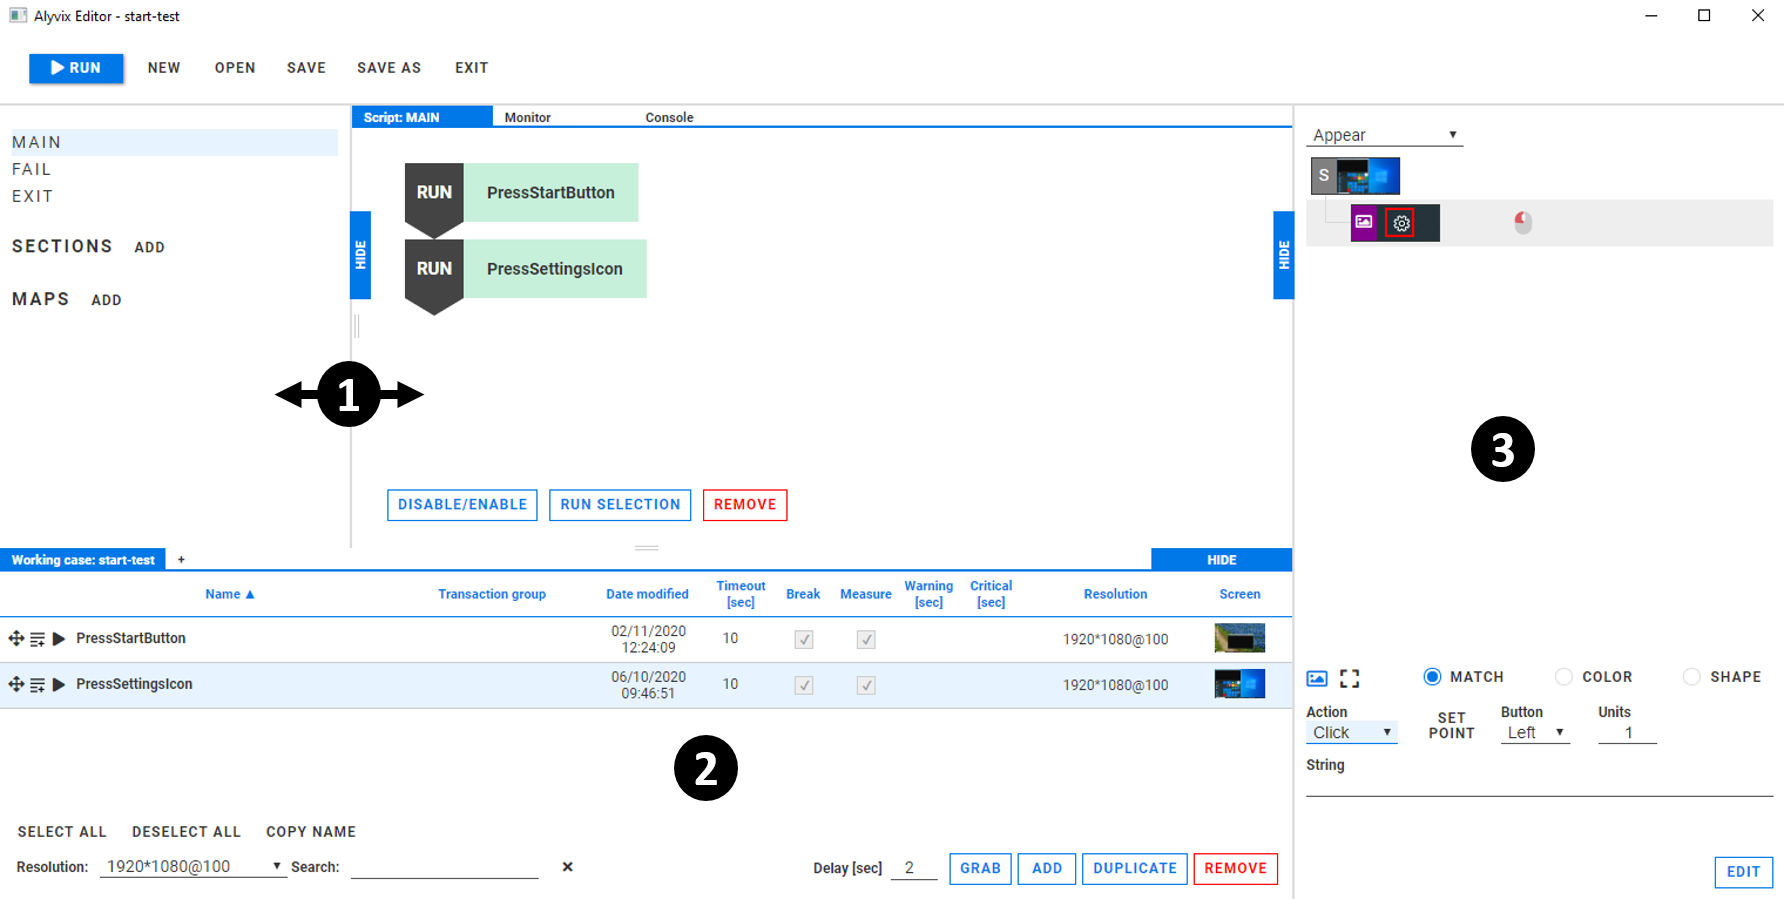
  1. The Editor panel, consisting of the Script Management panel (left) and the Scripting panel (right)

  2. The Selector panel, containing test case objects that can be added to the Scripting panel

  3. The Designer panel, which shows the details of the currently selected test case object

Editor-Specific Features

The principle interface elements specific to Alyvix Editor are:

The Alyvix Editor interface.
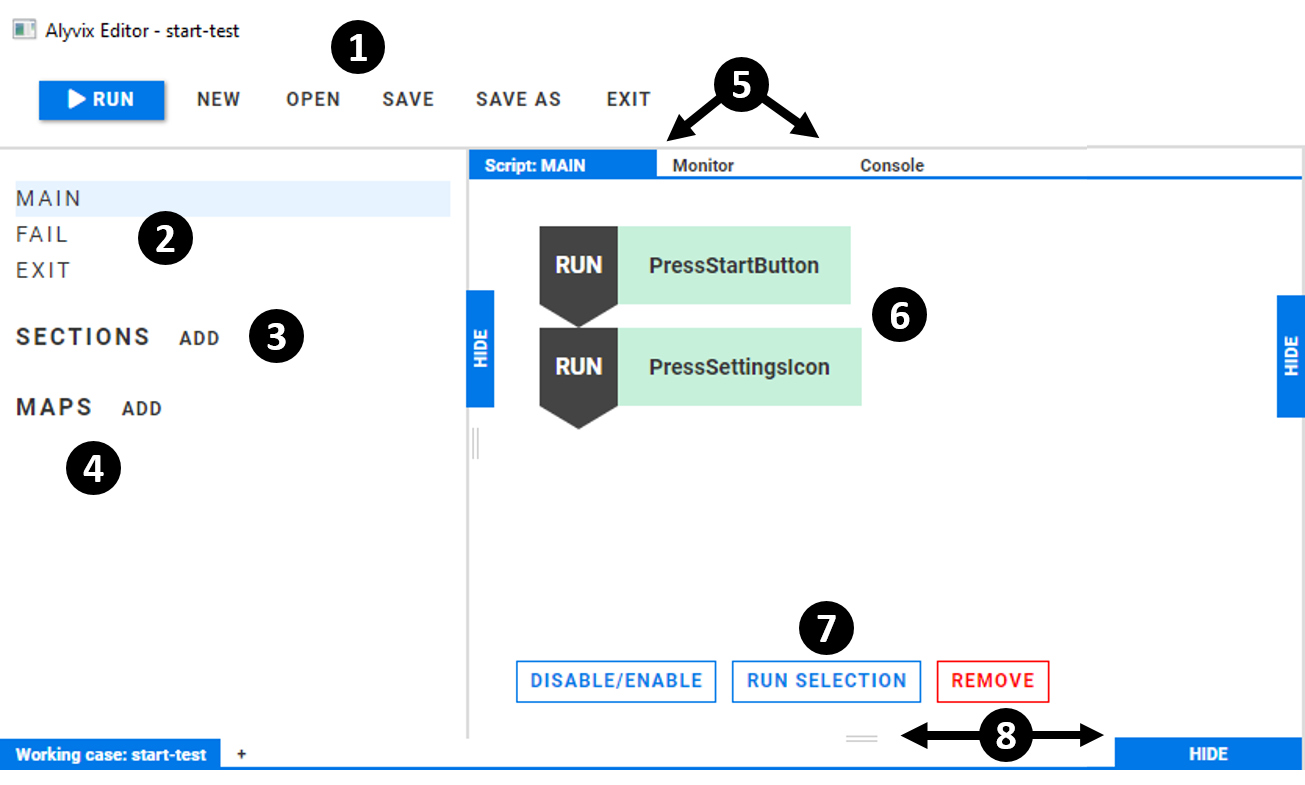
  1. The test case menu (described below), containing actions for Alyvix Editor and the current test case (named at the top left)

  2. The main Script Management panel, used to select the principal scripts to be edited

  3. The Sections list, containing user-defined sections (subscripts) that can be used as subroutines within any of the principal scripts

  4. The Maps list, containing user-defined maps (consisting of keys and one or more values for each key) that can be used either by a script via looping, or to insert values in a String field.

  5. The scripting mode selector, containing the Script tab to display the currently selected script or map, the Monitor tab to show the screen capture of Selector’s current test case object, and the Console tab to show the output along with any potential failure causes after running the test case script from within Alyvix Editor

  6. The scripting panel, containing individual scripting nodes for the active script/section/map in (2/3/4)

  7. The script properties and actions that work both for single nodes and subsets of nodes, where you can enable, disable, run, or remove the scripted elements that have been placed in the scripting panel

  8. Panel resizing controls, allowing you to resize, minimize, or restore the three peripheral panels

The Test Case Menu

The following actions are available from Editor’s menu:

  • RUN — Run the current script displayed in the scripting panel (see below)

  • NEW — Throw away the current test case, replacing it with an empty one

  • OPEN — Replace the current test case with a new one chosen from the file dialog

  • SAVE — Save the current test case with its existing filename, overwriting the previous version

  • SAVE AS — Create a copy of the current test case under a new file name

  • EXIT — Close Alyvix Editor

The Monitor Tab

When you just need to quickly look at the positions of components in a test case object without making any changes, the fastest way isn’t to return to editing the test case object via the Designer panel. Instead you can use the monitor tab to see the screen capture for the currently selected test case object.

An example Monitor tab screenshot

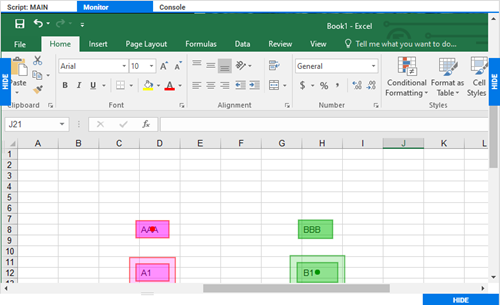
The monitor tab displays a read-only, full-size, instantly available copy of the screen grab for the test case object currently opened in the Designer panel.

Launching Alyvix Robot from Alyvix Editor

The script of the currently loaded test case can be run directly in Editor by pressing the RUN button at the top left. The default starting point is the MAIN script in the script management panel (you can use the debugging methods available in Alyvix Editor to change this starting point).

When run, Editor will be minimized until the scripted interaction has completed, after which the Editor window will return, and the output will appear in the Console tab at the top of the scripting panel:

The results of running the script in Alyvix Editor

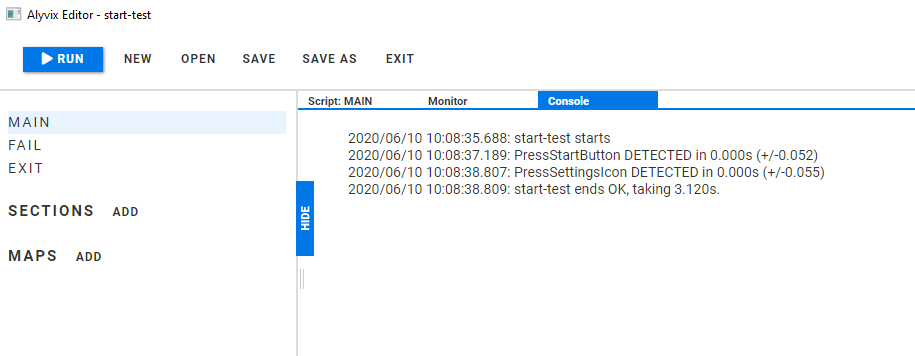
The structure of the output is the same regardless of whether the test case is started in Editor or run in the command prompt. The effect of the Break and Measure flags are described in detail in the Test Execution section of the official Alyvix Guide.

If a failure was caused by a simple sequential scripting node, then the annotated screenshot describing the failure will be displayed below the output in the Console tab:

A matching error displayed in the console tab

The annotation indicates the position, size and group of the first component that could not be matched during execution. In the PowerPoint example shown above, the Paste icon was marked as a subselection in the first group without an enlarged region of interest, so reducing the window horizontally means the Paste icon no longer fell within that region.

The exclamation mark inside the red square (the color of the first group) indicates where Alyvix expected to find the Paste icon.

Note

Note that currently arguments such as a private key and the verbosity level for Alyvix Robot cannot be set within Editor.