User Guide Functional Overview Requirements Architecture System Installation NetEye Additional Components Installation Setup The neteye Command Director NetEye Self Monitoring Tornado Business Service Monitoring IT Operation Analytics - Telemetry Geo Maps NagVis Audit Log Shutdown Manager Reporting ntopng Visual Monitoring with Alyvix Elastic Stack IT Operations (Command Orchestrator) Asset Management Service Level Management Cyber Threat Intelligence - SATAYO NetEye Update & Upgrade How To NetEye Extension Packs Troubleshooting Security Policy Glossary
module icon Visual Monitoring with Alyvix
Overview User Roles Nodes Test Cases Dashboard Use Cases
ntopng Visual Monitoring with Alyvix Elastic Stack IT Operations (Command Orchestrator) Asset Management Service Level Management Cyber Threat Intelligence - SATAYO Introduction to NetEye Monitoring Business Service Monitoring IT Operation Analytics Visualization Network Visibility Log Management & Security Orchestrated Datacenter Shutdown Application Performance Monitoring User Experience Service Management Service Level Management & Reporting Requirements for a Node Cluster Requirements and Best Practices NetEye Satellite Requirements TCP and UDP Ports Requirements Additional Software Installation Introduction Single Node Cluster NetEye Master Master-Satellite Architecture Underlying Operating System Acquiring NetEye ISO Image Installing ISO Image Single Nodes and Satellites Cluster Nodes Configuration of Tenants Satellite Nodes Only Nodes behind a Proxy Additional NetEye Components Single Node Cluster Node Satellites Nodes only Verify if a module is running correctly Accessing the New Module Cluster Satellite Security Identity and Access Management External Identity Providers Configure federated LDAP/AD Emergency Reset of Keycloak Configuration Advanced Configuration Authorization Resources Tuning Advanced Topics Basic Concepts & Usage Advanced Topics Monitoring Environment Templates Monitored Objects Import Monitored Objects Data Fields Deployment Icinga 2 Agents Configuration Baskets Dashboard Monitoring Status VMD Permissions Notifications Jobs API Configuring Icinga Monitoring Retention Policy NetEye Self Monitoring 3b Concepts Collecting Events Add a Filter Node WHERE Conditions Iterating over Event fields Retrieving Payload of an Event Extract Variables Create a Rule Tornado Actions Test your Configuration Export and Import Configuration Example Under the hood Development Retry Strategy Configuration Thread Pool Configuration API Reference Configure a new Business Process Create your first Business Process Node Importing Processes Operators The ITOA Module Configuring User Permissions Telegraf Metrics in NetEye Telegraf Configuration Telegraf on Monitored Hosts Visualizing Dashboards Customizing Performance Graph The NetEye Geo Map Visualizer Map Viewer Configuring Geo Maps NagVis 3b Audit Log 3b Overview Shutdown Manager user Shutdown Manager GUI Shutdown Commands Advanced Topics Overview User Role Management Cube Use Cases ntopng and NetEye Integration Permissions Retention Advanced Topics Overview User Roles Nodes Test Cases Dashboard Use Cases Overview Architecture Authorization Elasticsearch Overview Enabling El Proxy Sending custom logs to El Proxy Configuration files Commands Elasticsearch Templates and Retentions El Proxy DLQ Blockchain Verification Handling Blockchain Corruptions El Proxy Metrics El Proxy Security El Proxy REST Endpoints Agents Logstash Elastic APM Elastic RUM Log Manager - Deprecated Overview Authorization in the Command Orchestrator Module Configuring CLI Commands Executing Commands Overview Permissions Installation Single Tenancy Multitenancy Communication through a Satellite Asset collection methods Display asset information in monitoring host page Overview Customers Availability Event Adjustment Outages Resource Advanced Topics Introduction Getting Started SATAYO Items Settings Managed Service Mitre Attack Coverage Changelog Before you start Update Procedure Single Node Upgrade from 4.41 to 4.42 Cluster Upgrade from 4.41 to 4.42 Satellite Upgrade from 4.41 to 4.42 DPO machine Upgrade from 4.41 to 4.42 Create a mirror of the RPM repository Sprint Releases Feature Troubleshooting Tornado Networking Service Management - Incident Response IT Operation Analytics - Telemetry Identity Provider (IdP) Configuration Introduction to NEP Getting Started with NEPs Online Resources Obtaining NEP Insights Available Packages Advanced Topics Upgrade to NetEye 4.31 Setup Configure swappiness Restarting Stopped Services Enable stack traces in web UI How to access standard logs Director does not deploy when services assigned to a host have the same name How to enable/disable debug logging Activate Debug Logging for Tornado Modules/Services do not start Sync Rule fails when trying to recreate Icinga object How to disable InfluxDB query logging Managing an Elasticsearch Cluster with a Full Disk Some logs are not indexed in Elasticsearch Elasticsearch is not functioning properly Reporting: Error when opening a report Debugging Logstash file input filter Bugfix Policy Reporting Vulnerabilities Glossary 3b

Test Cases

Manage Test Cases

The Alyvix test cases list can be visualized by visiting the Alyvix / Test Cases page. The table displayed in the page provides a user with an overview of the test cases scheduled on all Alyvix nodes, useful to centralize, in a single view, the information coming from different nodes.

For each test case, the following data about its execution are displayed:

  • Name: The name of the test cases

  • Node: The name of the node on which the test case is scheduled

  • File: The name of the file associated with the test case

  • Arguments: The arguments used by the test case during its execution

For an easier lookup of the relevant information related to the test cases and their execution, it is possible to search the table, by using the search bar, and sort the various columns, clicking their name.

The Alyvix test cases page

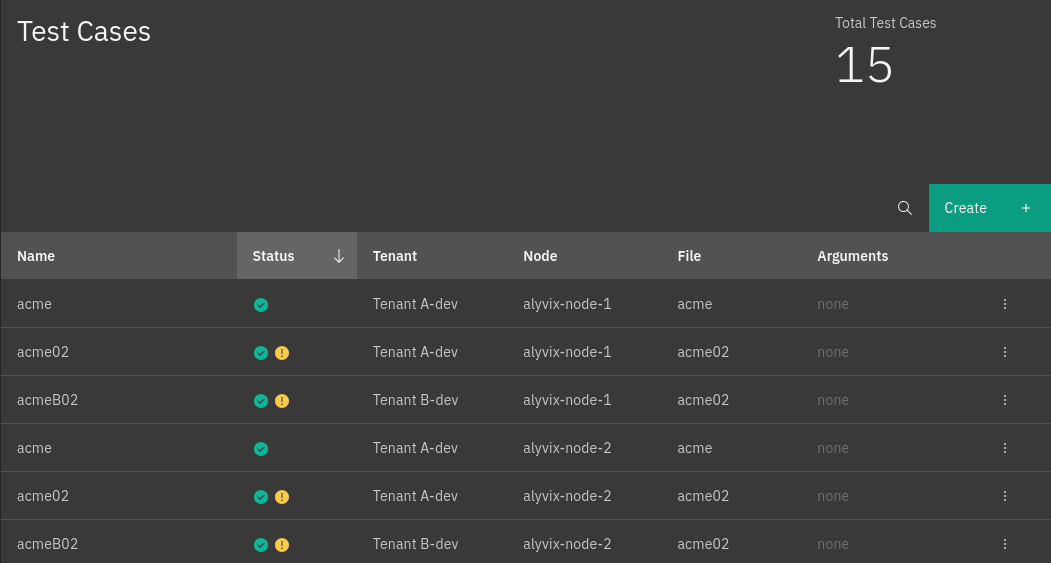
Fig. 150 The Alyvix test cases page

Moreover, a dedicated option of the More options menu allows a user to delete, after confirmation, a selected test case.

Furthermore, when visualizing the test cases, it is possible to add a test case by clicking the Create button. A side panel will open with the possibility to schedule a test case on one of the available nodes.

Manage Test Cases details

You can view the details of a particular test case by clicking it in the test cases list. The details panel for a selected test case will appear on the right, with details being grouped into Sessions and General tabs.

Sessions Tab

This tab reports all sessions a test case is scheduled for. Each session can be identified by its name and the status of a test case in the session, either enabled or disabled. The status can be simply changed by using the associated checkbox.

On the other hand, a session’s workflow and settings can be modified by clicking the arrow button for a particular session item.

The Alyvix test cases sessions details

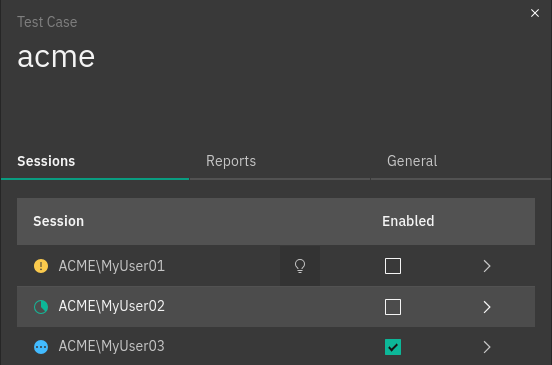
Fig. 151 The session details of a test case

General Tab

General test case details include:

  • Name: The name of a test case

  • Node: The node a test case is scheduled for

  • File: The file containing the test case definition, selectable among the files available on the node

  • Arguments: The arguments used by a test case during its execution

  • Time Period: Specifies during which time of the day and during which days the test case must be executed. You can select Time Periods that were previously configured as described here. By default the Test Case will be executed at all times.

  • Tags: Used to categorize and differentiate the test cases in different entities that belong to the same tenant. They can be used to filter test cases for specific viewers depending on their role and so the tag can reflect the organization/company name, department or even the brand/product name. For example, imagine that in a Tenant ACME there is a test case test_case_A that is run for the department depA and another test case test_case_B for department depB. You want that users of department depA only see test_case_A, and similar for department depB. To achieve this, you can assign the tag depA to test case test_case_A and tag depB to test case test_case_B, and then configure the role of department depA users to be restricted on tags depA, as described in the Tenant Viewer section. You can associate multiple tags by selecting them in the dropdown list. If the tag you are looking for is not present, you can create a new one using the dedicated form by clicking the ‘Add’ button.

When visualizing the general details of a test case, it is possible to update the file, arguments and the Time Period.

Note

In case the node has some time periods out of sync with respect to the corresponding definition in the Director, before updating a Test Case it will be necessary to sync the time periods definitions with the Alyvix Node, as mentioned in the Time periods Tab section.

The Alyvix test cases general details

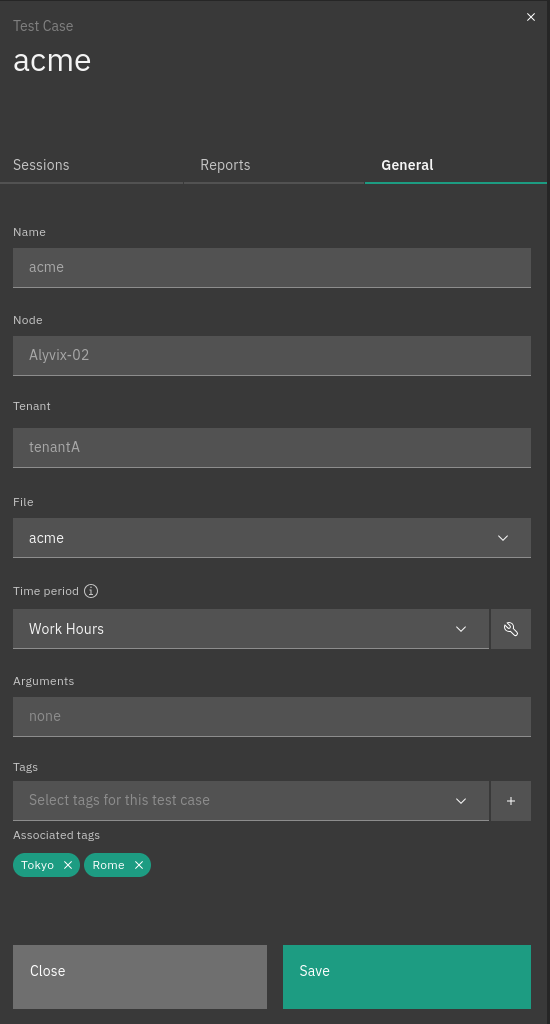
Fig. 152 The general details of a test case

Reports Tab

A test case is executed periodically by Alyvix. Each execution is called test case run. The Reports tab is the place where the runs of a test case are shown. Runs are ordered by date and time of execution, the most recent being added at the top of the list.

Each run is described by the following data:

  • Result icon: the result represented by a green icon for successfully run test cases, red icon for failed ones

  • Timestamp: the date and time when the test case was run

  • Session: the session in which the test was executed

  • Screenshot icon: an icon is displayed if the run has an associated screenshot of the execution

You can filter test cases to view only failed runs with a toggle on top of the list.

Clicking on a specific run will open the Report view, which shows the following details:

  • Node name: the name of the node where the test case was executed

  • Username: the username of the RDP session used by the test case

  • Date: the execution date

  • Time: the execution time

  • Duration: the time, in seconds, taken by the test case execution

  • Transactions list: a list of the transactions composing the test case. For each transaction, its execution status and duration are reported.

By selecting a transaction, you can consult the transaction parameters and understand how it performed. In particular, the following details are displayed:

  • Screenshots: if available, the screenshot taken by the Alyvix Robot (possibly with annotations and the transaction definition).

  • Transaction parameters: reporting the transaction performance and its specification.