Monitored Objects
Once you have created templates for hosts, commands and services, you can begin to create instances of monitored objects that inherit from those templates. The guide below shows how to do this manually. In addition, hosts can be imported using automated discovery methods, while services and commands can be drawn from template libraries.
Adding a Host
The New Host Panel (Fig. 26) is similar to the template panels, and is accessible from Director > Host objects > Hosts. Each row in the panel represents a single monitored host with both host name and IP address. Clicking on the host name shows the Host Configuration panel for that host to the right, and the “Add” action brings up an empty Host Configuration panel.
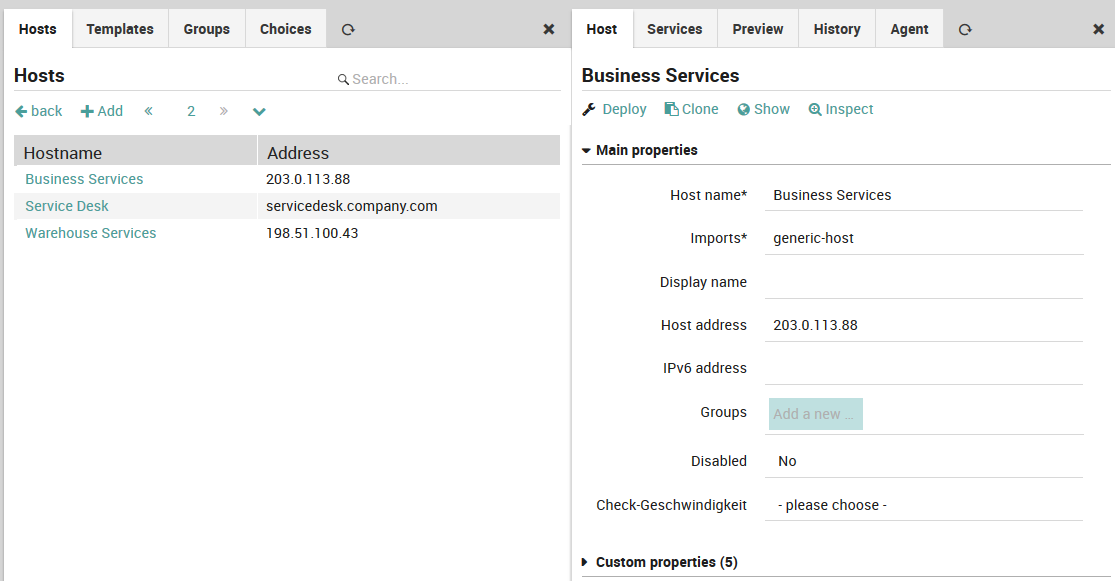
Fig. 26 Adding a new host
Like the template panel, there are tabs for Preview, History and Agent. In addition, there is a Services tab which shows all services assigned to that host, organized by inheritance and service set. Below the tabs is a “Show” action which takes you directly to the host object’s monitoring panel (i.e.,g click on the host under )
The following fields are important:
Hostname: This should be the host’s fully qualified domain name.
Imports: The host template(s) to inherit from.
Display name: A more friendly name shown in monitoring panels which does not have to be a FQDN.
Host address: The host’s IP address.
Groups: A drop down menu to assign this host to a defined host group.
Inherited groups, Applied groups: Assigned host groups, organized by how the group was assigned.
Disabled: Temporarily remove a host from monitoring, without deleting its configuration.
Custom properties: Fields defined for host templates, with the ability to select a value of the pre-defined type.
The remaining fields should be set on one of the host’s parent templates.
Note
You cannot create a host that does not inherit from at least one host template.
Adding a Command Check
The New Command Panel (Fig. 27, Director > Commands > Commands) displays one command per line, including the command name and the check command to be used (without arguments). While you can always click on the name of each field in this panel to see a description at the bottom of the web page, here is a quick summary:
Command Type: This is the same list as in the command template panel section.
Command Name: The reference name used to assign this check command to a service.
Imports: The parent command template(s). Unlike hosts and services, this is optional.
Command: The actual check command to use, without arguments.
Timeout: A timeout that will override an inherited timeout.
Disabled: Disabled commands cannot be assigned.
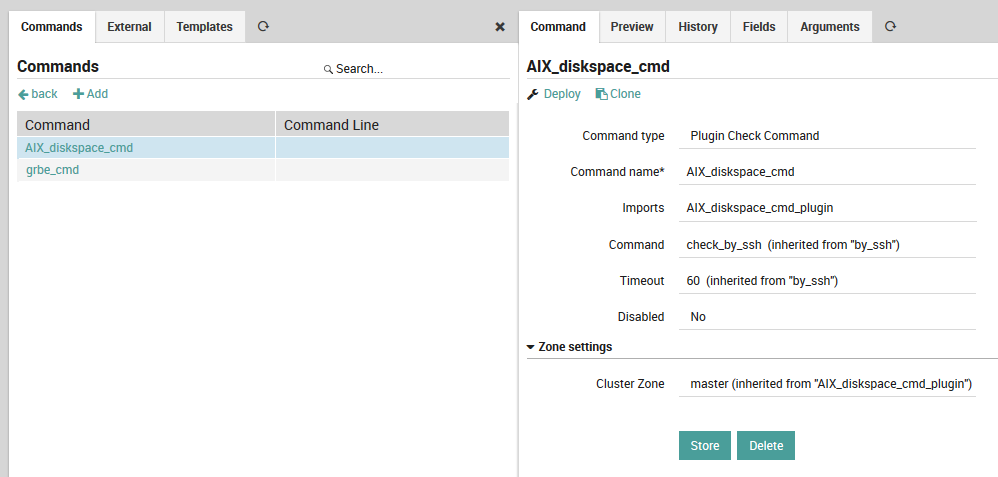
Fig. 27 Adding a new command
As with the command template panel, there is an Arguments tab (Fig. 28) that allows you to create parameter lists for the check commands either from scratch, or by overriding defaults from an inherited command template. You must create a separate entry for each parameter, which will then appear in the table below. To edit an existing parameter, simply click anywhere on its row in that list.
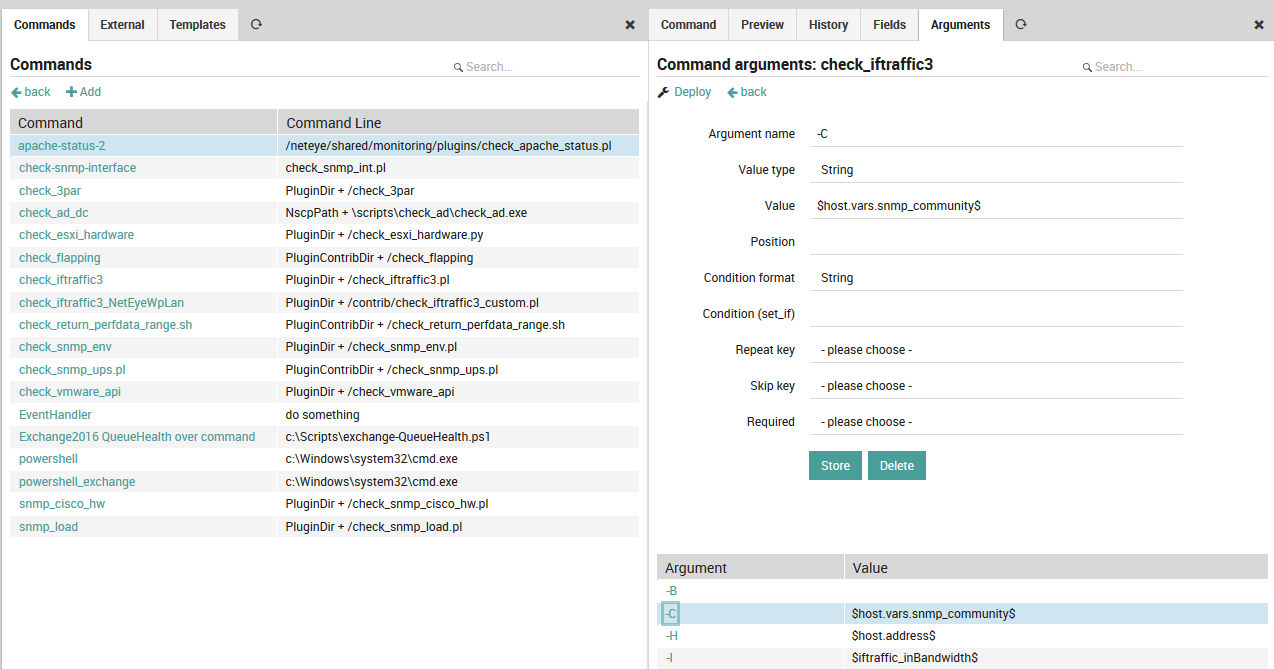
Fig. 28 Adding command arguments
For example, if when executing the check in a shell you need to use a parameter like “-C” with a given value, you will need to add it as an argument. All such arguments need to be listed in the Arguments table. For an argument’s “Value” parameter, you can enter either a system variable or a custom variable, both of which are indicated by a ‘$’ both before and after the variable name. This allows you to parameterize arguments across multiple host or service templates, including with any “Custom properties” fields you have created for those templates. This way you could parameterize for instance the following very common values at the Service level, and later change them all simultaneously if desired:
Credentials such as SNMP community strings, or usernames and passwords for SQL login
Common warning and critical thresholds
Addresses and port numbers
Units
For further details about command arguments, please see the official documentation.
Adding a Service
The Service Panel (Director > Monitored Services > Single Services) lists individual services that can be assigned to monitored hosts.
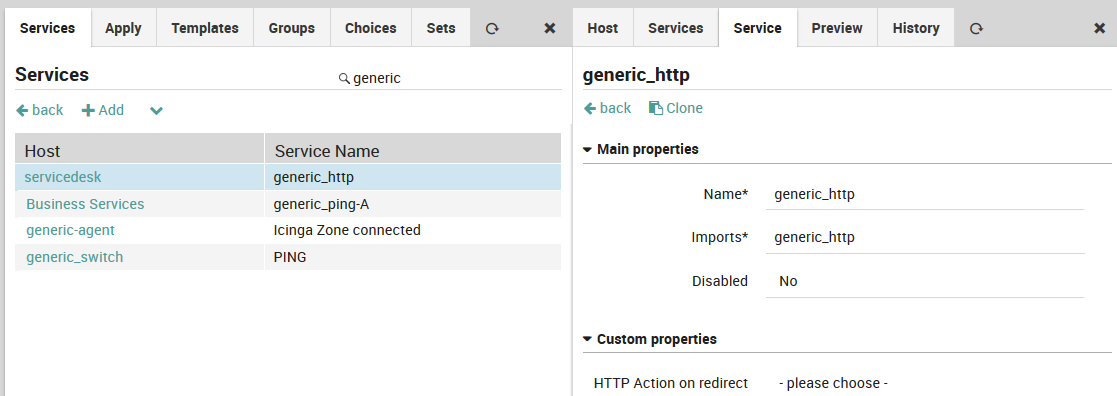
Fig. 29 The list of services in the Service Panel
Click on the “Add” action to display the New Service Panel ((Fig. 30) where you can create a new service by setting the following fields:
Name: Give the service a unique name.
Imports: The parent service template(s).
Host: The name of at least one host or host template to which this service should be applied.
Groups: The name of one or more service groups to which this service should belong.
Disabled: Whether or not this service can be assigned.

Fig. 30 Adding a new service
Note
You cannot create a service that does not inherit from at least one service template.
Host to Service View
When finding your hosts in the Overview, choosing a specific host would open services view of the host, allowing to see all the services with status associated with it.
In previous NetEye versions, clicking on a specific host in the Overview redirected to the host-details view.
Note
You can anytime rollback to the default functionality
(i.e., host to host details view), by disabling the
host2servicedetailview module in NetEye
()
Assign Service Templates to Hosts
Once you have created host and service templates, and individual hosts and services, you can assign service templates to hosts. (Only service templates can be assigned, not simple services.) There are three situations in which you can do this, and they are all performed in a similar manner:
Assign a service template to a host
Assign a service template to a host template
Assign a service template to a service set
For instance, to assign a service template to a host, go to Director > Host objects > Hosts and select the desired host. In the panel that appears on the right (see Figure 1), select the Services tab, then click on the “Add service” action and choose the desired service template from the “Service” drop down menu.
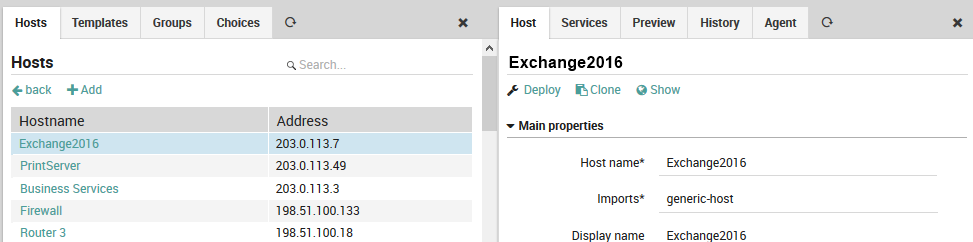
Fig. 31 Adding a service template to a host
Then under “Main properties”, choose the appropriate service or service template in the drop down under Service.
To add a service template to a host template, follow the above instructions after choosing a host template at Director > Host objects > Host Templates.
For service sets, follow Director > Services, Service Sets, select the desired service set, change to the Services tab, and click the “Add service” action, choosing the service template from the “Imports” drop down menu.
Mapping performance graphs to Services and Checkcommands
When adding new checkcommands to NetEye, the default representation of performance data, as a unitless counter, is often not adequate for display in the monitoring objects detail page.
In NetEye this performance graph visualization can be adapted by linking the name of a checkcommand or a service name to a ITOA Dashboard.
The following procedure describes how to do it:
Create a new dashboard related to the performance data of the desired check in ITOA Main Org. with as many panels as you need. In the queries, the variables $hostname, $service and $command can be used.
Go to the mappings configuration of Grafana module. From NetEye main menu Configuration > Modules > Grafana Graphs
Open the form to add a new mapping by clicking on the Add New Grafana Graph button.
The Name field must be equal to either the check name or the service name. This is the field that is used to find the right monitored object where to show the mapped performance graph.
The Dashboard field must contain the exact name of the dashboard created in the ITOA Main Org..
The Dashboard-UID field must contain the exact UID of the dashboard created in the ITOA Main Org..
Warning
The neteye install configures the mapping for most checkcommands out of the box. If a mapping has been modified for a checkcommand, this mapping will be overwritten with the NetEye default configuration.
If the default Performance Graph is not sufficient for your visualization needs, you can customize and adapt it by providing your own dahsboard. Check out Customizing Performance Graph section for more information.
Custom Dashboards for Hosts and Services
When you need to go beyond having a single, default dashboard for every host/service, it’s time to make a customized dashboard for those hosts/services that need them.
The following steps will guide you through the creation of a custom link that will point to the customized dashboard. The link will be visible in the monitored object Problem Handling - Actions section.
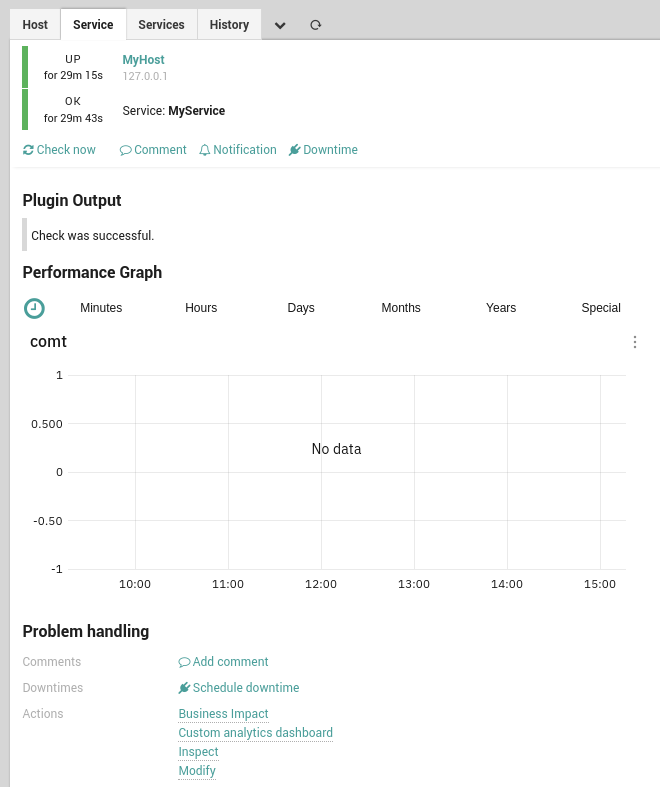
Fig. 32 Custom analytics dashboard link
If you need to create a custom dashboard for a particular service/host, you can set the parameter in Director’s service/host configuration. The custom dashboard should be specified as dataSource/dashboardName.
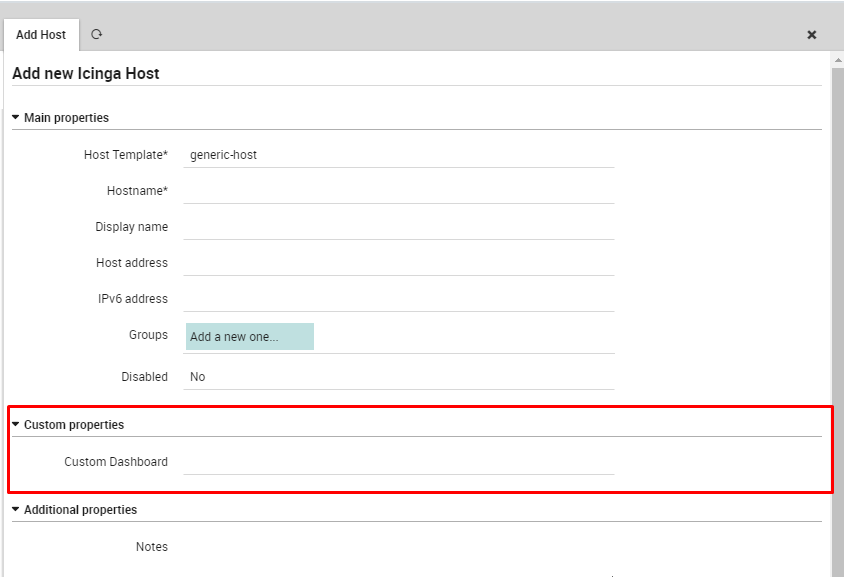
Fig. 33 ITOA hook configuration
The following steps show how you can create just such a custom dashboard field (for a service, follow the procedure below while starting from a service configuration rather than from a host).
First, click on Director in the left navigation sidebar, scroll to the bottom of the page, and select “Define Data Field” (Figure 2).
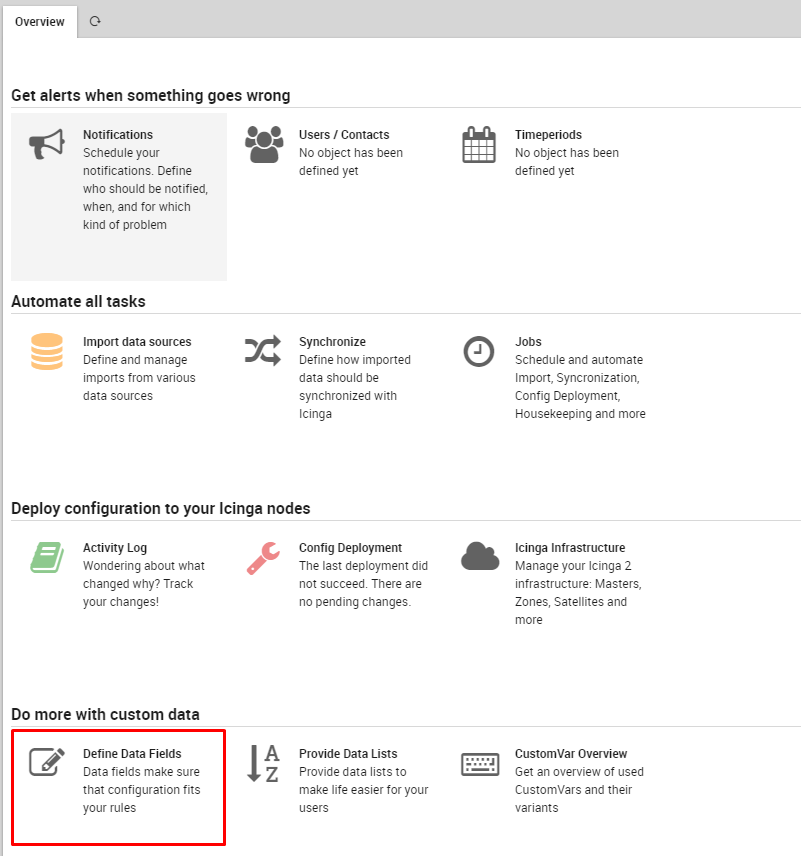
Fig. 34 Director Data Field
Now click “Add” and create a field with the field name set to custom_analytics_dashboard, then enter a caption of your choice (like “Custom Dashboard” in Figure 3).
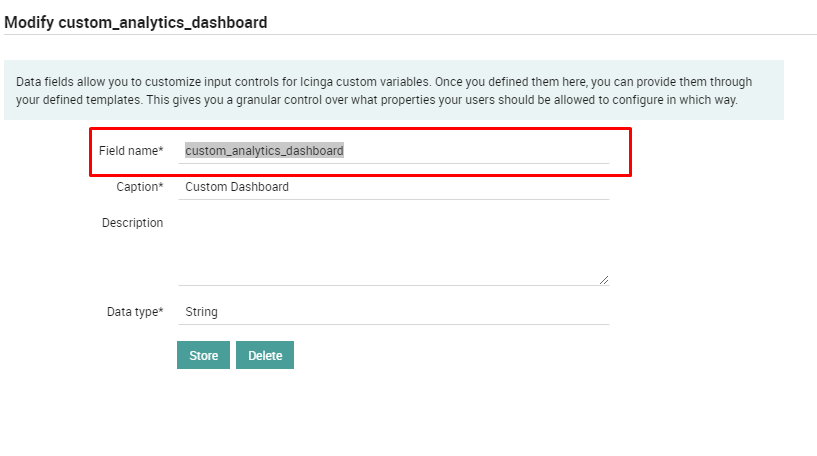
Fig. 35 Custom ITOA Dashboard Field
Once you add the new data field, you should add it to a service/host template. Open an existing template or create a new one (the same procedure works both for hosts and services). Click on the Fields tab, select the custom_analytics_dashboard field in the drop down box, and add that field to the template. (Do not set it as mandatory, because not all hosts/services will have or need a custom ITOA dashboard.)
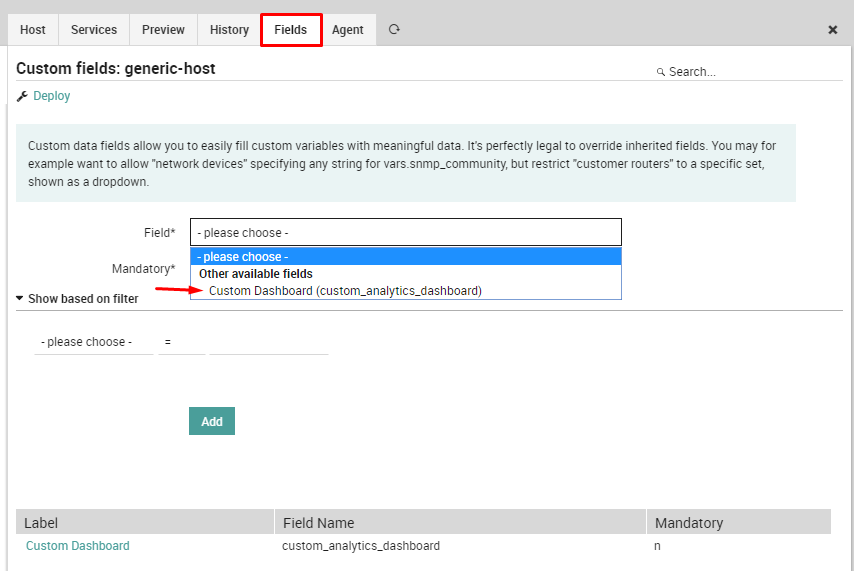
Fig. 36 Add Custom Field To Template
Lastly, deploy the final configuration. Now you can create a new host/service starting from the modified template and add a custom ITOA dashboard to it.
Icinga2 packages
Icinga2 packages are provided for most Linux distributions and windows. You can see a comprehensive list of supported OSs following this link repo.wuerth-phoenix.com/icinga2-agents/ and selecting your NetEye version.
For some enterprise operating systems, for example RHEL and SLES, the agent is only available for customers with an active subscription, and is hence only downloadable by registered IP addresses, just like our product packages. These agents are available via the /subscription/ URL.
Hint
Please refer to the consultants, or support portal in case of doubt about your IP authentication.
Note
In order to install Icinga2 packages you need to have the boost libraries installed
(version 1.66.0 or newer) or available via the default package manager.
Icinga2 repository versioning
You must use Icinga2 packages provided by the NetEye repositories instead of the official Icinga2 packages. From 4.16 onwards, icinga2 agents are version specific both for the NetEye version and for the monitored operating system version. You can modify package URLs accordingly. If you are downloading packages for 4.<neteye_minor>, you need to change /icinga2-agents/neteye-x.x with /icinga2-agents/neteye-4.<neteye_minor> in below packages urls.
Add the NetEye repository for Icinga2 packages
This section will explain how to add the dedicated NetEye repository for Icinga2 packages in different OSs and distributions (e.g. Ubuntu, CentOS, SUSE), thus supporting the installation of an Icinga2 agent via the default package manager installed in the OS.
URL repository follow this syntax:
https://repo.wuerth-phoenix.com/icinga2-agents/neteye-4.<neteye_minor>/<distribution>-<codename_or_version>/
Icinga2 RPM repository
To add the repository that provides the Icinga2 RPM packages (e.g. CentOS, SUSE, Fedora) you have to add a new repository definition to your system.
Let us suppose that you need to add the new repository definition on a CentOS 7
machine, which is monitored via NetEye 4.xx. You can add the repo definition
in a file neteye-icinga2-agent.repo:
[neteye-agent]
name=NetEye Icinga2 Agent Packages
baseurl=https://repo.wuerth-phoenix.com/icinga2-agents/neteye-4.xx/centos-7/
gpgcheck=0
enabled=1
priority=1
Please note that the location of this file will change according with
the distribution used. For example, on Fedora and CentOS
installations the default repo definition directory is
/etc/yum.repos.d/, while SUSE will use
/etc/zypp/repos.d/.
Once the new repository has been added, you need to load the new repository data by running dnf update.
Icinga2 DEB repository
To add the Icinga2 agent repository on Ubuntu or Debian systems you have to create the file
neteye-icinga2-agent.list in the directory /etc/apt/sources.list.d/`.
For example, to add the repository on a Ubuntu 20.04 Focal Fossa you have to create a file with the following content:
"deb [trusted=yes] https://repo.wuerth-phoenix.com/icinga2-agents/neteye-4.xx/ubuntu-focal/ stable main"
Finally, run apt update to update the repo data.
Icinga2 windows packages
Get the Icinga2 Agent for Windows accessing the URL below and downloading the .msi file (replace x.x with the NetEye version number, e.g. 4.31):
https://repo.wuerth-phoenix.com/icinga2-agents/neteye-x.x/windows/
Install Icinga2
To install Icinga2, follow Icinga2 Documentation Icinga2 requires boost libraries to work properly. Ensure that the libraries are also installed on the system.
To install windows msi on agent, follow Icinga2 Windows Agent Installation official document.