Monitoring Status
As you configured your monitoring environment and created checkcommands to be run, you can always check out the Monitoring status of the objects.
The monitoring Overview is presented in monitoring panels, allowing you to check out the status or have a closer look at all the details of the check result. You can sort the results by Host or Services, or even see the aggregated stats for the host or service groups, and even check comments or the status of a scheduled downtime.
Monitoring view
The Monitoring panels in NetEye are divided into several sections, each carrying different information. Access to the Monitoring View requires the user to have a role with appropriate permissions in the Monitoring module; a Role with General Access Module usually suffices for this purpose.
Starting from Release 4.14, the new monitoringview module introduces a new functionality to selectively hide or show each section of the monitoring panels to a role - and therefore to a user. You can grant these permissions in Configuration > Access Control > Roles under the monitoringview module; each section as an associated permission with the same name:
Plugin Output:
monitoringview/plugin-outputProblem handling:
monitoringview/problem-handlingPerformance Data:
monitoringview/performance-dataNotifications:
monitoringview/notificationsCheck execution:
monitoringview/check-executionFeature Commands:
monitoringview/feature-commandCustom variables:
monitoringview/custom-variables
Note
Monitoring Panels have two additional sections,
Performance Graph and Quick Actions, which are not managed
within this module. You can hide or show these sections by modifying
the corresponding permission in their modules:
Performance Graph: Already present in ITOA module, this section can be hidden or shown by acting on
general module accessandanalytics/view-performance-graphpermission from analytic module.Quick Actions: It is a monitoring module permission that can be used to hide complete or specific command with the
monitoring/command/*permission. This Quick Actions section has commands likecheck now,Comment,Notification,Downtime.
Using the Custom Problem View
Access to the Problem View requires the user to have a role with appropriate permissions in the Monitoring module; a Role with General Access Module suffices for the purpose.
Starting from Release 4.13, a new functionality has been added to
the Problems View. The new module customproblemview indeed, defines a
new permission in the form of a filter called
customproblemview/excludefilter/objects, which allows to define a
suitable filter to show only a subset of host problems, service
problems, or both.
In Configuration > Access Control > Roles, you can define the
customproblemview/excludefilter/objects, that represents the
monitoring filter, selecting the monitoring objects you want to filter
out from the Problem View.
For example, let’s suppose that your monitoring system is monitoring
both production and test environments. All hosts belonging to test
environment belong to a “test-system” hostgroup. If you wan to see only
the production hosts in the Problem View, you just need to create a role
with the proper filter in customproblemview/excludefilter/objects
(e.g. hostgroup=test-system).
Note that if a user belongs to more than one role with a specified
customproblemview/excludefilter/objects, the filter will become more
and more selective, showing only objects that belong to all the filters.
Add Columns to List Views
The monitoring module provides list views for hosts and services. These lists only provide the most common columns to reduce the backend query load.
If you want to add more columns to the list view e.g. in order to use
the URL in your dashboards or as external iframe integration, you need
the addColumns URL parameter.
Example for adding the host address attribute in a host list::
/neteye/monitoring/list/hosts?addColumns=host_address
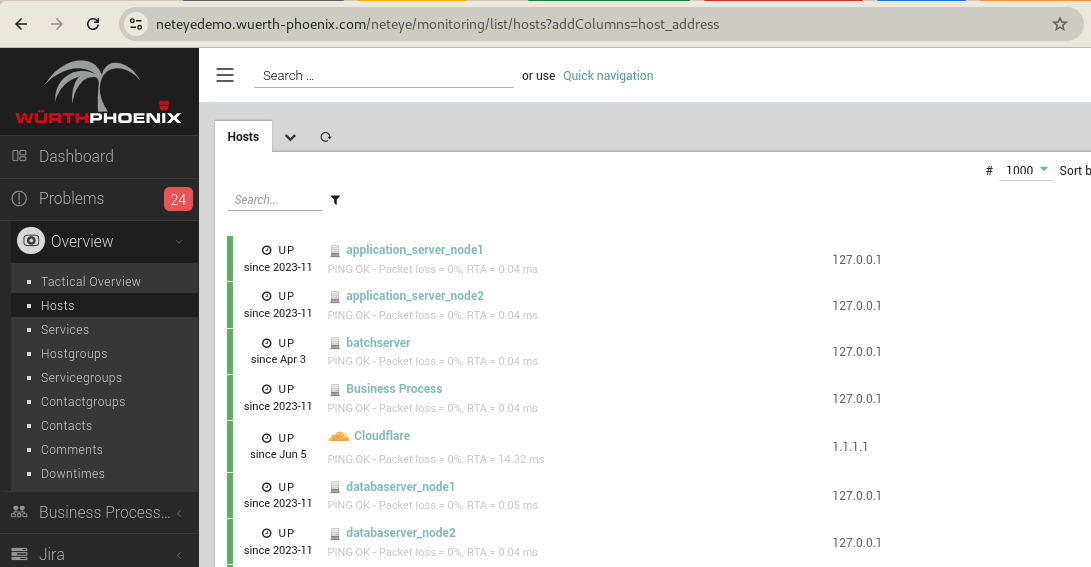
Fig. 100 Screenshot
Example for multiple columns as comma separated parameter string. This
includes a reference to the Icinga 2 host object custom attribute os
using _host_ as custom variable identifier:
/neteye/monitoring/list/services?addColumns=host_address,_host_os
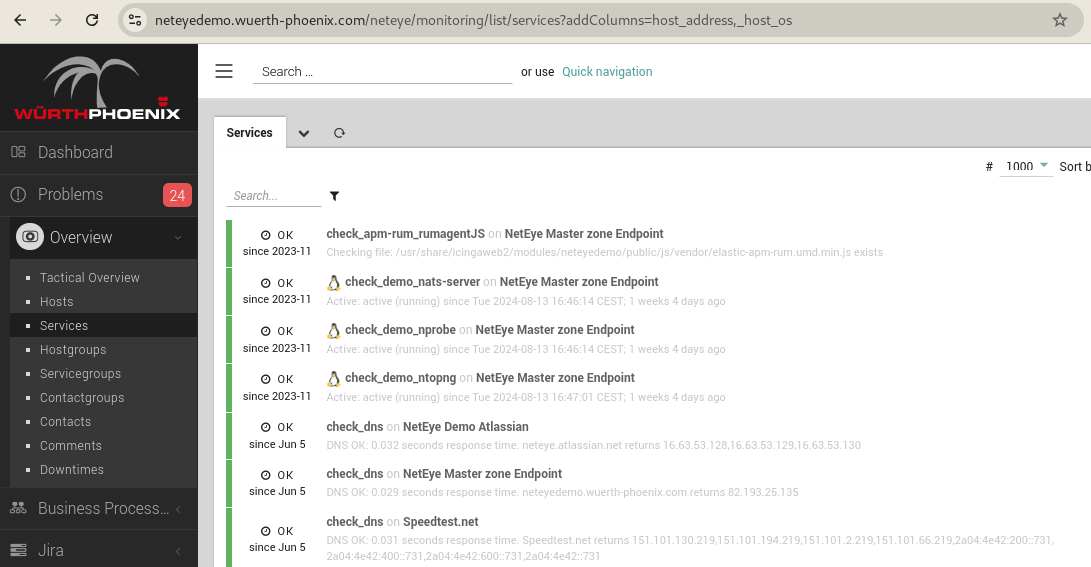
Fig. 101 Screenshot
Protecting Credentials in the Monitoring Views
The monitoring views display the values for all fields configured for a host or service. These views will also display any custom variables you define as fields in the view. If one or more fields contain sensitive information such as MySQL accounts, passwords, or SNMP Community Strings, best practice is to hide the values of those fields in the monitoring views (they will remain visible in Director’s configuration panels).
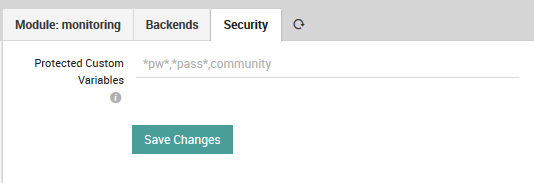
Fig. 102 Specifying fields containing credentials.
You can do this by going to Configuration > Modules > monitoring > Security (Fig. 102) and setting a pattern that will hide the values for all fields derived from custom variables where those fields’ names match the pattern. This pattern goes in the field “Protected Custom Variables”, where the syntax is defined by Icinga.
To summarize, this field should contain a comma separated list of case insensitive pattern strings, where * is the only allowed matching operator. Note that any spaces you include will count as part of the pattern between commas. The field is initially empty, with the suggested example *pw*,*pass*,community*, which would match the strings “pw”, “password”, and “Community”, among others.
If a field name matches the pattern, then that field’s value will be replaced with asterisks as shown in Fig. 103, hiding the real contents from view.
Fig. 103 Protected password in the host monitoring view.
Include Custom Variables in Search Results by Default
By default, custom variables are not used for filtering monitoring search results. To change the default behavior and choose which custom variables to include automatically, you can use the dedicated panel in the Neteye module configuration section: simply write variable names (as displayed inside Hosts or Services) separated by commas, without any spaces.
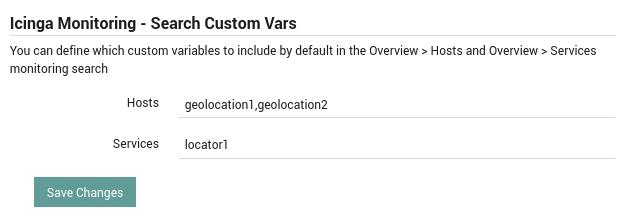
Fig. 104 Specifying custom variables to include by default.
You can do this by going to Configuration > Modules > neteye > Configuration (Fig. 104) and scroll down to the “Icinga Monitoring - Search Custom Vars” section. Here you can insert the names of the custom variables you want to extend the search results with by default, for both hosts and services.
The variables are saved in the Neteye module config.ini file, and now when you launch a search in the monitoring hosts or services list you’ll see that the filter is automatically updated and search results are linked to the custom variables you’ve chosen.
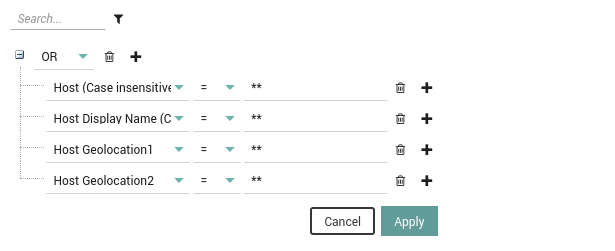
Fig. 105 Custom variables are included in the filter automatically.