User Guide Functional Overview Requirements Architecture System Installation NetEye Additional Components Installation Setup The neteye Command Director NetEye Self Monitoring Tornado Business Service Monitoring IT Operation Analytics - Telemetry Geo Maps NagVis Audit Log Shutdown Manager Reporting ntopng Visual Monitoring with Alyvix Elastic Stack IT Operations (Command Orchestrator) Asset Management Service Level Management Cyber Threat Intelligence - SATAYO NetEye Update & Upgrade How To NetEye Extension Packs Troubleshooting Security Policy Glossary
module icon Director
Monitoring Environment Templates Monitored Objects Import Monitored Objects Data Fields Deployment Icinga 2 Agents Configuration Baskets Dashboard Monitoring Status VMD Permissions Notifications Jobs API Configuring Icinga Monitoring Retention Policy
Director NetEye Self Monitoring Tornado Business Service Monitoring IT Operation Analytics - Telemetry Geo Maps NagVis Audit Log Shutdown Manager Reporting Introduction to NetEye Monitoring Business Service Monitoring IT Operation Analytics Visualization Network Visibility Log Management & Security Orchestrated Datacenter Shutdown Application Performance Monitoring User Experience Service Management Service Level Management & Reporting Requirements for a Node Cluster Requirements and Best Practices NetEye Satellite Requirements TCP and UDP Ports Requirements Additional Software Installation Introduction Single Node Cluster NetEye Master Master-Satellite Architecture Underlying Operating System Acquiring NetEye ISO Image Installing ISO Image Single Nodes and Satellites Cluster Nodes Configuration of Tenants Satellite Nodes Only Nodes behind a Proxy Additional NetEye Components Single Node Cluster Node Satellites Nodes only Verify if a module is running correctly Accessing the New Module Cluster Satellite Security Identity and Access Management External Identity Providers Configure federated LDAP/AD Emergency Reset of Keycloak Configuration Advanced Configuration Authorization Resources Tuning Advanced Topics Basic Concepts & Usage Advanced Topics Monitoring Environment Templates Monitored Objects Import Monitored Objects Data Fields Deployment Icinga 2 Agents Configuration Baskets Dashboard Monitoring Status VMD Permissions Notifications Jobs API Configuring Icinga Monitoring Retention Policy NetEye Self Monitoring 3b Concepts Collecting Events Add a Filter Node WHERE Conditions Iterating over Event fields Retrieving Payload of an Event Extract Variables Create a Rule Tornado Actions Test your Configuration Export and Import Configuration Example Under the hood Development Retry Strategy Configuration Thread Pool Configuration API Reference Configure a new Business Process Create your first Business Process Node Importing Processes Operators The ITOA Module Configuring User Permissions Telegraf Metrics in NetEye Telegraf Configuration Telegraf on Monitored Hosts Visualizing Dashboards Customizing Performance Graph The NetEye Geo Map Visualizer Map Viewer Configuring Geo Maps NagVis 3b Audit Log 3b Overview Shutdown Manager user Shutdown Manager GUI Shutdown Commands Advanced Topics Overview User Role Management Cube Use Cases ntopng and NetEye Integration Permissions Retention Advanced Topics Overview User Roles Nodes Test Cases Dashboard Use Cases Overview Architecture Authorization Elasticsearch Overview Enabling El Proxy Sending custom logs to El Proxy Configuration files Commands Elasticsearch Templates and Retentions El Proxy DLQ Blockchain Verification Handling Blockchain Corruptions El Proxy Metrics El Proxy Security El Proxy REST Endpoints Agents Logstash Elastic APM Elastic RUM Log Manager - Deprecated Overview Authorization in the Command Orchestrator Module Configuring CLI Commands Executing Commands Overview Permissions Installation Single Tenancy Multitenancy Communication through a Satellite Asset collection methods Display asset information in monitoring host page Overview Customers Availability Event Adjustment Outages Resource Advanced Topics Introduction Getting Started SATAYO Items Settings Managed Service Mitre Attack Coverage Changelog Before you start Update Procedure Single Node Upgrade from 4.41 to 4.42 Cluster Upgrade from 4.41 to 4.42 Satellite Upgrade from 4.41 to 4.42 DPO machine Upgrade from 4.41 to 4.42 Create a mirror of the RPM repository Sprint Releases Feature Troubleshooting Tornado Networking Service Management - Incident Response IT Operation Analytics - Telemetry Identity Provider (IdP) Configuration Introduction to NEP Getting Started with NEPs Online Resources Obtaining NEP Insights Available Packages Advanced Topics Upgrade to NetEye 4.31 Setup Configure swappiness Restarting Stopped Services Enable stack traces in web UI How to access standard logs Director does not deploy when services assigned to a host have the same name How to enable/disable debug logging Activate Debug Logging for Tornado Modules/Services do not start Sync Rule fails when trying to recreate Icinga object How to disable InfluxDB query logging Managing an Elasticsearch Cluster with a Full Disk Some logs are not indexed in Elasticsearch Elasticsearch is not functioning properly Reporting: Error when opening a report Debugging Logstash file input filter Bugfix Policy Reporting Vulnerabilities Glossary 3b

Dashboard

If you launch NetEye with no hosts or services configured, you will see the empty dashboard shown in Fig. 95.

Empty dashboard

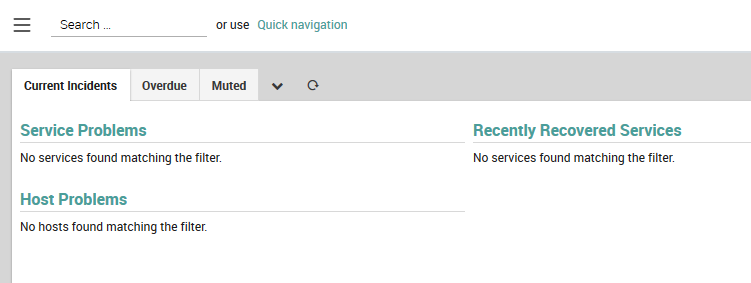
Fig. 95 Empty Dashboard when NetEye is used for the first time.

At the top of the initial dashboard are three default dashboard tabs, which you can click on to switch between the dashboards. The initial dashboards will remain empty until you configure hosts and servers in Director:

  • Current Incidents: Contains dashlets that list Service Problems, Host Problems, and Recently Recovered Services.

  • Overdue: Shows hosts and services with unreturned check results, and acknowledgments and downtimes lasting at least three days.

  • Muted: Contains notifications about disabled host and services, disabled checks, and acknowledged problems.

Next to the three tabs are two icons: a “Chevron” menu chevron for customizing the dashboards, and a reload refresh button.

Note

If you would like to customize your dashboard, we recommend that you start with a clean dashboard rather than a system-provided one.

The dashboard customization menu has two options:

  • Add dashlet: Add a dashlet to the currently selected dashboard. A dashlet can be any view within Icinga2 that has an associated URL.

  • Settings: This will display a panel allowing you to customize the currently selected dashboard by removing the current elements and sorting your custom elements (only your customized elements can be sorted).

Dashlets

Dashlets are the individual panels on a dashboard. To add a dashlet (see Fig. 96), follow these steps:

  1. Copy the URL of the view you want to add from the browser’s URL bar while that view is open.

  2. Go to the desired Dashboard, select “Add Dashlet” from the Chevron menu, and paste the URL from the previous step in the “Url” field. The URL can include filters and other options.

  3. Give the dashlet a display title.

  4. Check the box if you want to add it instead to a brand new dashboard (if so, give the new dashboard a title in the next field).

  5. Otherwise, choose the dashboard you want to add the dashlet to from the list box.

  6. Finally, click on the green “Add To Dashboard” button. Your new dashlet should now be visible on the selected dashboard.

Add a dashlet

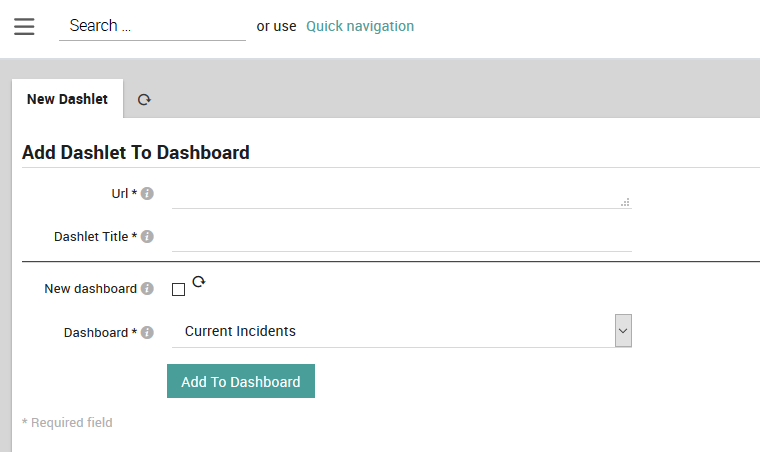
Fig. 96 The panel to add a new dashlet.

To add a new dashboard, select a view, copy its URL, and follow the procedure above to add a dashlet to a new dashboard. To customize your dashboard, select the Settings menu option, which will display the customization panel shown in Fig. 97. In NetEye you can:

  • Remove a dashboard or dashlet by clicking on the corresponding trash can icon trashbin to the right.

  • Reorder dashlets by using the up- and down-arrows uparrow , downarrow shown at the right side of Fig. 97. Note that while you can remove the default dashlets, you cannot reorder them. The first dashlet is displayed at the top left of the dashboard, and each subsequent dashlet is shown to the right of the previous one until it wraps around to the next row. To completely customize your dashboard, you should start with a new, blank one.

  • Edit a dashlet in a dashboard by clicking on the corresponding dashlet name to the left, as shown in Fig. 98

  • Modify a dashlet’s behavior by clicking on the dashlet’s URL as shown in Fig. 99, for example to change the filtering and search parameters.

Dashboard settings

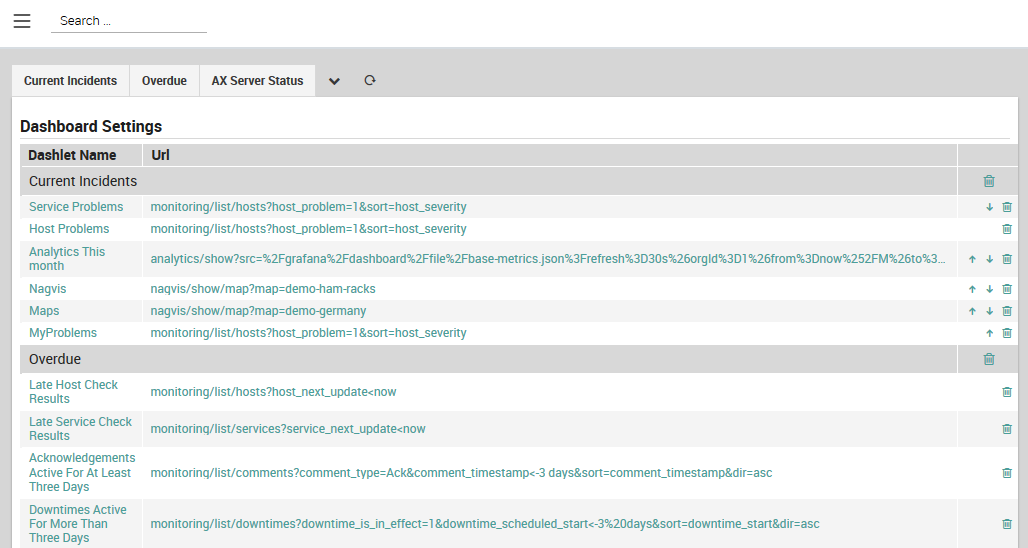
Fig. 97 The dashboard customization panel.

Edit a dashlet

Fig. 98 Editing a dashlet.

Dashlet behavior

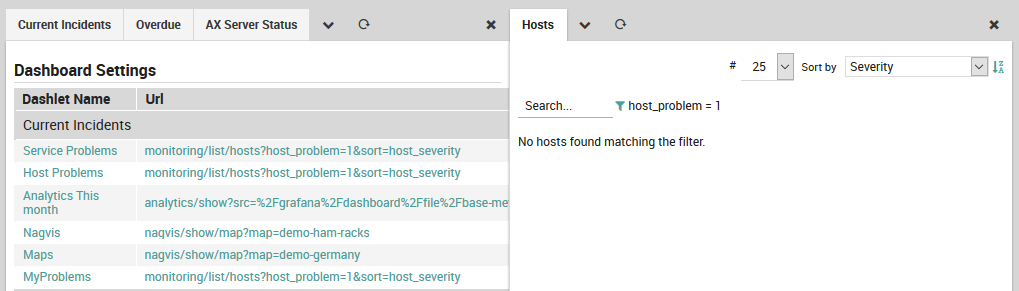
Fig. 99 Modifying a dashlet’s behavior.