User Guide Functional Overview Requirements Architecture System Installation NetEye Additional Components Installation Setup The neteye Command Director NetEye Self Monitoring Tornado Business Service Monitoring IT Operation Analytics - Telemetry Geo Maps NagVis Audit Log Shutdown Manager Reporting ntopng Visual Monitoring with Alyvix Elastic Stack IT Operations (Command Orchestrator) Asset Management Service Level Management Cyber Threat Intelligence - SATAYO NetEye Update & Upgrade How To NetEye Extension Packs Troubleshooting Security Policy Glossary
module icon Director
Monitoring Environment Templates Monitored Objects Import Monitored Objects Data Fields Deployment Icinga 2 Agents Configuration Baskets Dashboard Monitoring Status VMD Permissions Notifications Jobs API Configuring Icinga Monitoring Retention Policy
Director NetEye Self Monitoring Tornado Business Service Monitoring IT Operation Analytics - Telemetry Geo Maps NagVis Audit Log Shutdown Manager Reporting Introduction to NetEye Monitoring Business Service Monitoring IT Operation Analytics Visualization Network Visibility Log Management & Security Orchestrated Datacenter Shutdown Application Performance Monitoring User Experience Service Management Service Level Management & Reporting Requirements for a Node Cluster Requirements and Best Practices NetEye Satellite Requirements TCP and UDP Ports Requirements Additional Software Installation Introduction Single Node Cluster NetEye Master Master-Satellite Architecture Underlying Operating System Acquiring NetEye ISO Image Installing ISO Image Single Nodes and Satellites Cluster Nodes Configuration of Tenants Satellite Nodes Only Nodes behind a Proxy Additional NetEye Components Single Node Cluster Node Satellites Nodes only Verify if a module is running correctly Accessing the New Module Cluster Satellite Security Identity and Access Management External Identity Providers Configure federated LDAP/AD Emergency Reset of Keycloak Configuration Advanced Configuration Authorization Resources Tuning Advanced Topics Basic Concepts & Usage Advanced Topics Monitoring Environment Templates Monitored Objects Import Monitored Objects Data Fields Deployment Icinga 2 Agents Configuration Baskets Dashboard Monitoring Status VMD Permissions Notifications Jobs API Configuring Icinga Monitoring Retention Policy NetEye Self Monitoring 3b Concepts Collecting Events Add a Filter Node WHERE Conditions Iterating over Event fields Retrieving Payload of an Event Extract Variables Create a Rule Tornado Actions Test your Configuration Export and Import Configuration Example Under the hood Development Retry Strategy Configuration Thread Pool Configuration API Reference Configure a new Business Process Create your first Business Process Node Importing Processes Operators The ITOA Module Configuring User Permissions Telegraf Metrics in NetEye Telegraf Configuration Telegraf on Monitored Hosts Visualizing Dashboards Customizing Performance Graph The NetEye Geo Map Visualizer Map Viewer Configuring Geo Maps NagVis 3b Audit Log 3b Overview Shutdown Manager user Shutdown Manager GUI Shutdown Commands Advanced Topics Overview User Role Management Cube Use Cases ntopng and NetEye Integration Permissions Retention Advanced Topics Overview User Roles Nodes Test Cases Dashboard Use Cases Overview Architecture Authorization Elasticsearch Overview Enabling El Proxy Sending custom logs to El Proxy Configuration files Commands Elasticsearch Templates and Retentions El Proxy DLQ Blockchain Verification Handling Blockchain Corruptions El Proxy Metrics El Proxy Security El Proxy REST Endpoints Agents Logstash Elastic APM Elastic RUM Log Manager - Deprecated Overview Authorization in the Command Orchestrator Module Configuring CLI Commands Executing Commands Overview Permissions Installation Single Tenancy Multitenancy Communication through a Satellite Asset collection methods Display asset information in monitoring host page Overview Customers Availability Event Adjustment Outages Resource Advanced Topics Introduction Getting Started SATAYO Items Settings Managed Service Mitre Attack Coverage Changelog Before you start Update Procedure Single Node Upgrade from 4.41 to 4.42 Cluster Upgrade from 4.41 to 4.42 Satellite Upgrade from 4.41 to 4.42 DPO machine Upgrade from 4.41 to 4.42 Create a mirror of the RPM repository Sprint Releases Feature Troubleshooting Tornado Networking Service Management - Incident Response IT Operation Analytics - Telemetry Identity Provider (IdP) Configuration Introduction to NEP Getting Started with NEPs Online Resources Obtaining NEP Insights Available Packages Advanced Topics Upgrade to NetEye 4.31 Setup Configure swappiness Restarting Stopped Services Enable stack traces in web UI How to access standard logs Director does not deploy when services assigned to a host have the same name How to enable/disable debug logging Activate Debug Logging for Tornado Modules/Services do not start Sync Rule fails when trying to recreate Icinga object How to disable InfluxDB query logging Managing an Elasticsearch Cluster with a Full Disk Some logs are not indexed in Elasticsearch Elasticsearch is not functioning properly Reporting: Error when opening a report Debugging Logstash file input filter Bugfix Policy Reporting Vulnerabilities Glossary 3b

VMD

vSphereDB Monitoring Integration

To easily and reliably check the status of a Monitored Object it is fundamental to find all its Monitoring information in a single point. The VMD module integrates the information related to your Virtualization infrastructure next to each Host in the Monitoring.

To integrate the VMD information into the Monitoring module, navigate to VMD / Configuration / Monitoring and then add a new integration by clicking the Add button.

Configure the parameters related to your vCenter and Monitoring backend (IDO Resource and Source Type), then you only need to configure a mapping that relates each Monitored Host with a VMD Object (Host or Virtual Machine).

For example if you have a VM called my_example_vm whose hostname is example.com and the Monitoring Host representing this VM has hostname example.com, you need to map the Virtual Machine Property Guest Hostname with the Monitored Host Property Hostname.

You can add more integrations for all the other property mappings that exists in your infrastructure.

If your integration has been correctly configured, you will see a new section like in Fig. 106 in the status page of those Monitored Host mapped with a VMD Object.

vSphereDB Monitoring Integration

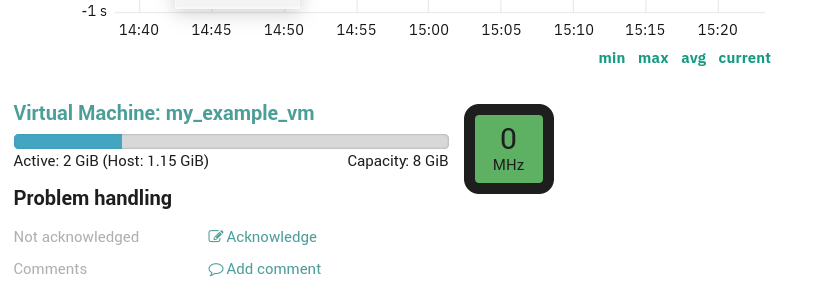
Fig. 106 vSphereDB Monitoring Integration Section.

vSphereDB Dashboards

The NetEye VMD Module installs out-of-the-box dashboards in The ITOA Module, which give you easy access to both an overview and detailed information of your virtualization infrastructure.

In particular, the dashboards are available in the Main Org. Grafana Organization under the folder neteye-vspheredb-graphs and include the following dashboards:

  • Top VMs: shows which Virtual Machines are responsible for the most traffic on their Virtual Interfaces in the given time period

  • Virtual Machine Details: gives you insights on the System-level performance of each Virtual Machine

Since InfluxDB is used to store data used by the Dashboards, please configure the vCenter(s) in NetEye VMD to write the Performance Data of your vCenter(s).

Configure a vCenter to write Performance Data

In Single-Tenant environments it is fine to write the Performance Data of all your vCenters in a single InfluxDB database.

In Multi-Tenant environments, instead, it is necessary that Performance Data of vCenters belonging to different tenants be written on separate databases.

The procedure to follow for these two cases is different and is described below.

Single-Tenant environment

Supposing our vCenter is named example_vCenter, proceed as follows:

  1. Navigate to VMD / example_vCenter

  2. Click the Edit button

  3. In the Ship Performance Data form set:

    • Performance Data Consumer to influx-perfdata

    • Database to vspheredb

      Note

      Both influx-perfdata and vspheredb are created by default by NetEye.

  4. Save the changes

Multi-Tenant environment

The procedure in this case is longer because each tenant should access a different database with a different user.

In the following example we will assume that the we need to configure the vCenter example_vCenter within the tenant example_tenant.

  1. Create the InfluxDB database vspheredb_example_tenant and an InfluxDB user with the same name (if they do not exist already):

    1. Connect to the influxdb console with:

      neteye# influx -host influxdb.neteyelocal -ssl -username root -password "$(cat /root/.pwd_influxdb_root)"
      
    2. Create the database:

      CREATE DATABASE "vspheredb_example_tenant"
      
    3. Create the user:

      CREATE USER "vspheredb_example_tenant" WITH PASSWORD '<securepassword>'
      

      Note

      Substitute <securepassword> with a secure password and save it in the file /root/.pwd_influxdb_vspheredb_example_tenant to avoid forgetting it.

    4. Grant the user vspheredb_example_tenant permissions on the database vspheredb_example_tenant:

      GRANT ALL ON "vspheredb_example_tenant" TO "vspheredb_example_tenant"
      
  2. Create the Performance Data Consumer influx-perfdata-example_tenant:

    1. Go to VMD / Configuration / Performance Data

    2. Click on the Add button

    3. In the form set:

      • Name to influx-perfdata-example_tenant

      • Implementation to InfluxDB

      • Base URL to https://influxdb.neteyelocal:8086

      • Username to vspheredb_example_tenant (the InfluxDB user created above)

      • Password to the password of the vspheredb_example_tenant user (you should have saved it in the file /root/.pwd_influxdb_vspheredb_example_tenant)

    4. Save the changes

  3. Navigate to VMD / example_vCenter

  4. Click on the Edit button

  5. In the Ship Performance Data form set:

    • Performance Data Consumer to influx-perfdata-example_tenant

    • Database to vspheredb_example_tenant

  6. Save the changes

You should then repeat this procedure for every tenant of which you want to enable the Dashboards.