User Guide Functional Overview Requirements Architecture System Installation NetEye Additional Components Installation Setup The neteye Command Director NetEye Self Monitoring Tornado Business Service Monitoring IT Operation Analytics - Telemetry Geo Maps NagVis Audit Log Shutdown Manager Reporting ntopng Visual Monitoring with Alyvix Elastic Stack IT Operations (Command Orchestrator) Asset Management Service Level Management Cyber Threat Intelligence - SATAYO NetEye Update & Upgrade How To NetEye Extension Packs Troubleshooting Security Policy Glossary
module icon Business Service Monitoring
Configure a new Business Process Create your first Business Process Node Importing Processes Operators
Director NetEye Self Monitoring Tornado Business Service Monitoring IT Operation Analytics - Telemetry Geo Maps NagVis Audit Log Shutdown Manager Reporting Introduction to NetEye Monitoring Business Service Monitoring IT Operation Analytics Visualization Network Visibility Log Management & Security Orchestrated Datacenter Shutdown Application Performance Monitoring User Experience Service Management Service Level Management & Reporting Requirements for a Node Cluster Requirements and Best Practices NetEye Satellite Requirements TCP and UDP Ports Requirements Additional Software Installation Introduction Single Node Cluster NetEye Master Master-Satellite Architecture Underlying Operating System Acquiring NetEye ISO Image Installing ISO Image Single Nodes and Satellites Cluster Nodes Configuration of Tenants Satellite Nodes Only Nodes behind a Proxy Additional NetEye Components Single Node Cluster Node Satellites Nodes only Verify if a module is running correctly Accessing the New Module Cluster Satellite Security Identity and Access Management External Identity Providers Configure federated LDAP/AD Emergency Reset of Keycloak Configuration Advanced Configuration Authorization Resources Tuning Advanced Topics Basic Concepts & Usage Advanced Topics Monitoring Environment Templates Monitored Objects Import Monitored Objects Data Fields Deployment Icinga 2 Agents Configuration Baskets Dashboard Monitoring Status VMD Permissions Notifications Jobs API Configuring Icinga Monitoring Retention Policy NetEye Self Monitoring 3b Concepts Collecting Events Add a Filter Node WHERE Conditions Iterating over Event fields Retrieving Payload of an Event Extract Variables Create a Rule Tornado Actions Test your Configuration Export and Import Configuration Example Under the hood Development Retry Strategy Configuration Thread Pool Configuration API Reference Configure a new Business Process Create your first Business Process Node Importing Processes Operators The ITOA Module Configuring User Permissions Telegraf Metrics in NetEye Telegraf Configuration Telegraf on Monitored Hosts Visualizing Dashboards Customizing Performance Graph The NetEye Geo Map Visualizer Map Viewer Configuring Geo Maps NagVis 3b Audit Log 3b Overview Shutdown Manager user Shutdown Manager GUI Shutdown Commands Advanced Topics Overview User Role Management Cube Use Cases ntopng and NetEye Integration Permissions Retention Advanced Topics Overview User Roles Nodes Test Cases Dashboard Use Cases Overview Architecture Authorization Elasticsearch Overview Enabling El Proxy Sending custom logs to El Proxy Configuration files Commands Elasticsearch Templates and Retentions El Proxy DLQ Blockchain Verification Handling Blockchain Corruptions El Proxy Metrics El Proxy Security El Proxy REST Endpoints Agents Logstash Elastic APM Elastic RUM Log Manager - Deprecated Overview Authorization in the Command Orchestrator Module Configuring CLI Commands Executing Commands Overview Permissions Installation Single Tenancy Multitenancy Communication through a Satellite Asset collection methods Display asset information in monitoring host page Overview Customers Availability Event Adjustment Outages Resource Advanced Topics Introduction Getting Started SATAYO Items Settings Managed Service Mitre Attack Coverage Changelog Before you start Update Procedure Single Node Upgrade from 4.41 to 4.42 Cluster Upgrade from 4.41 to 4.42 Satellite Upgrade from 4.41 to 4.42 DPO machine Upgrade from 4.41 to 4.42 Create a mirror of the RPM repository Sprint Releases Feature Troubleshooting Tornado Networking Service Management - Incident Response IT Operation Analytics - Telemetry Identity Provider (IdP) Configuration Introduction to NEP Getting Started with NEPs Online Resources Obtaining NEP Insights Available Packages Advanced Topics Upgrade to NetEye 4.31 Setup Configure swappiness Restarting Stopped Services Enable stack traces in web UI How to access standard logs Director does not deploy when services assigned to a host have the same name How to enable/disable debug logging Activate Debug Logging for Tornado Modules/Services do not start Sync Rule fails when trying to recreate Icinga object How to disable InfluxDB query logging Managing an Elasticsearch Cluster with a Full Disk Some logs are not indexed in Elasticsearch Elasticsearch is not functioning properly Reporting: Error when opening a report Debugging Logstash file input filter Bugfix Policy Reporting Vulnerabilities Glossary 3b

Create your first Business Process Node

A Business Process Node consists of a name, title, an operator and one or more child nodes. Each node can be a Root Node, a child node of other Business Process Nodes, or both. When you first create a Business Process, there are no nodes available, so you will be prompted to create one.

Configuring Your First Node

To create our first Business Process Node, click on the Add button. You will then see the node configuration form (an asterisk indicates a required field):

../../_images/add-new-node.png

Fig. 127 The Business Process node configuration form.

Configuring a Business Process requires filling in the following fields:

  • ID: The first setting is the identifier that must be unique across all nodes that will be defined. This identifier will be used within every URL and also within any Check Commands referring to this node by an Icinga Service Check.

  • Display Name: (Optional) As uniqueness sometimes leads to not-so-beautiful names, you can also specify a display title which will be used across all dashboards.

  • Operator: A Business Process’ operator defines its behavior, specifying how its own state will be calculated. It can be one of AND, OR, NOT, DEG or MIN.

  • Visualization: This describes when the node should be displayed. Since this node will be a root node, the form automatically suggests that you create a Toplevel Process. Alternatively, you could also create a Subprocess. As we are currently not adding this node to another node, that choice would lead to an Unbound Node that could be linked to later on.

  • Info URL: (Optional) You might also want to provide a link to additional information related to a specific process. This could be instructions with more technical details, or hints explaining what should happen if an outage occurs. You might not want to do so for every single node, but it might come in handy for your most important (e.g., top level or high priority) nodes.

Completed Business Process Node

That’s it, you are ready to submit the form. After clicking the green “Submit” button, you should see your first completed Business Process Node. A red notification as in Fig. 128 reminds you that your pending changes have not been stored yet.

../../_images/first-node-created.png

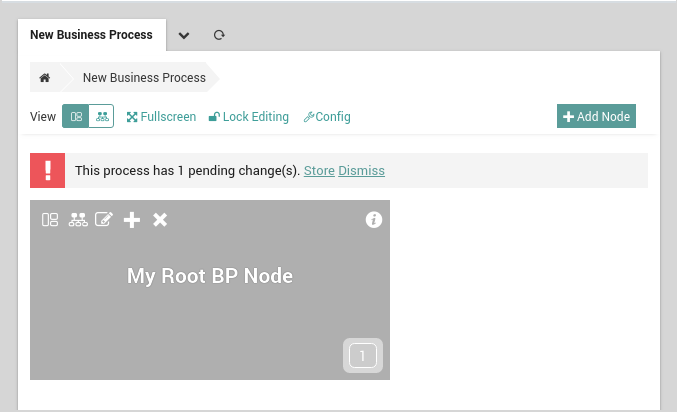
Fig. 128 The completed business process node, “My Root BP Node”.

You can now Store the Configuration as is, or move on to add additional nodes to continue your configuration. In the latter case, you will also need to select a Node type. This can be either:

  • Existing Process (Node): When you want to link this node to another node you have already created. Choose the appropriate existing node from the drop down list, then click the green “Submit” button. (Be sure not to link this node to itself.)

  • New Process Node: Here you can create a new, independent root-level node.

  • Host: When you have created the lowest level of intermediate nodes in your business process hierarchy, you can add the hosts that you would like to monitor as part of that business process.

  • Service: For each host in your business process hierarchy, you can specify particular services on the host that are part of the business process, and thus exclude other, irrelevant services on that host.

  • Hosts from filter: You can select one or more hosts in a single

    operation to be added to your business process, starting from a monitoring filter expression (e.g., host_name=*linux*).

  • Services from filter: You can select one or more services in a single

    operation to be added to your business process, starting from a monitoring filter expression (e.g., service_description=*disk*).

Note

While you can create Business Process nodes whenever you like, you cannot add Host and Service nodes until you have created the underlying hosts and services themselves. Thus you should complete that step before setting up your business process hierarchy.

To edit a node you have already created, click on the “Unlock” button and then choose the “Notepad” icon on the node you wish to change.

Note

The grey arrows below the Business Process title are breadcrumbs that show your current position. Their use is described in more detail in the official Business Process documentation.