Deprecated modules
Eventhandler
Warning
This module is deprecated, which means that it is no longer actively developed since NetEye 4.20 and no bug fixes will be delivered. Please consider switching to the new Tornado module.
The NetEye strategy for interpreting externally generated events received by the NetEye server is to allow user-defined matching rules and handlers to accurately use event sources and properties to determine how urgent an event is and then take the appropriate action.
Events can be Messages generated by various computer systems and devices. They do not need to be Windows or Linux Servers, but can also be Firewalls, Security devices, network devices or other kinds of embedded systems that are able to send notifications and alerts using one of the following communication channels:
SNMP Trap
Log message (Syslog protocol)
Email message
SMS
Remote Procedure Call, API call or script (sent via the EventConsole command)
Notifications are sent when a device or system encounters a pre-defined error or warning condition:

Fig. 114 The EventHandler module at a glance.
These incoming events can be accepted, filtered and classified by the EventHandler module. The EventHandler rules allow NetEye to classify the incoming event and decide whether to forward it to the EventConsole, raise an alert within Monitoring, or notify a person directly via Email or SMS.
Event messages are managed in the EventConsole of the EventHandler:
The EventConsole serves as a container for incoming Messages
It can receive Messages from:
The NetEye EventHandler (SNMP traps, Log messages, Email and SMS notifications)
Remote clients (e.g. Windows, Unix and Linux) via nesendmsg
It propagates warnings and critical messages (under the host name EventConsole)
Messages can be acknowledged to avoid further notifications
Messages can be closed
It enables the Monitoring notification and reporting logic
It can be used for:
Collecting batch script output
Finding event-triggered system notifications
Checking log files
The list is keyed on Host – Subject pairs
NetEye’s EventHandler allows you to configure automatic reactions to events coming from SNMP traps, email, SMS’s and logs. The EventHandler Dashboard (Fig. 115) and GUI provide a user-friendly way to configure these different actions.
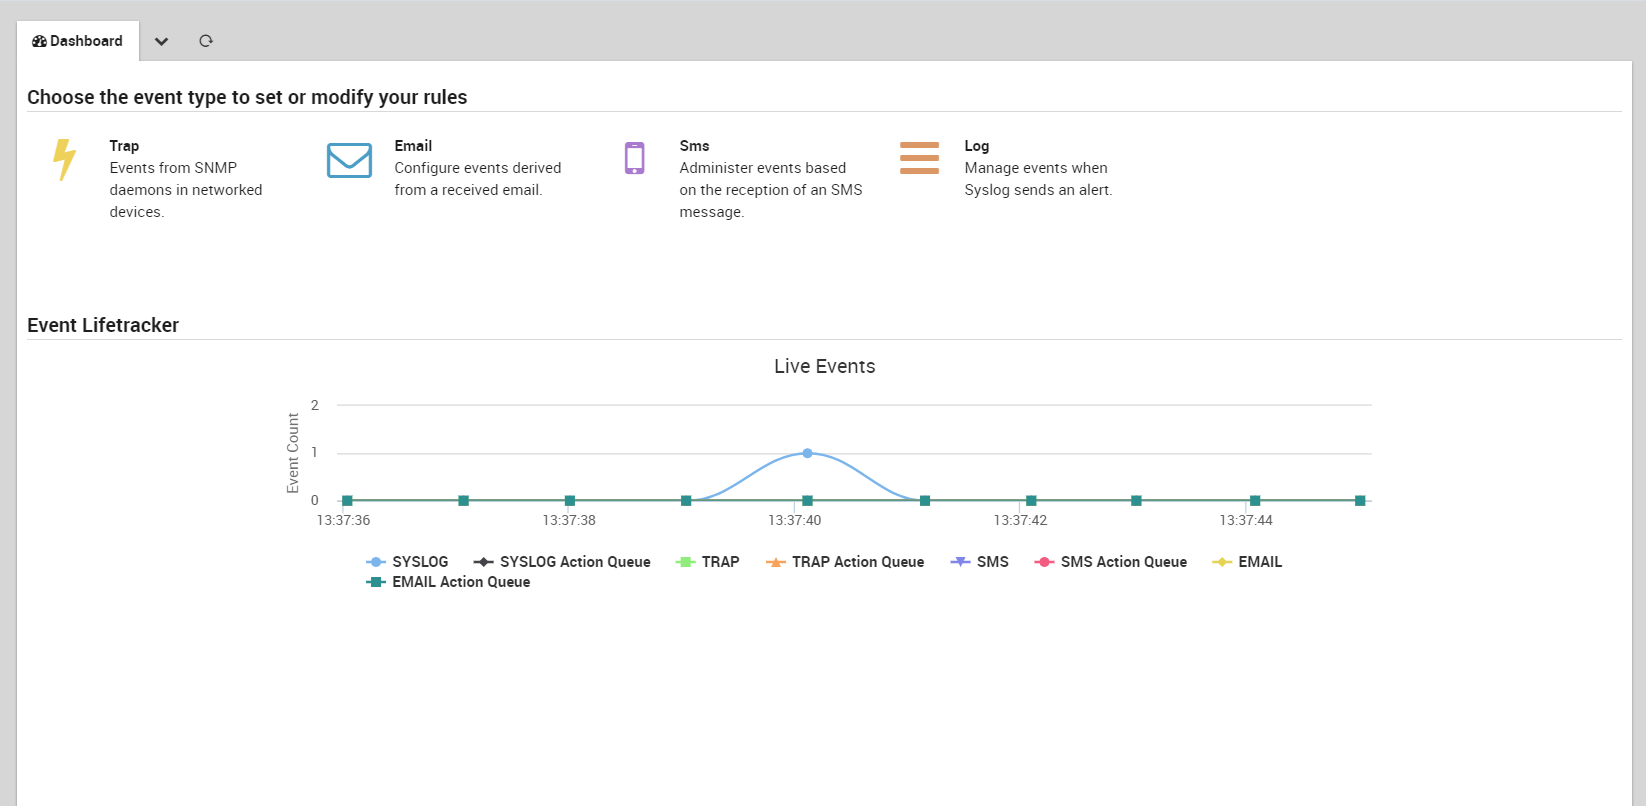
Fig. 115 The EventHandler Dashboard
Within this module you can define specific rules for any type of event. Once an event takes place, the rule-matching engine searches for predefined rules and takes the corresponding action. These actions can range from sending an email or SMS, to displaying the event within the EventConsole, to even ignoring it completely.
To access the EventHandler, simply click on “Event Handler” on the navigation bar at the left, then select the type of event source you want to configure rules for. Below the list of event type configuration options is the Event Lifetracker, which shows the quantity and type of events seen by the system in the last 30 seconds. When you use NetEye 4 for the first time, the Lifetracker will be empty because there are no rules yet defined that match with incoming events.
You can configure the EventHandler and its individual modules using the appropriate panel as shown in Fig. 116 by following this sequence from the left-side navigation bar: Configuration> Modules > eventhandler > Configuration tab.
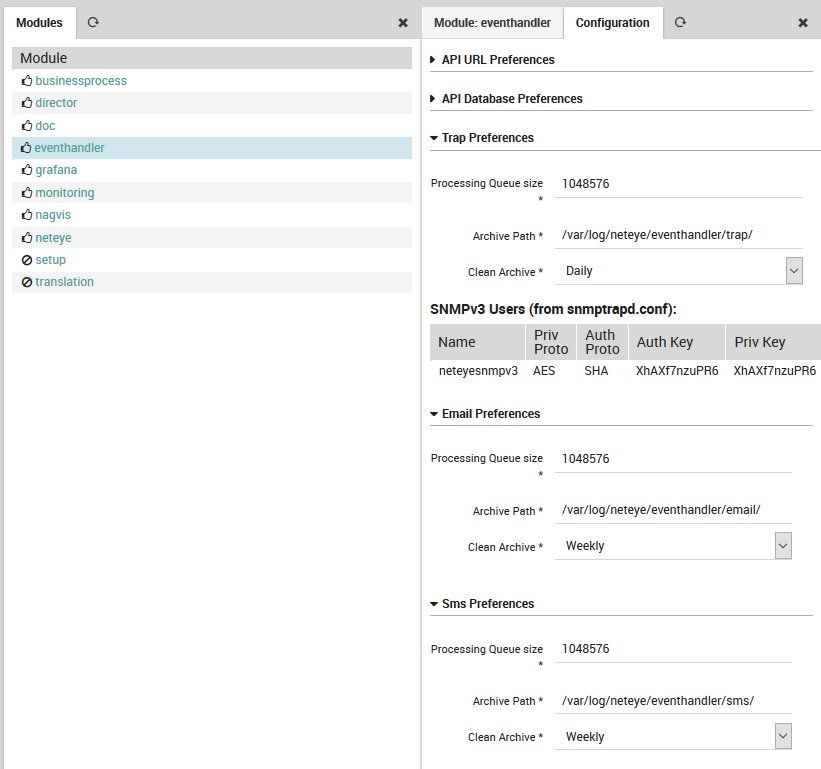
Fig. 116 EventHandler Configuration
Definition and Management of Rules
Clicking on one of the four event type configuration icons will open a new panel to the right with the appropriate tab already visible. For instance, Fig. 117 shows the Trap Handler rule list panel after clicking on the Trap icon in the EventHandler Dashboard. The panels for all four event types have the same interface for viewing the rules and changing their priorities, but different panels for the actual details of the rules.
Each rule in the list view is shown with its description, an action type, a regular expression that causes the rule to match an event, and Options for changing the rule’s priority relative to other rules. The rules are ordered from highest priority (top line of the first page of rules) to lowest priority (bottom line in the last page of rules).
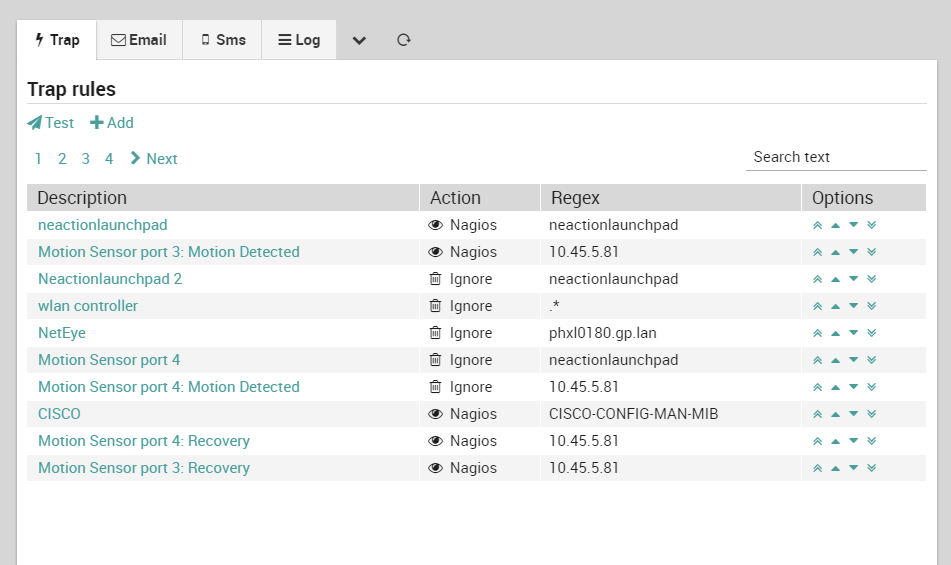
Fig. 117 Rules for the Trap Handler
Adding, Modifying and Copying Rules
From the EventHandler Dashboard, select the tab of the desired event type (Trap, Email, SMS or Log) and click the “+ Add” button. The “Add rule” panel will appear on the right.
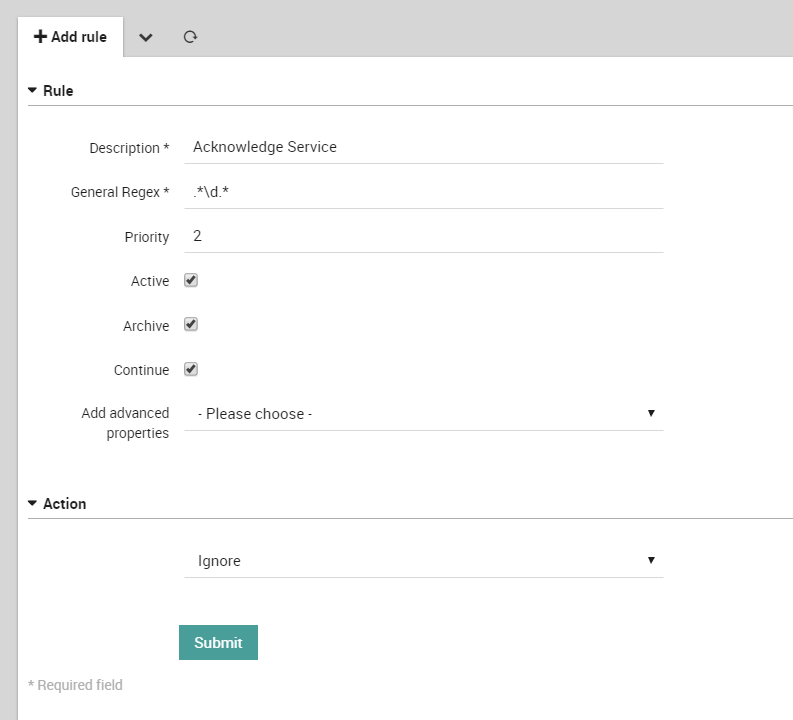
Fig. 118 Adding a new rule to the Trap Handler in the Details pane
Here you can set the attributes of the new rule, such as the event match expression in regular expression syntax.
At the bottom of the Rule subpanel you can select advanced properties. For instance, for trap rules you can define the Host IP, OID, etc., while for email rules you can select From, To, etc. For each property you select, a new field will appear below, allowing you to set values to match those fields.
If an incoming event matches the regular expression and other parameters you set in your new rule, and subject to higher priority rules having already matched it, then the action corresponding to that rule as defined in the Action subpanel below it will be carried out.
Depending on the type of action chosen in the Action panel, different attributes are available (for instance, for monitoring you can define the Host, Service, Status and Message). Some of these options use the drop down with custom field interface control to allow you to either select a pre-defined item/value, or enter a custom value that can include variables.
If you change one or more rule attributes and click on the green “Submit” button (Fig. 118), the new rule will be activated the next time that NetEye 4 restarts. To force all modified rules to be activated immediately, click on the “Commit Settings” menu item found in the “v” menu to the right of the panel title bar.
Rule Matching
For more complicated events where matching a regular expression in the input title is not sufficient, the EventHandler allows access to additional fields depending on the event type.
Constructing Trap Rule Matching Expressions with Built-In Variables
Placeholder |
Description |
|---|---|
@TRAPTXT@ |
The description related to the OID (object identifier) |
@TRAPOID@ |
The object identifier (OID) |
@TRAPDESC@ |
Trap description field of snmptranslate |
@TRAPSYSDESCR@ |
System description from trap itself |
@TIMESTAMP@ |
The Unix timestamp when the trap was received |
@TRAPHOST@ |
The host name that was extracted |
@TRAPTRANS@ |
Trap translate text of snmptranslate |
@TRAPALL@ |
All the trap content, in a single line |
@TRAPALLCR@ |
All the trap content, lines separated by carriage returns (CR) |
@TRAPALLNR@ |
All the trap content, single line, lines numbered |
@TRAPALLCRNR@ |
All the trap content, multi-line (CR) and numbered |
You can use several placeholders within one of the allowed input fields, and it is also possible to combine them with the following patterns:
Pattern definition
A trap handler pattern consists of an opening tag (\@) followed by a text constant that will always come before the matching string, an ‘@’ separator, a regular expression (e.g. “.*”, without the quotes), another @ separator, the text constant that comes afterwards, and finally the closing tag (i.e. \@).
Thus the syntax should look like this:
\@before@regex@after\@
where regex can be any Perl regular expression and before and after should normally be text constants.
Note: These patterns are not allowed in the regular expression input field.
Continue
By checking the continue option in the trap definition, the trap handler will not stop after the match but will instead continue and try to match additional trap handling rules (if any) within the table that have lower priority. In any event, the actions that the trap handler takes will be the same.
The NetEye Trap Handler also supports more specific and flexible rules in comparison to general regular expressions. By using the advanced rules of the Trap Handler frontend, the user can define a line-by-line matching of trap files. At the same time it is possible to set trap-specific user variables and placeholders. These variables can be used like the predefined variables in the Subject, Message, Host and Service fields.
For the advanced rule definition you can skip the “@” before and after the variable name, but within the above-mentioned fields it is required.
The advanced rules must all match (think of there being an AND between them), otherwise the rule will not match and the trap handler will proceed to the next definition. Of course, the (general) regular expression must also match, but you can for instance use “.*” to force an advanced rule check only.
It is also possible to specify several advanced rules for the same trap line.
Substring Access
To access a substring of an extracted string, indicate the desired position as follows:
@[VARNAME]_[1]@
where VARNAME is the name of the variable (second input field) and 1 is the position in the string.
A suitable regular expression for this usage would be for example:
LINE |
VARNAME |
REGULAR EXPRESSION |
|---|---|---|
8 |
myVar |
Problem.found for Host. |
In this example @myVar_0@ contains the full matched line, @myVar_1@ contains the substring that contains the problem description, and @myVar_2@ could contain some host information.
Tip: To avoid unexpected behavior you should not “override” the predefined variables (e.g. @TRAPHOST@) even though the system will allow it. It is also possible to specify “.*” for any line-matching rule, although in this case you should set a variable such that the data will be extracted. You can also omit the variable name, which implies that this rule serves only as a filter.
Actions
As described above, the Action subpanel allows you to select the type of action to perform if the rule above it is successfully matched. The fields that are visible depend on the type of action selected. For instance, if the “Ignore” action is selected then no fields will be shown, while if “Email” is selected as in Fig. 119, you will see the appropriate fields such as “To” and “From”.
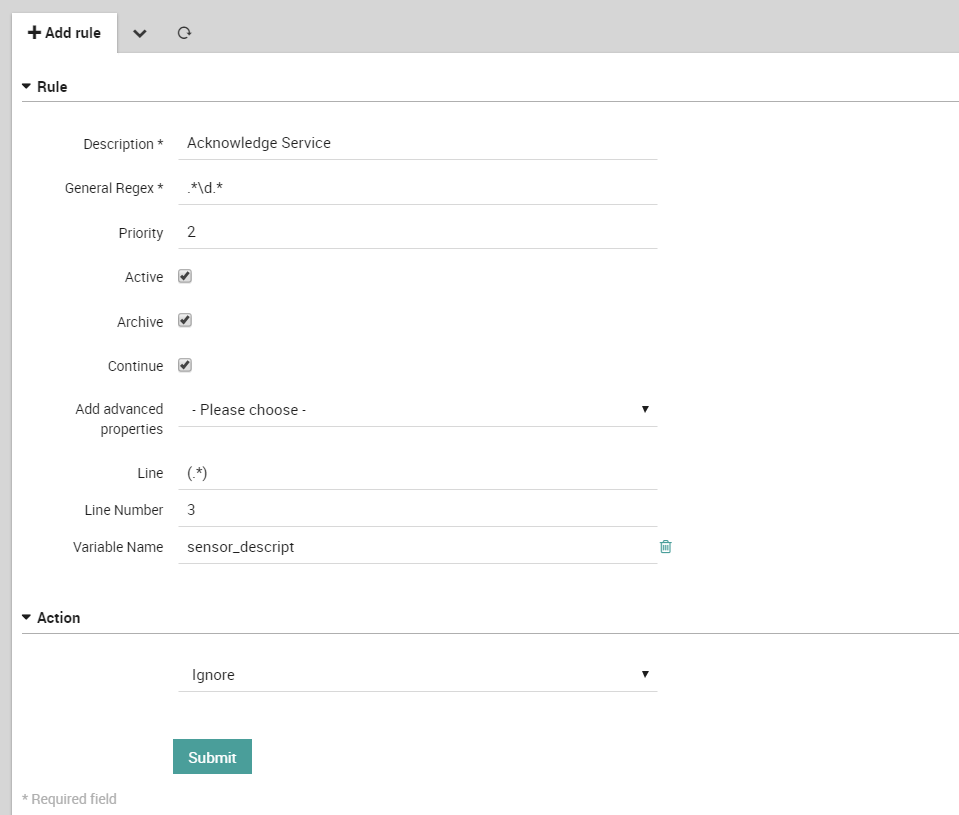
Fig. 119 The action panel for an EventHandler rule
You can use “extracted variables” inside each parameter definition.
Extracted Variables
If you have used the test panel to find rules that match an event, you can use the “Extracted Variables” pane to see the values that variables had during the matching process for a particular rule. These variables include both original values from the event as well as values computed during the matching process.
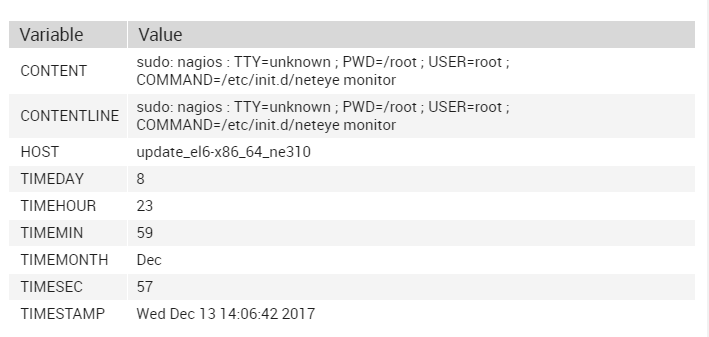
Fig. 120 The Extracted Variables panel showing names and values of variables regarding a particular event.
Within the “Extracted Variables” pane, all variables are reported. The set of default variables, as well as the additional variables, deriving from the definition of the rule attributes are displayed.
The Rule Testing Panel
The “Test” panel can be opened by clicking on the “Test” button ( ) under the panel title. The “Test Area” panel will then appear on the right side as in Fig. 122.

Fig. 121 The EventHandler Test panel
To test a particular event against the rules, put some event text into the text area labeled “Content” and click on the green “Test” button below it. This will allow you to see the flow of rules in the main panel as the EventHandler attempts to match them to your event.

Fig. 122 Colors showing which rules matched the incoming test message.
In the grid there are three colors:
Red: The rule did not match
Orange: The rule partially matched
Green: The rule fully matched
When you click on the row you are interested in, the details panel on your right hand side will appear (if not, simply press on the collapsed box to open it). Here you can visualize which specific fields/attributes did match (green), partially matched (orange), and did not match (red) as shown in the Details panel in Fig. 122.
Testing Rules From Archived Events
In addition to manually entering free-form text for an event in the Content panel, you can also use the Archive tab in the Test panel to select a real historical event from a log archive. Clicking on a day, and then on an event for that day, will transfer that event text into the Content panel, and you can then press the “Test” button as above.
In the Options section, you can select which types of rules to show in the main panel for following the matching process: (1) only the rules that matched, (2) the flow of matching rules, or (3) all rules. If you set the “Execute action(s)” flag, the defined action will be executed, even if it is a historical event.
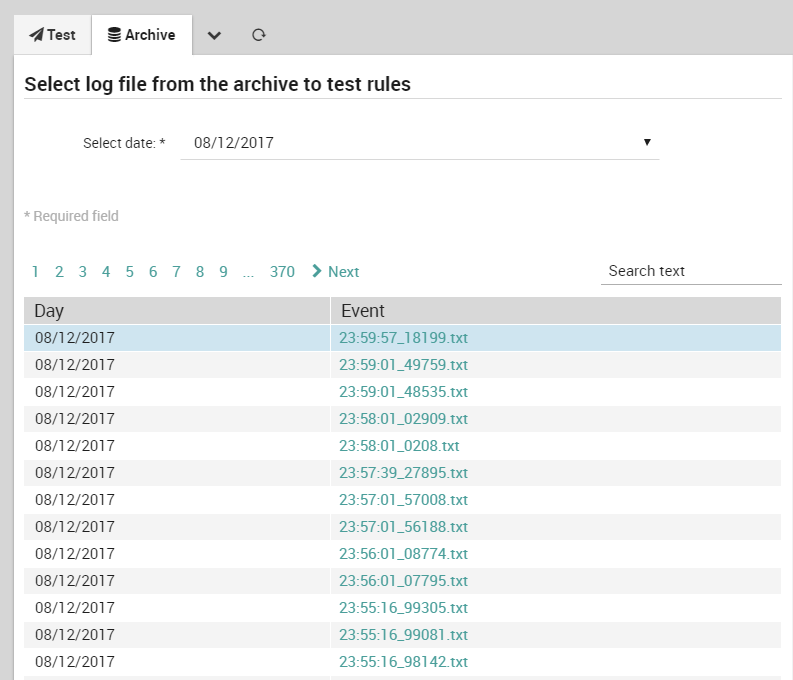
Fig. 123 The Archive tab of the Testing pane.
Network interfaces monitoring
Warning
This module is deprecated.
Service Checks Information
Network Interface Table Service Check
Warning
Please, note that Interface Table module may be exploited by an authenticated user for accessing/executing files on the file system. When Interface Table Service Check is installed, a management network with restricted access is encouraged.
Please note that a new version which overcomes the security problems has been planned in the next releases.
Interfacetable_v3t is an addon that allows you to monitor the network interfaces of a node (e.g. router, switch, server) without knowing each interface in detail.
For additional information see the the official documentation.
Installation
# dnf install --enablerepo=neteye-extras icingaweb2-module-interfacetable icingaweb2-module-interfacetable-autosetup
# neteye_secure_install
Configuration
The module is enabled as soon as the neteye_secure_install
is executed, but a new command must be configured before it can be
used for configuring a service check. Navigate to Director > Commands to create the command as depicted in
Fig. 124, which shows the three fields
that must be configured:
Command type: Must be set to Plugin Check Command
Command name: The name of the command which will be used to configure a Service
Command: The path to the script executed by the command:
/usr/lib64/neteye/monitoring/plugins/check_interface_table_v3t.pl
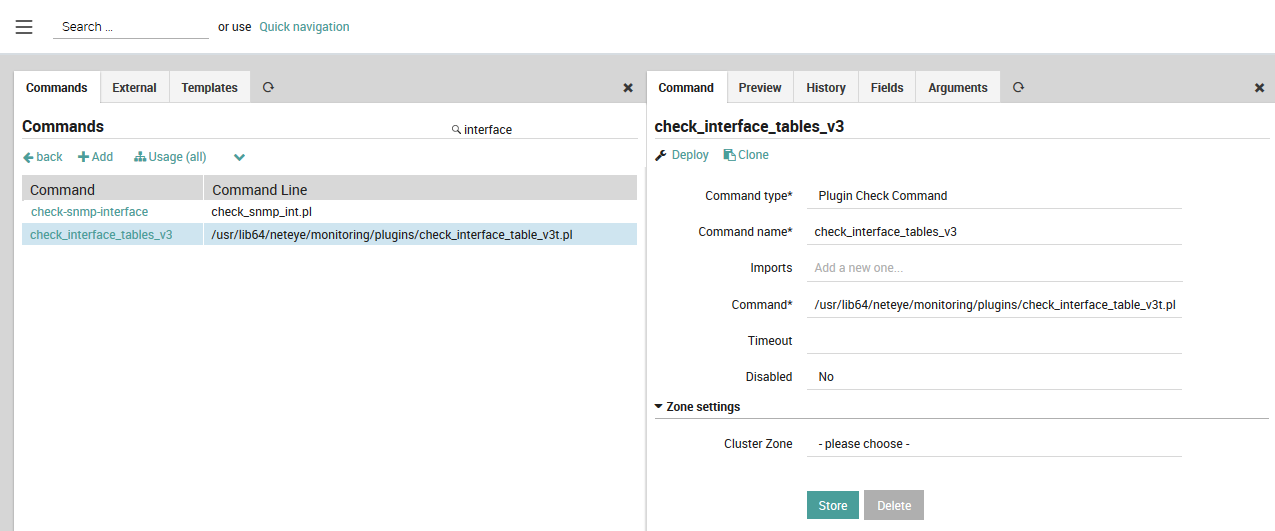
Fig. 124 Add Interface Table command
After deploying the command you just created, you must configure the Arguments. Click on the command name in the Commands section of Director, go to the Arguments tab and add the Arguments:
Argument name |
Value |
|---|---|
-H |
$host.name$ |
-C |
Specify the snmp v1/v2c community string (e.g., wuerthphoenix) |
-t |
Specify global plugin timeout |
Fig. 125 shows the resulting Arguments panel

Fig. 125 Result after adding arguments

