Advanced Topics
In this section we deal with some advanced topic, including passive monitoring, jobs, API, and Icinga Retention Policy.
Passive monitoring
When Tornado is installed, NetEye creates an Icinga Web 2 user
neteye-tornado and an associated Icinga Web 2 role
neteye_tornado_director_apis, which only gives access to the module
Director, with limited authorizations on the actions that Tornado can
perform.
Warning
These user and permission are required by the backend, for Tornado to call the Director API–and in particular for the authentication and authorization of the Tornado Director Executor to the APIs of the Icinga Director. Therefore neither the user, nor the associated role must be removed from the system.
In case you need it, for example to reconfigure the Tornado Director
Executor, the password for the user neteye-tornado is stored in the
file /root/.pwd_icingaweb2_neteye_tornado.
Processing Tree
Within the NetEye interface you can view the Tornado rule configuration graphically instead of in a command shell. The Configuration Viewer (available when click on Tornado in the left side menu) shows the processing tree in a top-down format, allowing you to verify that the structure of the rules you have created is as you intended.
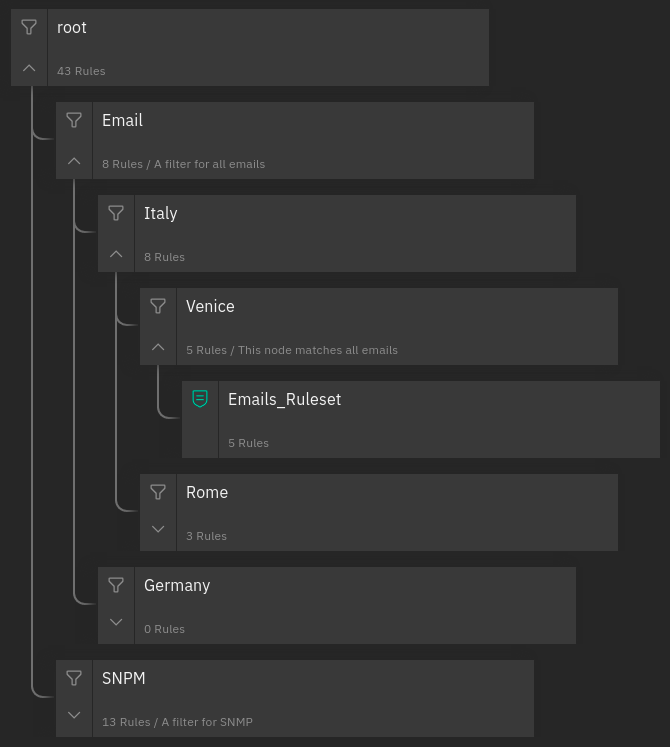
Fig. 106 A processing tree
Definitions
While a more complete description of all Tornado elements is available in the official documentation, they are summarized in enough detail here so that you can understanding this page without reading the full official documentation.
Filter: A node in the processing tree that contains (1) a filter definition and (2) a set of child nodes, each of which corresponds to a condition in the filter definition. You can use a Filter to create independent pipelines for different types of events, reducing the amount of time needed to process them.
Implicit Filter: If a filter is not present in a node, a default filter is created which forwards an event to ALL child nodes, rather than a particular one that matched a filter condition.
Ruleset: A leaf node that contains multiple rules to be matched against the event one by one once the filters in the parent nodes have let an event through.
Rule: A single rule within a Ruleset, which can be matched against an event.
Processing Tree: The entire set of filters and rules that creates the hierarchical structure where events are filtered and then matched against one or more rules.
Basic Configuration Information
The location of configuration files in the file system is pre-configured in NetEye. NetEye automatically starts Tornado as follows:
Reads the configuration from the /neteye/shared/tornado/conf/ directory
Starts the Tornado Engine
Searches for Filter and Rule definitions in /neteye/shared/tornado/conf/rules.d/
The structure of this last directory reflects the Processing Tree structure. Each subdirectory can contain either:
A Filter and a set of sub directories corresponding to the Filter’s children
A Ruleset
Each individual Rule or Filter to be included in the processing tree must be in its own file, in JSON format (Tornado will ignore all other file types). For instance, consider this directory structure:
/tornado/config/rules
                 |- node_0
                 |    |- 0001_rule_one.json
                 |    \- 0010_rule_two.json
                 |- node_1
                 |    |- inner_node
                 |    |    \- 0001_rule_one.json
                 |    \- filter_two.json
                 \- filter_one.json
In this example, the processing tree is organized as follows:
The root node is a filter named “filter_one”.
The filter filter_one* has two child nodes: node_0 and node_1.
node_0 is a Ruleset that contains two rules called rule_one and rule_two, with an implicit filter that forwards all incoming events to both of its child rules.
node_1 is a filter with a single child named “inner_node”. Its filter filter_two determines which incoming events are passed to its child node.
inner_node is a Ruleset with a single rule called rule_one.
Within a Ruleset, the alphanumeric order of the file names determines the execution order. The rule filename is composed of two parts separated by the first ‘*’ (underscore) symbol. The first part determines the rule execution order, and the second is the rule name. For example:
0001_rule_one.json -> 0001 determines the execution order, “rule_one” is the rule name
0010_rule_two.json -> 0010 determines the execution order, “rule_two” is the rule name
Rule names must be unique within their own Ruleset. There are no constraints on rule names in different Rulesets.
Similar to what happens for Rules, Filter names are also derived from the filenames. However, in this case, the entire filename corresponds to the Filter name.
In the example above, the “filter_one” node is the entry point of the processing tree. When an Event arrives, the Matcher will evaluate whether it matches the filter condition, and will pass the Event to one (or more) of the filter’s children. Otherwise it will ignore it.
A node’s children are processed independently. Thus node_0 and node_1 will be processed in isolation and each of them will be unaware of the existence and outcome of the other. This process logic is applied recursively to every node.
Multi Tenancy Roles Configuration
If your NetEye installation is tenant aware, roles associated to each user must be configured to limit their access only the processing trees they are allowed to.
In the NetEye roles (), add or edit the role
related to the tenant limited users. In the detail of the role configuration you can
find the tornadocarbon module section. You can set the tenant ID in the
tornadocarbon/tenant_id restriction.
Hint
You can find the list of available Tenant IDs by reading the directory
names in /etc/neteye-satellites.d/. You can use this command:
# basename -a $(ls -d /etc/neteye-satellite.d/*/)
Structure of a Filter
A Filter contains these properties, defined in its JSON file:
Name: The filter name
Active: A boolean value; if false, the filter’s children will be ignored
Description: A string value providing a high-level description of the filter
Where tab: An operator that, when applied to an event, returns true or false. The result determines how an Event will be processed by the filter’s inner nodes.
When the configuration is read from the file system, the filter name is automatically inferred from the filename by removing its ‘.json’ extension. It can be composed only of letters, numbers and the “_” (underscore) character.
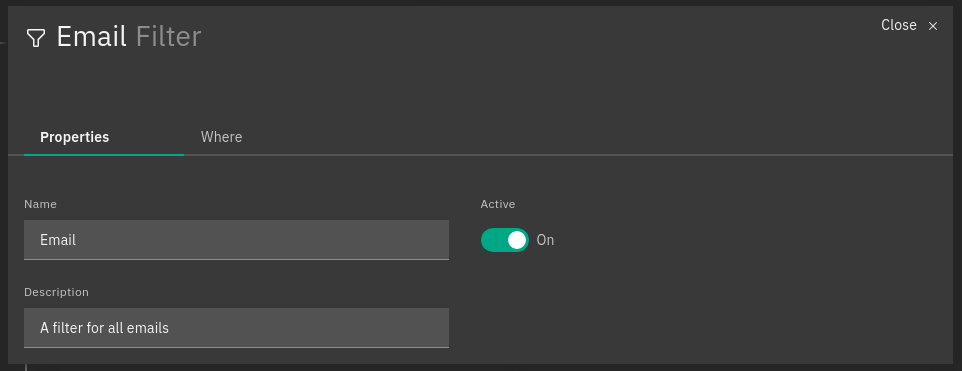
Fig. 107 A sample filter
Interface Overview
In today’s world, the UX has become a key point in successful IT products and NetEye wants it to become one of its strongest features, providing a continuously improved GUI to support the users’s daily activities.
For this purpose, NetEye provides a totally redesigned, modern looking and attractive GUI for Tornado, based on solid design and usability guidelines defined by the Carbon Design System
While the new GUI is developed to completely replace the current UI, it is currently in preview and only some features are supported such as processing tree visualization, event-driven testing and multi-tenancy.
The Graphical User Interface allows you to explore the current configuration of your Tornado Instance. The GUI has two main views. The first one is the Processing Tree View; this one allows you to examine the entire configuration processing tree of Tornado and to modify the configuration–please refer to the next section for more information. The second view, the Ruleset View, can be reached by clicking on whatever node is displayed in the Processing Tree View; from here, you can access the details of each Rule, send Events to Tornado, inspect the outcome of the Event execution, and modify the rules. In this view the information is organized into a table where each row represents a specific Rule.
In the Ruleset View, an Event Test panel is available to send simulated Events. These Events, can be created through a dedicated form and are composed by the following four fields:
Event type: the type of the Event, such as trap, sms, email, etc.
Creation time: the Event timestamp defined as an epoch in milliseconds
Tenant ID: The tenant ID that will be added to the event. Fill this field if there are filters or conditions related to the tenant ID, otherwise just leave it empty.
Enable execution of actions: whether the actions of matching rules have to be executed or skipped
Payload: the event payload in JSON format
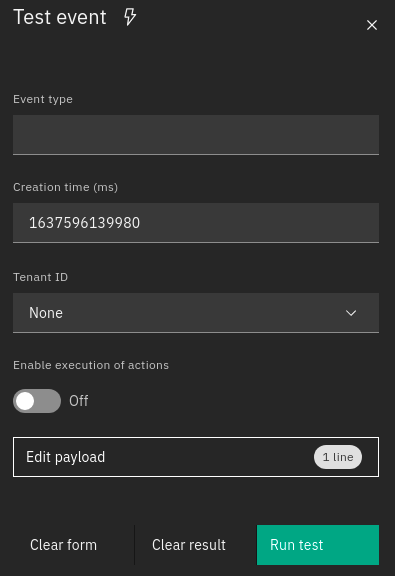
Fig. 109 Test window
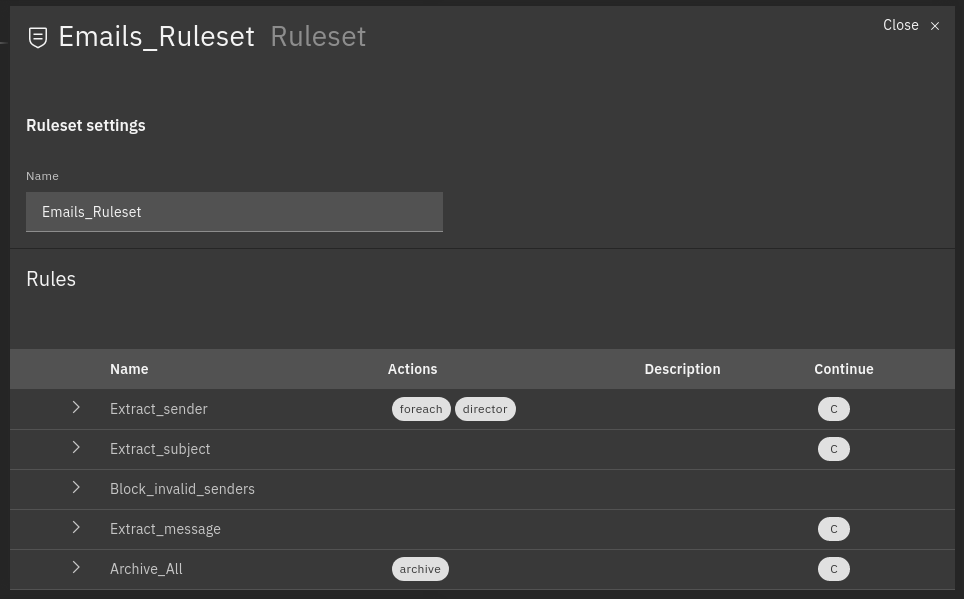
When a test is executed by clicking the “Run Test” button, the linked Event is sent to Tornado and the outcome of the operation will be reported in the rule table.
At this point, a rule can be in one of the following states:
matched: If a rule matched the Eventstopped: If a rule matched the Event and then stopped the execution flow. This happens if thecontinueflag of the rule is set to falsepartially matched: If the where condition of the Rule was matched but it was not possible to process the required extracted variablesnot matched: If the Rule did not match the Event
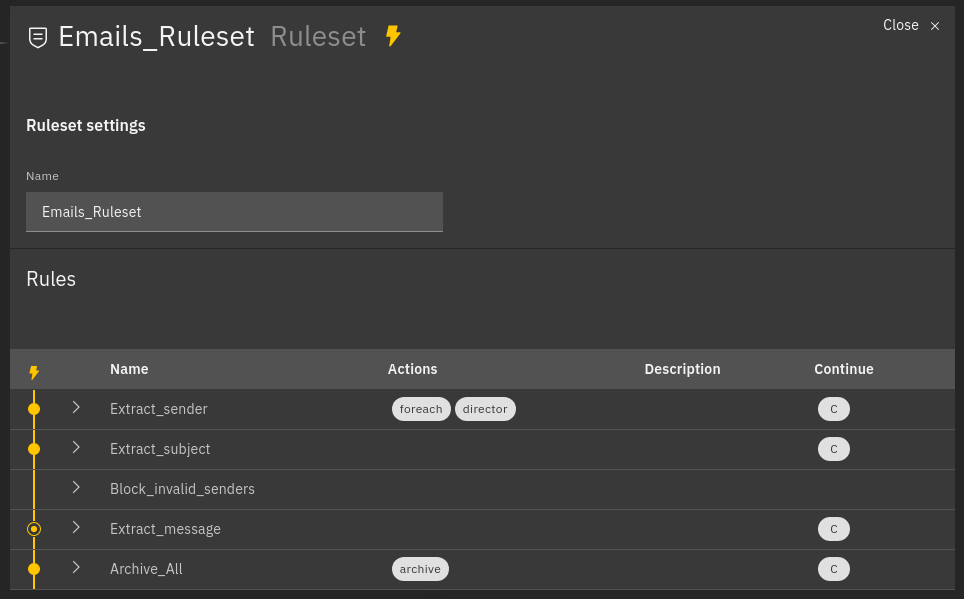
Fig. 110 Example of processed rules
Matched rules: Extract_sender, Extract_subject, Archive_all
Partially matched: Extract_message
Not matched: Block_invalid_senders
For each rule in the table, the extracted variables and the generated Action payloads are shown. In addition, all these extracted variables are also shown in the Event Test form.
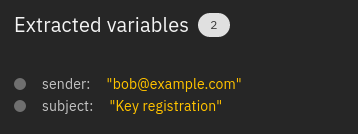
Fig. 111 Sample of extracted variables
Two other buttons are visible, one for cleaning all the fields of the form and one for cleaning the outcome of the test.
Tornado Processing Tree Editor
The Tornado GUI provides an edit mode that allows to modify the configuration of the Tornado rules’ processing tree directly from NetEye’s front-end. Rules must be written in JSON and the editor features a validator, that helps you checking that the rule is syntactically correct. If you are not acquainted with JSON, you can check one of the following tutorials:
Two important principles have been used for the development of the edit mode and must be understood and taken into account when modifying Tornado’s configuration, especially because these differ from other modules in Icinga Director:
Implicit Lock Mode. Only one user at a time can modify the processing tree configuration. This prevents multiple users from changing the configuration simultaneously, which might lead to unwanted results and possibly to Tornado not working correctly due to incomplete or wrong configuration. When a user is editing the configuration, the actual, running configuration is left untouched: it continues to be operative and accepts incoming data to be processed.
Edit Mode. When starting to modify the configuration, Tornado will continue to work with the existing configuration–thanks to the implicit lock mode, while the new changes are saved in a separate draft configuration. The new configuration then must be deployed to become operative.
Note
If the user logs out without deploying the draft, the next
user that will log in–and start modifying tornado’s
configuration–will have different possibilities: to check all the
changes present in the draft by clicking on the Show Changes
button and to continue editing and then deploying the draft, or to
discard completely the existent draft and star editing a new
one. Once the user deployed the changes, the action will be
recorded in the Auditlog module (System > Auditlog). Here a
detailed diff of what has been changed, together with the user who
deployed those changes and the timestamp is displayed.
This mode has other positive side effects: one does not need to complete the changes in one session, but can stop and then continue at a later point; another user can pick up the draft and complete it; in case of a disaster (like e.g., the abrupt end of the HTTPS connection to the GUI) it is possible to resume the draft from the point where it was left.
Warning
Only one draft at a time is allowed; that is, editing of multiple draft is not supported!
When a user enters the edit mode, a new draft is created on the fly if none is present, which will be an exact copy of the running Tornado configuration. If not present in the draft, a root node of type Filter will be automatically added to the draft.
To check for the correctness of a Draft, without impacting the deployed configuration, it is possible to open the test window also while in Edit Mode. The event will be processed using the Draft and the result will be displayed, while keeping the existing configuration running.
In order to modify the processing tree, you can add nodes to each level of the processing tree, as well as inspecting and modifying each single rule. Moreover, from the main view it is also possible to add new filters or rulesets to the processing tree by clicking on the buttons on the right-hand side of the GUI.
In more details, the processing tree is shown in the main area of the GUI. The top filter node (nodes are containers of rules, please check the Definition in previous section for details) is the root one and therefore the first to be processed. Additional levels below contain further blocks with additional nodes, to allow for multiple processing of the events. Depending on the Edit mode being active or not, different interactions are possible with the processing tree.
When the Edit mode is disabled, the elements composing the Processing tree (Filters and rulesets) are shown in hierarchy. When clicking on a filter, its children–which can be other filters or rulesets–are shown; while a click on a ruleset will open the Rule Editor, to allow editing of the rules–refer to the next section for more information.
When clicking on Edit mode, it is possible to add new blocks in the processing tree or move them in other level. Using the buttons on the right-hand side of the Editor, new rulesets or filters can be added and placed within the hierarchy. For each node. it is possible to define:
a name and a description
its place in the hierarchy, by providing the name of the parent node
For a filter, these two more options are available.
whether it is active or not
the filter that should match the event. Syntax for the filter is JSON-based, and examples can be found in the various How-tos present in the tornado section of the User Guide.
Moreover, in Edit mode, in each box tree dots appear that when clicked, will open a small menu with two or three icons at the bottom of the box: Option are to edit or delete the ruleset or the filter, with the additional option, for ruleset only, to list rules:a click on the icon will open the rule GUI for editing the single rule of the ruleset.
Tornado Rule Editor
The tornado Rule Editor allows to manage the single rules that are in a ruleset. On top of the window, all the parents of the current ruleset are shown, to allow you to quickly check on which leaf of the processing tree the rules shown are located. Like in the processing tree editor, a JSON validator assists you in checking that the syntax of the rules is correct.
In the main area, all the defined rules are shown, together with a number of information about them: name, action, and status (enabled or not).
Like in the Processing Tree Editor, available options differ depending whether the Edit mode is active or not:
When the Edit mode is not active, it is possible to click on the
Open test window button on the top right-hand side of the window to
check which events the current rule selection would match.
With active Edit mode, the Open test window button is disabled,
but new rules can be added, modified, or deleted; each rule can also can
be moved along the list with a simple drag and drop.
Import and Export Configuration
The Tornado GUI provides multiple ways to import and export the whole configuration or just a subset of it.
Export Configuration
You have three possibilities to export Tornado configuration or part of it:
entire configuration: select the root node from the Processing Tree View and click on the export button to download the entire configuration
a node (either a ruleset or a filter): select the node from the Processing Tree View and click on the export button to download the node and its sub-nodes
a single rule: navigate to the rules table, select a rule, and click on the export button
Hint
You can backup and download Tornado configuration by exporting the entire configuration.
Import Configuration
You can use the import feature to upload to NetEye a previously downloaded configuration, new custom rules, or even the configuration from another NetEye instance.
When clicking on the import button a popup will appear with the following fields:
Node File: the file containing the configuration
Note
When importing a single rule the field will be labeled as Rule File.
Replace whole configuration?: If selected, the imported configuration will replace the root node and all of its sub-nodes.
Hint
You can restore a previous Tornado configuration by selecting this option.
Parent Node: The parent node where to add the imported configuration, by default it is set to the currently selected node.
Note
When a node or a rule with the same name of an already existing one is imported, the name of the new node/rule will be suffixed with _imported.
JMESPath Collector
This is a Collector that receives an input in JSON format and allows the creation of Events using the JMESPath JSON query language.
Email Collector
The Email Collector receives a MIME email message as input, parses it, and produces a Tornado Event.
How It Works
When the Email Collector receives a valid MIME email message as input, it parses it and produces a Tornado Event with the extracted data.
For example, given the following input:
Subject: This is a test email
Content-Type: multipart/alternative; boundary=foobar
Date: Sun, 02 Oct 2016 07:06:22 -0700 (PDT)

--foobar
Content-Type: text/plain; charset=utf-8
Content-Transfer-Encoding: quoted-printable

This is the plaintext version, in utf-8. Proof by Euro: =E2=82=AC
--foobar
Content-Type: text/html
Content-Transfer-Encoding: base64

PGh0bWw+PGJvZHk+VGhpcyBpcyB0aGUgPGI+SFRNTDwvYj4gdmVyc2lvbiwgaW4g
dXMtYXNjaWkuIFByb29mIGJ5IEV1cm86ICZldXJvOzwvYm9keT48L2h0bWw+Cg==
--foobar--
it will generate this Event:
{
  "type": "email",
  "created_ms": 1554130814854,
  "payload": {
    "date": 1475417182,
    "subject": "This is a test email",
    "to": "",
    "from": "",
    "cc": "",
    "body": "This is the plaintext version, in utf-8. Proof by Euro: €",
    "attachments": []
  }
}
If there are attachments, then attachments that are text files will be in plain text, otherwise they will be encoded in base64.
For example, passing this email with attachments:
From: "Francesco" <francesco@example.com>
Subject: Test for Mail collector - with attachments
To: "Benjamin" <benjamin@example.com>,
 francesco <francesco@example.com>
Cc: thomas@example.com, francesco@example.com
Date: Sun, 02 Oct 2016 07:06:22 -0700 (PDT)
MIME-Version: 1.0
Content-Type: multipart/mixed;
 boundary="------------E5401F4DD68F2F7A872C2A83"
Content-Language: en-US

This is a multi-part message in MIME format.
--------------E5401F4DD68F2F7A872C2A83
Content-Type: text/html; charset=utf-8
Content-Transfer-Encoding: 7bit

<html>Test for Mail collector with attachments</html>

--------------E5401F4DD68F2F7A872C2A83
Content-Type: application/pdf;
 name="sample.pdf"
Content-Transfer-Encoding: base64
Content-Disposition: attachment;
 filename="sample.pdf"

JVBERi0xLjMNCiXi48/TDQoNCjEgMCBvYmoNCjw8DQovVHlwZSAvQ2F0YWxvZw0KT0YNCg==

--------------E5401F4DD68F2F7A872C2A83
Content-Type: text/plain; charset=UTF-8;
 name="sample.txt"
Content-Transfer-Encoding: base64
Content-Disposition: attachment;
 filename="sample.txt"

dHh0IGZpbGUgY29udGV4dCBmb3IgZW1haWwgY29sbGVjdG9yCjEyMzQ1Njc4OTA5ODc2NTQz
MjEK
--------------E5401F4DD68F2F7A872C2A83--
will generate this Event:
{
  "type": "email",
  "created_ms": 1554130814854,
  "payload": {
    "date": 1475417182,
    "subject": "Test for Mail collector - with attachments",
    "to": "\"Benjamin\" <benjamin@example.com>, francesco <francesco@example.com>",
    "from": "\"Francesco\" <francesco@example.com>",
    "cc": "thomas@example.com, francesco@example.com",
    "body": "<html>Test for Mail collector with attachments</html>",
    "attachments": [
      {
        "filename": "sample.pdf",
        "mime_type": "application/pdf",
        "encoding": "base64",
        "content": "JVBERi0xLjMNCiXi48/TDQoNCjEgMCBvYmoNCjw8DQovVHlwZSAvQ2F0YWxvZw0KT0YNCg=="
      },
      {
        "filename": "sample.txt",
        "mime_type": "text/plain",
        "encoding": "plaintext",
        "content": "txt file context for email collector\n1234567890987654321\n"
      }
    ]
  }
}
Within the Tornado Event, the filename and mime_type properties of each attachment are the values extracted from the incoming email.
Instead, the encoding property refers to how the content is encoded in the Event itself. It can be one of two types:
plaintext: The content is included in plain text
base64: The content is encoded in base64
Particular cases
The email collector follows these rules to generate the Tornado Event:
If more than one body is present in the email or its subparts, the first valid body found is used, while the others will be ignored
Content Dispositions different from Inline and Attachment are ignored
Content Dispositions of type Inline are processed only if the content type is text/*
The email subparts are not scanned recursively, thus only the subparts at the root level are evaluated
Tornado Email Collector (Executable)
The Email Collector Executable binary is an executable that generates Tornado Events from MIME email inputs.
How It Works
The Email Collector Executable is built on actix.
On startup, it creates a UDS socket where qit listens for incoming email messages. Each email published on the socket is processed by the embedded Email Collector to produce Tornado Events which are, finally, forwarded to the Tornado Engine’s TCP address.
The UDS socket is created with the same user and group as the tornado_email_collector process, with permissions set to 770 (read, write and execute for both the user and the group).
Each client that needs to write an email message to the socket should close the connection as soon as it completes its action. In fact, the Email Collector Executable will not even start processing that email until it receives an EOF signal. Only one email per connection is allowed.
Procmail Example
This client behavior can be obtained, for instance, by using procmail with the following configuration:
## .procmailrc file
MAILDIR=$HOME/Mail                 # You should make sure this exists
LOGFILE=$MAILDIR/procmail.log

# This is where we ask procmail to write to our UDS socket.
SHELL=/bin/sh
:0
| /usr/bin/socat - /var/run/tornado_email_collector/email.sock 2>&1
A precondition for procmail to work is that the mail server in use must be properly configured to notify procmail whenever it receives new email.
For additional information about how incoming email is processed and the structure of the generated Event, check the documentation specific to the embedded Email Collector.
Note that the Email Collector will support any email client that works with the MIME format and UDS sockets.
Tornado Rsyslog Collector (executable)
The rsyslog Collector binary is an executable that generates Tornado Events from rsyslog inputs.
How It Works
This Collector is meant to be integrated with rsyslog’s own logging through the omprog module. Consequently, it is never started manually, but instead will be started, and managed, directly by rsyslog itself.
Here is an example rsyslog configuration template that pipes logs to the rsyslog-collector (the parameters are explained below):
module(load="omprog")

action(type="omprog"
       binary="/path/to/tornado_rsyslog_collector --some-collector-options")
An example of a fully instantiated startup setup is:
module(load="omprog")

action(type="omprog"
       binary="/path/to/rsyslog_collector --config-dir=/tornado-rsyslog-collector/config --tornado-event-socket-ip=tornado_server_ip --tornado-event-socket-port=4747")
Note that all parameters for the binary option must be on the same line. You will need to place this configuration in a file in your rsyslog directory, for instance:
/etc/rsyslog.d/tornado.conf
In this example the collector will:
Reads the configuration from the /tornado-rsyslog-collector/config directory
Write outgoing Events to the TCP socket at tornado_server_ip:4747
The Collector will need to be run in parallel with the Tornado engine before any events will be processed, for example:
/opt/tornado/bin/tornado --tornado-event-socket-ip=tornado_server_ip
Under this configuration, rsyslog is in charge of starting the collector when needed and piping the incoming logs to it. As the last stage, the Tornado Events generated by the collector are forwarded to the Tornado Engine’s TCP socket.
This integration strategy is the best option for supporting high performance given massive amounts of log data.
Because the collector expects the input to be in JSON format, rsyslog should be pre-configured to properly pipe its inputs in this form.
Tornado Webhook Collector (executable)
The Webhook Collector is a standalone HTTP server that listens for REST calls from a generic webhook, generates Tornado Events from the webhook JSON body, and sends them to the Tornado Engine.
How It Works
The webhook collector executable is an HTTP server built on actix-web.
On startup, it creates a dedicated REST endpoint for each configured webhook. Calls received by an endpoint are processed by the embedded JMESPath Collector that uses them to produce Tornado Events. In the final step, the Events are forwarded to the Tornado Engine through the configured connection type.
For each webhook, you must provide three values in order to successfully create an endpoint:
id: The webhook identifier. This will determine the path of the endpoint; it must be unique per webhook.
token: A security token that the webhook issuer has to include in the URL as part of the query string (see the example at the bottom of this page for details). If the token provided by the issuer is missing or does not match the one owned by the collector, then the call will be rejected and an HTTP 401 code (UNAUTHORIZED) will be returned.
collector_config: The transformation logic that converts a webhook JSON object into a Tornado Event. It consists of a JMESPath collector configuration as described in its specific documentation.
Tornado Nats JSON Collector (executable)
The Nats JSON Collector is a standalone collector that listens for JSON messages on Nats topics, generates Tornado Events, and sends them to the Tornado Engine.
How It Works
The Nats JSON collector executable is built on actix.
On startup, it connects to a set of topics on a Nats server. Calls received are then processed by the embedded jmespath collector that uses them to produce Tornado Events. In the final step, the Events are forwarded to the Tornado Engine through the configured connection type.
For each topic, you must provide two values in order to successfully configure them:
nats_topics: A list of Nats topics to which the collector will subscribe.
collector_config: (Optional) The transformation logic that converts a JSON object received from Nats into a Tornado Event. It consists of a JMESPath collector configuration as described in its specific documentation.
Tornado Icinga2 Collector (executable)
The Icinga2 Collector subscribes to the Icinga2 API event streams, generates Tornado Events from the Icinga2 Events, and publishes them on the Tornado Engine TCP address.
How It Works
The Icinga2 collector executable is built on actix.
On startup, it connects to an existing Icinga2 Server API and subscribes to user defined Event Streams. Each Icinga2 Event published on the stream, is processed by the embedded jmespath collector that uses them to produce Tornado Events which are, finally, forwarded to the Tornado Engine’s TCP address.
More than one stream subscription can be defined. For each stream, you must provide two values in order to successfully create a subscription:
stream: the stream configuration composed of:
types: An array of Icinga2 Event types;
queue: A unique queue name used by Icinga2 to identify the stream;
filter: An optional Event Stream filter. Additional information about the filter can be found in the official documentation.
collector_config: The transformation logic that converts an Icinga2 Event into a Tornado Event. It consists of a JMESPath collector configuration as described in its specific documentation.
Note
Based on the Icinga2 Event Streams documentation, multiple HTTP clients can use the same queue name as long as they use the same event types and filter.
SNMP Trap Daemon Collectors
The _snmptrapd_collector_s of this package are embedded Perl trap handlers for Net-SNMP’s snmptrapd. When registered as a subroutine in the Net-SNMP snmptrapd process, they receives snmptrap-specific inputs, transforms them into Tornado Events, and forwards them to the Tornado Engine.
There are two collector implementations, the first one sends Events directly to the Tornado TCP socket and the second one forwards them to a NATS server.
The implementations rely on the Perl NetSNMP::TrapReceiver package. You can refer to its documentation for generic configuration examples and usage advice.
How They Work
The _snmptrapd_collector_s receive snmptrapd messages, parse them, generate Tornado Events and, finally, sends them to Tornado using their specific communication channel.
The received messages are kept in an in-memory non-persistent buffer
that makes the application resilient to crashes or temporary
unavailability of the communication channel. When the connection to the
channel is restored, all messages in the buffer will be sent. When the
buffer is full, the collectors will start discarding old messages. The
buffer max size is set to 10000 messages.
Consider a snmptrapd message that contains the following information:
PDU INFO:
  version                        1
  errorstatus                    0
  community                      public
  receivedfrom                   UDP: [127.0.1.1]:41543->[127.0.2.2]:162
  transactionid                  1
  errorindex                     0
  messageid                      0
  requestid                      414568963
  notificationtype               TRAP
VARBINDS:
  iso.3.6.1.2.1.1.3.0            type=67 value=Timeticks: (1166403) 3:14:24.03
  iso.3.6.1.6.3.1.1.4.1.0        type=6  value=OID: iso.3.6.1.4.1.8072.2.3.0.1
  iso.3.6.1.4.1.8072.2.3.2.1     type=2  value=INTEGER: 123456
The collector will produce this Tornado Event:
{
   "type":"snmptrapd",
   "created_ms":"1553765890000",
   "payload":{
      "protocol":"UDP",
      "src_ip":"127.0.1.1",
      "src_port":"41543",
      "dest_ip":"127.0.2.2",
      "PDUInfo":{
         "version":"1",
         "errorstatus":"0",
         "community":"public",
         "receivedfrom":"UDP: [127.0.1.1]:41543->[127.0.2.2]:162",
         "transactionid":"1",
         "errorindex":"0",
         "messageid":"0",
         "requestid":"414568963",
         "notificationtype":"TRAP"
      },
      "oids":{
         "iso.3.6.1.2.1.1.3.0":"67",
         "iso.3.6.1.6.3.1.1.4.1.0":"6",
         "iso.3.6.1.4.1.8072.2.3.2.1":"2"
      }
   }
}
The structure of the generated Event is not configurable.
JMESPath Collector Configuration
The Collector configuration is composed of two named values:
event_type: Identifies the type of Event, and can be a String or a JMESPath expression (see below).
payload: A Map<String, ValueProcessor> with event-specific data.
and here the payload ValueProcessor can be one of:
A null value
A string
A bool value (i.e., true or false)
A number
An array of values
A map of type Map<String, ValueProcessor>
A JMESPath expression : A valid JMESPath expression delimited by the ‘${‘ and ‘}’ characters.
The Collector configuration defines the structure of the Event produced. The configuration’s event_type property will define the type of Event, while the Event’s payload will have the same structure as the configuration’s payload.
How it Works
The JMESPath expressions of the configuration will be applied to incoming inputs, and the results will be included in the Event produced. All other ValueProcessors, instead, are copied without modification.
For example, consider the following configuration:
{
    "event_type": "webhook",
    "payload": {
        "name" : "${reference.authors[0]}",
        "from": "jmespath-collector",
        "active": true
    }
}
The value ${reference.authors[0]} is a JMESPath expression, delimited
by ${ and }, and whose value depends on the incoming input.
Thus if this input is received:
{
    "date": "today",
    "reference": {
        "authors" : [
          "Francesco",
          "Thomas"
        ]
    }
}
then the Collector will produce this Event:
{
    "event_type": "webhook",
    "payload": {
        "name" : "Francesco",
        "from": "jmespath-collector",
        "active": true
    }
}
Runtime behavior
When the JMESPath expression returns an array or a map, the entire object will be inserted as-is into the Event.
However, if a JMESPath expression does not return a valid result, then no Event is created, and an error is produced.
Email Collector Configuration
The executable configuration is based partially on configuration files, and partially on command line parameters.
The available startup parameters are:
config-dir: The filesystem folder from which the collector configuration is read. The default path is /etc/tornado_email_collector/.
In addition to these parameters, the following configuration entries are available in the file ‘config-dir’/email_collector.toml:
logger:
level: The Logger level; valid values are trace, debug, info, warn, and error.
stdout: Determines whether the Logger should print to standard output. Valid values are
trueandfalse.file_output_path: A file path in the file system; if provided, the Logger will append any output to it.
email_collector:
tornado_event_socket_ip: The IP address where outgoing events will be written. This should be the address where the Tornado Engine listens for incoming events. If present, this value overrides what specified by the
tornado_connection_channelentry. This entry is deprecated and will be removed in the next release of tornado. Please, use the ``tornado_connection_channel`` instead.tornado_event_socket_port: The port where outgoing events will be written. This should be the port where the Tornado Engine listens for incoming events. This entry is mandatory if
tornado_connection_channelis set toTCP. If present, this value overrides what specified by thetornado_connection_channelentry. This entry is deprecated and will be removed in the next release of tornado. Please, use the ``tornado_connection_channel`` instead.message_queue_size: The in-memory buffer size for Events. It makes the application resilient to Tornado Engine crashes or temporary unavailability. When Tornado restarts, all messages in the buffer will be sent. When the buffer is full, the collector will start discarding older messages first.
uds_path: The Unix Socket path on which the collector will listen for incoming emails.
tornado_connection_channel: The channel to send events to Tornado. It contains the set of entries required to configure a Nats or a TCP connection. Beware that this entry will be taken into account only if ``tornado_event_socket_ip`` and ``tornado_event_socket_port`` are not provided.
In case of connection using Nats, these entries are mandatory:
nats.client.addresses: The addresses of the NATS server.
nats.client.auth.type: The type of authentication used to authenticate to NATS (Optional. Valid values are
NoneandTls. Defaults toNoneif not provided).nats.client.auth.path_to_pkcs12_bundle: The path to a PKCS12 file that will be used for authenticating to NATS (Mandatory if
nats.client.auth.typeis set toTls).nats.client.auth.pkcs12_bundle_password: The password to decrypt the provided PKCS12 file (Mandatory if
nats.client.auth.typeis set toTls).nats.client.auth.path_to_root_certificate: The path to a root certificate (in
.pemformat) to trust in addition to system’s trust root. May be useful if the NATS server is not trusted by the system as default. (Optional, valid ifnats.client.auth.typeis set toTls).nats.subject: The NATS Subject where tornado will subscribe and listen for incoming events.
In case of connection using TCP, these entries are mandatory:
tcp_socket_ip: The IP address where outgoing events will be written. This should be the address where the Tornado Engine listens for incoming events.
tcp_socket_port: The port where outgoing events will be written. This should be the port where the Tornado Engine listens for incoming events.
More information about the logger configuration is available in the Common Logger documentation.
The default config-dir value can be customized at build time by specifying the environment variable TORNADO_EMAIL_COLLECTOR_CONFIG_DIR_DEFAULT. For example, this will build an executable that uses /my/custom/path as the default value:
TORNADO_EMAIL_COLLECTOR_CONFIG_DIR_DEFAULT=/my/custom/path cargo
build
An example of a full startup command is:
./tornado_email_collector \
      --config-dir=/tornado-email-collector/config \
In this example the Email Collector starts up and then reads the configuration from the /tornado-email-collector/config directory.
Tornado Rsyslog Collector Configuration
The executable configuration is based partially on configuration files, and partially on command line parameters.
The available startup parameters are:
config-dir: The filesystem folder from which the collector configuration is read. The default path is /etc/tornado_rsyslog_collector/.
In addition to these parameters, the following configuration entries are available in the file ‘config-dir’/rsyslog_collector.toml:
logger:
level: The Logger level; valid values are trace, debug, info, warn, and error.
stdout: Determines whether the Logger should print to standard output. Valid values are
trueandfalse.file_output_path: A file path in the file system; if provided, the Logger will append any output to it.
rsyslog_collector:
tornado_event_socket_ip: The IP address where outgoing events will be written. This should be the address where the Tornado Engine listens for incoming events. If present, this value overrides what specified by the
tornado_connection_channelentry. This entry is deprecated and will be removed in the next release of tornado. Please, use the ``tornado_connection_channel`` instead.tornado_event_socket_port: The port where outgoing events will be written. This should be the port where the Tornado Engine listens for incoming events. This entry is mandatory if
tornado_connection_channelis set toTCP. If present, this value overrides what specified by thetornado_connection_channelentry. This entry is deprecated and will be removed in the next release of tornado. Please, use the ``tornado_connection_channel`` instead.message_queue_size: The in-memory buffer size for Events. It makes the application resilient to Tornado Engine crashes or temporary unavailability. When Tornado restarts, all messages in the buffer will be sent. When the buffer is full, the collector will start discarding older messages first.
tornado_connection_channel: The channel to send events to Tornado. It contains the set of entries required to configure a Nats or a TCP connection. Beware that this entry will be taken into account only if ``tornado_event_socket_ip`` and ``tornado_event_socket_port`` are not provided.
In case of connection using Nats, these entries are mandatory:
nats.client.addresses: The addresses of the NATS server.
nats.client.auth.type: The type of authentication used to authenticate to NATS (Optional. Valid values are
NoneandTls. Defaults toNoneif not provided).nats.client.auth.path_to_pkcs12_bundle: The path to a PKCS12 file that will be used for authenticating to NATS (Mandatory if
nats.client.auth.typeis set toTls).nats.client.auth.pkcs12_bundle_password: The password to decrypt the provided PKCS12 file (Mandatory if
nats.client.auth.typeis set toTls).nats.client.auth.path_to_root_certificate: The path to a root certificate (in
.pemformat) to trust in addition to system’s trust root. May be useful if the NATS server is not trusted by the system as default. (Optional, valid ifnats.client.auth.typeis set toTls).nats.subject: The NATS Subject where tornado will subscribe and listen for incoming events.
In case of connection using TCP, these entries are mandatory:
tcp_socket_ip: The IP address where outgoing events will be written. This should be the address where the Tornado Engine listens for incoming events.
tcp_socket_port: The port where outgoing events will be written. This should be the port where the Tornado Engine listens for incoming events.
More information about the logger configuration is available in the Common Logger documentation.
The default config-dir value can be customized at build time by specifying the environment variable TORNADO_RSYSLOG_COLLECTOR_CONFIG_DIR_DEFAULT. For example, this will build an executable that uses /my/custom/path as the default value:
TORNADO_RSYSLOG_COLLECTOR_CONFIG_DIR_DEFAULT=/my/custom/path cargo build
Tornado Webhook Collector Configuration
The executable configuration is based partially on configuration files, and partially on command line parameters.
The available startup parameters are:
config-dir: The filesystem folder from which the collector configuration is read. The default path is /etc/tornado_webhook_collector/.
webhooks-dir: The folder where the Webhook configurations are saved in JSON format; this folder is relative to the
config_dir. The default value is /webhooks/.
In addition to these parameters, the following configuration entries are available in the file ‘config-dir’/webhook_collector.toml:
logger:
level: The Logger level; valid values are trace, debug, info, warn, and error.
stdout: Determines whether the Logger should print to standard output. Valid values are
trueandfalse.file_output_path: A file path in the file system; if provided, the Logger will append any output to it.
webhook_collector:
tornado_event_socket_ip: The IP address where outgoing events will be written. This should be the address where the Tornado Engine listens for incoming events. If present, this value overrides what specified by the
tornado_connection_channelentry. This entry is deprecated and will be removed in the next release of tornado. Please, use the ``tornado_connection_channel`` instead.tornado_event_socket_port: The port where outgoing events will be written. This should be the port where the Tornado Engine listens for incoming events. This entry is mandatory if
tornado_connection_channelis set toTCP. If present, this value overrides what specified by thetornado_connection_channelentry. This entry is deprecated and will be removed in the next release of tornado. Please, use the ``tornado_connection_channel`` instead.message_queue_size: The in-memory buffer size for Events. It makes the application resilient to errors or temporary unavailability of the Tornado connection channel. When the connection on the channel is restored, all messages in the buffer will be sent. When the buffer is full, the collector will start discarding older messages first.
server_bind_address: The IP to bind the HTTP server to.
server_port: The port to be used by the HTTP Server.
tornado_connection_channel: The channel to send events to Tornado. It contains the set of entries required to configure a Nats or a TCP connection. Beware that this entry will be taken into account only if ``tornado_event_socket_ip`` and ``tornado_event_socket_port`` are not provided.
In case of connection using Nats, these entries are mandatory:
nats.client.addresses: The addresses of the NATS server.
nats.client.auth.type: The type of authentication used to authenticate to NATS (Optional. Valid values are
NoneandTls. Defaults toNoneif not provided).nats.client.auth.path_to_pkcs12_bundle: The path to a PKCS12 file that will be used for authenticating to NATS (Mandatory if
nats.client.auth.typeis set toTls).nats.client.auth.pkcs12_bundle_password: The password to decrypt the provided PKCS12 file (Mandatory if
nats.client.auth.typeis set toTls).nats.client.auth.path_to_root_certificate: The path to a root certificate (in
.pemformat) to trust in addition to system’s trust root. May be useful if the NATS server is not trusted by the system as default. (Optional, valid ifnats.client.auth.typeis set toTls).nats.subject: The NATS Subject where tornado will subscribe and listen for incoming events.
In case of connection using TCP, these entries are mandatory:
tcp_socket_ip: The IP address where outgoing events will be written. This should be the address where the Tornado Engine listens for incoming events.
tcp_socket_port: The port where outgoing events will be written. This should be the port where the Tornado Engine listens for incoming events.
More information about the logger configuration can be found in the Common Logger documentation.
The default config-dir value can be customized at build time by specifying the environment variable TORNADO_WEBHOOK_COLLECTOR_CONFIG_DIR_DEFAULT. For example, this will build an executable that uses /my/custom/path as the default value:
TORNADO_WEBHOOK_COLLECTOR_CONFIG_DIR_DEFAULT=/my/custom/path cargo build
An example of a full startup command is:
./tornado_webhook_collector \
      --config-dir=/tornado-webhook-collector/config
In this example the Webhook Collector starts up and then reads the configuration from the /tornado-webhook-collector/config directory.
Webhooks Configuration
As described before, the two startup parameters config-dir and webhooks-dir determine the path to the Webhook configurations, and each webhook is configured by providing id, token and collector_config.
As an example, consider how to configure a webhook for a repository hosted on Github.
If we start the application using the command line provided in the previous section, the webhook configuration files should be located in the /tornado-webhook-collector/config/webhooks directory. Each configuration is saved in a separate file in that directory in JSON format (the order shown in the directory is not necessarily the order in which the hooks are processed):
/tornado-webhook-collector/config/webhooks
                 |- github.json
                 |- bitbucket_first_repository.json
                 |- bitbucket_second_repository.json
                 |- ...
An example of valid content for a Webhook configuration JSON file is:
{
  "id": "github_repository",
  "token": "secret_token",
  "collector_config": {
    "event_type": "${commits[0].committer.name}",
    "payload": {
      "source": "github",
      "ref": "${ref}",
      "repository_name": "${repository.name}"
    }
  }
}
This configuration assumes that this endpoint has been created:
http(s)://collector_ip:collector_port/event/github_repository
However, the Github webhook issuer must pass the token at each call. Consequently, the actual URL to be called will have this structure:
http(s)://collector_ip:collector_port/event/github_repository?token=secret_token
Security warning: Since the security token is present in the query string, it is extremely important that the webhook collector is always deployed with HTTPS in production. Otherwise, the token will be sent unencrypted along with the entire URL.
Consequently, if the public IP of the collector is, for example, 35.35.35.35 and the server port is 1234, in Github, the webhook settings page should look like in Fig. 112.
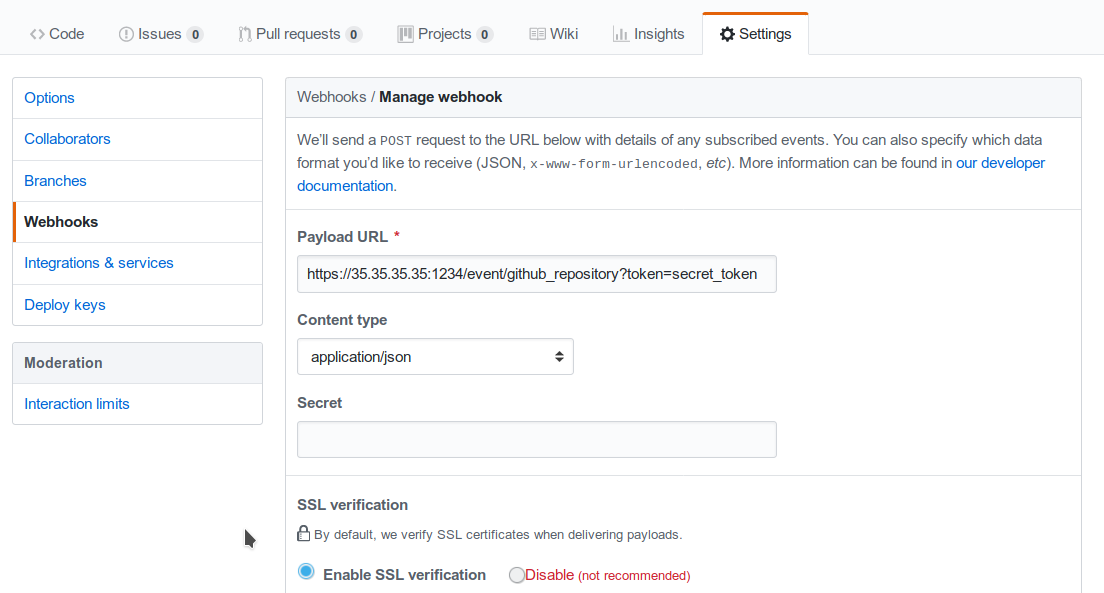
Fig. 112 Configuring a GitHub webhook.
Finally, the collector_config configuration entry determines the content of the tornado Event associated with each webhook input.
So for example, if Github sends this JSON (only the relevant parts shown here):
{
  "ref": "refs/heads/master",
  "commits": [
    {
      "id": "33ad3a6df86748011ee8d5cef13d206322abc68e",
      "committer": {
        "name": "GitHub",
        "email": "noreply@github.com",
        "username": "web-flow"
      }
    }
  ],
  "repository": {
    "id": 123456789,
    "name": "webhook-test"
  }
}
then the resulting Event will be:
{
  "type": "GitHub",
  "created_ms": 1554130814854,
  "payload": {
    "source": "github",
    "ref": "refs/heads/master",
    "repository_name": "webhook-test"
  }
}
The Event creation logic is handled internally by the JMESPath collector, a detailed description of which is available in its specific documentation.
Tornado Nats JSON Collector Configuration
The executable configuration is based partially on configuration files, and partially on command line parameters.
The available startup parameters are:
config-dir: The filesystem folder from which the collector configuration is read. The default path is /etc/tornado_nats_json_collector/.
topics-dir: The folder where the topic configurations are saved in JSON format; this folder is relative to the
config_dir. The default value is /topics/.
In addition to these parameters, the following configuration entries are available in the file ‘config-dir’/nats_json_collector.toml:
logger:
level: The Logger level; valid values are trace, debug, info, warn, and error.
stdout: Determines whether the Logger should print to standard output. Valid values are
trueandfalse.file_output_path: A file path in the file system; if provided, the Logger will append any output to it.
nats_json_collector:
message_queue_size: The in-memory buffer size for Events. It makes the application resilient to errors or temporary unavailability of the Tornado connection channel. When the connection on the channel is restored, all messages in the buffer will be sent. When the buffer is full, the collector will start discarding older messages first.
nats_client.addresses: The addresses of the NATS server.
nats_client.auth.type: The type of authentication used to authenticate to NATS (Optional. Valid values are
NoneandTls. Defaults toNoneif not provided).nats_client.auth.path_to_pkcs12_bundle: The path to a PKCS12 file that will be used for authenticating to NATS (Mandatory if
nats_client.auth.typeis set toTls).nats_client.auth.pkcs12_bundle_password: The password to decrypt the provided PKCS12 file (Mandatory if
nats_client.auth.typeis set toTls).nats_client.auth.path_to_root_certificate: The path to a root certificate (in
.pemformat) to trust in addition to system’s trust root. May be useful if the NATS server is not trusted by the system as default. (Optional, valid ifnats_client.auth.typeis set toTls).tornado_connection_channel: The channel to send events to Tornado. It contains the set of entries required to configure a Nats or a TCP connection.
In case of connection using Nats, these entries are mandatory:
nats_subject: The NATS Subject where tornado will subscribe and listen for incoming events.
In case of connection using TCP, these entries are mandatory:
tcp_socket_ip: The IP address where outgoing events will be written. This should be the address where the Tornado Engine listens for incoming events.
tcp_socket_port: The port where outgoing events will be written. This should be the port where the Tornado Engine listens for incoming events.
More information about the logger configurationis available in the Common Logger documentation.
The default config-dir value can be customized at build time by specifying the environment variable TORNADO_NATS_JSON_COLLECTOR_CONFIG_DIR_DEFAULT. For example, this will build an executable that uses /my/custom/path as the default value:
TORNADO_NATS_JSON_COLLECTOR_CONFIG_DIR_DEFAULT=/my/custom/path cargo build
An example of a full startup command is:
./tornado_nats_json_collector \
      --config-dir=/tornado-nats-json-collector/config
In this example the Nats JSON Collector starts up and then reads the configuration from the /tornado-nats-json-collector/config directory.
Topics Configuration
As described before, the two startup parameters config-dir and topics-dir determine the path to the topic configurations, and each topic is configured by providing nats_topics and collector_config.
As an example, consider how to configure a “simple_test” topic.
If we start the application using the command line provided in the previous section, the topics configuration files should be located in the /tornado-nats-json-collector/config/topics directory. Each configuration is saved in a separate file in that directory in JSON format (the order shown in the directory is not necessarily the order in which the topics are processed):
/tornado-nats-json-collector/config/topics
                 |- simple_test.json
                 |- something_else.json
                 |- ...
An example of valid content for a Topic configuration JSON file is:
{
  "nats_topics": ["simple_test_one", "simple_test_two"],
  "collector_config": {
    "event_type": "${content.type}",
    "payload": {
      "ref": "${content.ref}",
      "repository_name": "${repository}"
    }
  }
}
With this configuration, two subscriptions are created to the Nats topics simple_test_one and simple_test_two. Messages received by those topics are processed using the collector_config that determines the content of the tornado Event associated with them.
It is important to note that, if a Nats topic name is used more than once, then the collector will perfom multiple subscriptions accordingly. This can happen if a topic name is duplicated into the nats_topics array or in multiple JSON files.
So for example, if this JSON message is received:
{
  "content": {
    "type": "content_type",
    "ref": "refs/heads/master"
  },
  "repository": {
    "id": 123456789,
    "name": "webhook-test"
  }
}
then the resulting Event will be:
{
  "type": "content_type",
  "created_ms": 1554130814854,
  "payload": {
    "ref": "refs/heads/master",
    "repository": {
        "id": 123456789,
        "name": "webhook-test"
      }
  }
}
The Event creation logic is handled internally by the JMESPath collector, a detailed description of which is available in its specific documentation.
Default values
The collector_config section and all of its internal entries are optional. If not provided explicitly, the collector will use these predefined values:
When the collector_config.event_type is not provided, the name of the Nats topic that sent the message is used as Event type.
When the collector_config.payload is not provided, the entire source message is included in the payload of the generated Event with the key data.
Consequently, the simplest valid topic configuration contains only the nats_topics:
{
  "nats_topics": ["subject_one", "subject_two"]
}
The above one is equivalent to:
{
  "nats_topics": ["subject_one", "subject_two"],
  "collector_config": {
    "payload": {
      "data": "${@}"
    }
  }
}
In this case the generated Tornado Events have type equals to the topic name and the whole source data in their payload.
Tornado Icinga2 Collector Configuration
The executable configuration is based partially on configuration files, and partially on command line parameters.
The available startup parameters are:
config-dir: The filesystem folder from which the collector configuration is read. The default path is /etc/tornado_icinga2_collector/.
streams_dir: The folder where the Stream configurations are saved in JSON format; this folder is relative to the
config_dir. The default value is /streams/.
In addition to these parameters, the following configuration entries are available in the file ‘config-dir’/icinga2_collector.toml:
logger:
level: The Logger level; valid values are trace, debug, info, warn, and error.
stdout: Determines whether the Logger should print to standard output. Valid values are
trueandfalse.file_output_path: A file path in the file system; if provided, the Logger will append any output to it.
icinga2_collector
tornado_event_socket_ip: The IP address where outgoing events will be written. This should be the address where the Tornado Engine listens for incoming events. If present, this value overrides what specified by the
tornado_connection_channelentry. This entry is deprecated and will be removed in the next release of tornado. Please, use the ``tornado_connection_channel`` instead.tornado_event_socket_port: The port where outgoing events will be written. This should be the port where the Tornado Engine listens for incoming events. This entry is mandatory if
tornado_connection_channelis set toTCP. If present, this value overrides what specified by thetornado_connection_channelentry. This entry is deprecated and will be removed in the next release of tornado. Please, use the ``tornado_connection_channel`` instead.message_queue_size: The in-memory buffer size for Events. It makes the application resilient to Tornado Engine crashes or temporary unavailability. When Tornado restarts, all messages in the buffer will be sent. When the buffer is full, the collector will start discarding older messages first.
connection
server_api_url: The complete URL of the Icinga2 Event Stream API.
username: The username used to connect to the Icinga2 APIs.
password: The password used to connect to the Icinga2 APIs.
disable_ssl_verification: A boolean value. If true, the client will not verify the Icinga2 SSL certificate.
sleep_ms_between_connection_attempts: In case of connection failure, the number of milliseconds to wait before a new connection attempt.
tornado_connection_channel: The channel to send events to Tornado. It contains the set of entries required to configure a Nats or a TCP connection. Beware that this entry will be taken into account only if ``tornado_event_socket_ip`` and ``tornado_event_socket_port`` are not provided.
In case of connection using Nats, these entries are mandatory:
nats.client.addresses: The addresses of the NATS server.
nats.client.auth.type: The type of authentication used to authenticate to NATS (Optional. Valid values are
NoneandTls. Defaults toNoneif not provided).nats.client.auth.path_to_pkcs12_bundle: The path to a PKCS12 file that will be used for authenticating to NATS (Mandatory if
nats.client.auth.typeis set toTls).nats.client.auth.pkcs12_bundle_password: The password to decrypt the provided PKCS12 file (Mandatory if
nats.client.auth.typeis set toTls).nats.client.auth.path_to_root_certificate: The path to a root certificate (in
.pemformat) to trust in addition to system’s trust root. May be useful if the NATS server is not trusted by the system as default. (Optional, valid ifnats.client.auth.typeis set toTls).nats.subject: The NATS Subject where tornado will subscribe and listen for incoming events.
In case of connection using TCP, these entries are mandatory:
tcp_socket_ip: The IP address where outgoing events will be written. This should be the address where the Tornado Engine listens for incoming events.
tcp_socket_port: The port where outgoing events will be written. This should be the port where the Tornado Engine listens for incoming events.
More information about the logger configuration is available in the Common Logger documentation.
The default config-dir value can be customized at build time by specifying the environment variable TORNADO_ICINGA2_COLLECTOR_CONFIG_DIR_DEFAULT. For example, this will build an executable that uses /my/custom/path as the default value:
TORNADO_ICINGA2_COLLECTOR_CONFIG_DIR_DEFAULT=/my/custom/path cargo
build
An example of a full startup command is:
./tornado_webhook_collector \
      --config-dir=/tornado-icinga2-collector/config
In this example the Icinga2 Collector starts up and then reads the configuration from the /tornado-icinga2-collector/config directory.
Streams Configuration
As described before, the two startup parameters config-dir and streams-dir determine the path to the stream configurations.
For example, if we start the application using the command line provided in the previous section, the stream configuration files should be located in the /tornado-icinga2-collector/config/streams directory. Each configuration is saved in a separate file in that directory in JSON format:
/tornado-icinga2-collector/config/streams
                 |- 001_CheckResults.json
                 |- 002_Notifications.json
                 |- ...
The alphabetical ordering of the files has no impaact on the collector’s logic.
An example of valid content for a stream configuration JSON file is:
{
  "stream": {
    "types": ["CheckResult"],
    "queue": "icinga2_CheckResult",
    "filter": "event.check_result.exit_status==2"
  },
  "collector_config": {
    "event_type": "icinga2_event",
    "payload": {
      "source": "icinga2",
      "icinga2_event": "${@}"
     }
  }
}
This stream subscription will receive all Icinga2 Events of type ‘CheckResult’ with ‘exit_status’=2. It will then produce a Tornado Event with type ‘icinga2_event’ and the entire Icinga2 Event in the payload with key ‘icinga2_event’.
The Event creation logic is handled internally by the JMESPath collector, a detailed description of which is available in its specific documentation.
SNMPTrapd TCP Collector Configuration
Prerequisites
This collector has the following runtime requirements:
Perl 5.16 or greater
Perl packages required:
Cpanel::JSON::XS
NetSNMP::TrapReceiver
You can verify that the Perl packages are available with the command:
$ perl -e 'use Cpanel::JSON::XS;' && \
  perl -e 'use NetSNMP::TrapReceiver;'
If no messages are displayed in the console, then everything is okay; otherwise, you will see error messages.
In case of missing dependencies, use your system’s package manager to install them.
For example, the required Perl packages can be installed on an Ubuntu system with:
$ sudo apt install libcpanel-json-xs-perl libsnmp-perl
Activation
This Collector is meant to be integrated with snmptrapd. To activate it, put the following line in your snmptrapd.conf file:
perl do "/path_to_the_script/snmptrapd_tcp_collector.pl";
Consequently, it is never started manually, but instead will be started, and managed, directly by snmptrapd itself.
At startup, if the collector is configured properly, you should see this entry either in the logs or in the daemon’s standard error output:
The TCP based snmptrapd_collector was loaded successfully.
Configuration options
The address of the Tornado Engine TCP instance to which the events are forwarded is configured with the following environment variables:
TORNADO_ADDR: the IP address of Tornado Engine. If not specified, it will use the default value 127.0.0.1
TORNADO_PORT: the port of the TCP socket of Tornado Engine. If not specified, it will use the default value 4747
SNMPTrapd NATS Collector Configuration
Prerequisites
This collector has the following runtime requirements:
Perl 5.16 or greater
Perl packages required:
Cpanel::JSON::XS
Net::NATS::Client
NetSNMP::TrapReceiver
You can verify that the Perl packages are available with the command:
$ perl -e 'use Cpanel::JSON::XS;' && \
  perl -e 'use Net::NATS::Client;' && \
  perl -e 'use NetSNMP::TrapReceiver;'
If no messages are displayed in the console, then everything is okay; otherwise, you will see error messages.
In case of missing dependencies, use your system’s package manager to install them.
Instructions for installing Net::NATS::Client are available at its
official repository
Activation
This Collector is meant to be integrated with snmptrapd. To activate it, put the following line in your snmptrapd.conf file:
perl do "/path_to_the_script/snmptrapd_collector.pl";
Consequently, it is never started manually, but instead will be started, and managed, directly by snmptrapd itself.
At startup, if the collector is configured properly, you should see this entry either in the logs or in the daemon’s standard error output:
The snmptrapd_collector for NATS was loaded successfully.
Configuration options
The information to connect to the NATS Server are provided by the following environment variables:
TORNADO_NATS_ADDR: the address of the NATS server. If not specified, it will use the default value 127.0.0.1:4222
TORNADO_NATS_SUBJECT: the NATS subject where the events are published. If not specified, it will use the default value tornado.events
TORNADO_NATS_SSL_CERT_PEM_FILE: The filesystem path of a PEM certificate. This entry is optional, when provided, the collector will use the certificate to connect to the NATS server
TORNADO_NATS_SSL_CERT_KEY: The filesystem path for the KEY of the PEM certificate provided by the TORNADO_NATS_SSL_CERT_PEM_FILE entry. This entry is mandatory if the TORNADO_NATS_SSL_CERT_PEM_FILE entry is provided
Tornado Engine CLI Commands and Configuration
The Tornado CLI has commands that allow you to use the functionality provided. Running the Tornado executable without any arguments returns a list of all available commands and global options that apply to every command.
Tornado commands:
__apm-tracing enable|disable__ : Enable or disable the APM priority logger output.
When used with enable, it:
enables the APM logger
disables the stdout logger output
sets logger level to info,tornado=debug
When used with disable, it:
disables the APM logger
enables the stdout logger output
sets logger level to value from the configuration file
check : Checks that the configuration is valid.
daemon : Starts the Tornado daemon.
help : Prints the general help page, or the specific help of the given command.
rules-upgrade : Checks the current configuration and, if available, upgrades the rules structure to the most recent one.
filter-create : Creates a Filter at the root level of the current configuration and of the open drafts.
Parameters:
name: The name of the Filter to be created.
json-definition: The JSON representation of the Filter.
In case a Node with the same name already exists at the root level of the configuration, the following will happen:
If the existing node is a Ruleset, it will be renamed to: <ruleset_name>_backup_<timestamp_in_milliseconds>.
If the existing node is a Filter having a different filter definition, it will be renamed to: <filter_name>_backup_<timestamp_in_milliseconds>.
If the existing node is a Filter having the same filter definition, nothing will be done.
Each CLI command provides its own help and usage information, you can
display using the help command.
For example, with this command you can show the help page and options of
daemon:
./tornado_engine help daemon
The Tornado configuration is partly based on configuration files and partly based on command line parameters. The location of configuration files in the file system is determined at startup based on the provided CLI options.
Tornado global options:
config-dir: The filesystem folder from which the Tornado configuration is read. The default path is /etc/tornado.
rules-dir: The folder where the Rules are saved in JSON format; this folder is relative to
config_dir. The default value is /rules.d/.
The check command does not have any specific options.
The daemon command has options specified in the tornado.daemon section of the tornado.toml configuration file.
In addition to these parameters, the following configuration entries are available in the file ‘config-dir’/tornado.toml:
logger:
level: The Logger level; valid values are trace, debug, info, warn, and error.
stdout: Determines whether the Logger should print to standard output. Valid values are
trueandfalse.file_output_path: A file path in the file system; if provided, the Logger will append any output to it.
tornado.daemon
thread_pool_config: The configuration of the thread pools bound to the internal queues. This entry is optional and should be rarely configured manually. For more details see the following Structure and Configuration: The Thread Pool Configuration section.
retry_strategy.retry_policy: The global retry policy for reprocessing failed actions. (Optional. Defaults to
MaxAttemptsif not provided). For more details see the following Structure and Configuration: Retry Strategy Configuration section.retry_strategy.backoff_policy: The global back-off policy for reprocessing failed actions. (Mandatory only if
retry_strategy.retry_policyis provided). For more details see the following Structure and Configuration: Retry Strategy Configuration section.event_tcp_socket_enabled: Whether to enable the TCP server for incoming events (Optional. Valid values are
trueandfalse. Defaults totrueif not provided).event_socket_ip: The IP address where Tornado will listen for incoming events (Mandatory if
event_tcp_socket_enabledis set to true).event_socket_port: The port where Tornado will listen for incoming events (Mandatory if
event_tcp_socket_enabledis set to true).nats_enabled: Whether to connect to the NATS server (Optional. Valid values are
trueandfalse. Defaults tofalseif not provided).nats_extractors: List of data extractors for incoming Nats messages (Optional). Valid extractors are:
FromSubject: using a regex, extracts the first matching group from the Nats subject and adds its value to the event.metadata scope using the specified key. Example:
nats_extractors = [
    { type = "FromSubject", key = "tenant_id", regex = "^([^.]+)\\.tornado\\.events" }
]
nats.client.addresses: Array of addresses of the NATS nodes of a cluster. (Mandatory if
nats_enabledis set to true).nats.subject: The NATS Subject where tornado will subscribe and listen for incoming events (Mandatory if
nats_enabledis set to true).nats.client.auth.type: The type of authentication used to authenticate to NATS (Optional. Valid values are
NoneandTls. Defaults toNoneif not provided).nats.client.auth.certificate_path: The path to the client certificate that will be used for authenticating to NATS. (Mandatory if nats.client.auth.type is set to Tls).
nats.client.auth.private_key_path: The path to the client certificate private key that will be used for authenticating to NATS. (Mandatory if nats.client.auth.type is set to Tls).
nats.client.auth.path_to_root_certificate: The path to a root certificate (in
.pemformat) to trust in addition to system’s trust root. May be useful if the NATS server is not trusted by the system as default. (Optional, valid ifnats.client.auth.typeis set toTls).web_server_ip: The IP address where the Tornado Web Server will listen for HTTP requests. This is used, for example, by the monitoring endpoints.
web_server_port: The port where the Tornado Web Server will listen for HTTP requests.
web_max_json_payload_size: The max JSON size in bytes accepted by a Tornado endpoint. (Optional. Defaults to 67108860 (i.e. 64MB))
More information about the logger configuration is available in section Common Logger.
The default config-dir value can be customized at build time by specifying the environment variable TORNADO_CONFIG_DIR_DEFAULT. For example, this will build an executable that uses /my/custom/path as the default value:
TORNADO_CONFIG_DIR_DEFAULT=/my/custom/path cargo build
The command-specific options should always be used after the command name, while the global ones always precede it. An example of a full startup command is:
./tornado_engine
    --config-dir=./tornado/engine/config \
    daemon
In this case, the CLI executes the daemon command that starts the Engine with the configuration read from the ./tornado/engine/config directory. In addition, it will search for Filter and Rule definitions in the ./tornado/engine/config/rules.d directory in order to build the processing tree.
Structure and Configuration: The Thread Pool Configuration
Even if the default configuration should suit most of the use cases, in some particular situations it could be useful to customise the size of the internal queues used by Tornado. Tornado utilizes these queues to process incoming events and to dispatch triggered actions.
Tornado uses a dedicated thread pool per queue; the size of each queue is by default equal to the number of available logical CPUs. Consequently, in case of an action of type script, for example, Tornado will be able to run in parallel at max as many scripts as the number of CPUs.
This default behaviour can be overridden by providing a custom configuration for the thread pools size. This is achieved through the optional tornado_pool_config entry in the tornado.daemon section of the Tornado.toml configuration file.
Example of how to dynamically configure the thread pool based on the available CPUs:
[tornado.daemon]
thread_pool_config = {type = "CPU", factor = 1.0}
In this case, the size of the thread pool will be equal to
(number of available logical CPUs) multiplied by (factor) rounded to
the smallest integer greater than or equal to a number. If the resulting
value is less than 1, then 1 will be used be default.
For example, if there are 16 available CPUs, then:
{type: "CPU", factor: 0.5}=> thread pool size is 8{type: "CPU", factor: 2.0}=> thread pool size is 32
Example of how to statically configure the thread pool based:
[tornado.daemon]
thread_pool_config = {type = "Fixed", size = 20}
In this case, the size of the thread pool is statically fixed at 20. If the provided size is less than 1, then 1 will be used be default.
Structure and Configuration: Retry Strategy Configuration
Tornado allows the configuration of a global retry strategy to be applied when the execution of an Action fails.
A retry strategy is composed by:
retry policy: the policy that defines whether an action execution should be retried after an execution failure;
backoff policy: the policy that defines the sleep time between retries.
Valid values for the retry policy are:
{type = "MaxRetries", retries = 5}=> A predefined maximum amount of retry attempts. This is the default value with a retries set to 20.{type = "None"}=> No retries are performed.{type = "Infinite"}=> The operation will be retried an infinite number of times. This setting must be used with extreme caution as it could fill the entire memory buffer preventing Tornado from processing incoming events.
Valid values for the backoff policy are:
{type = "Exponential", ms = 1000, multiplier = 2 }: It increases the back off period for each retry attempt in a given set using the exponential function. The period to sleep on the first backoff is thems; themultiplieris instead used to calculate the next backoff interval from the last. This is the default configuration.{type = "None"}: No sleep time between retries. This is the default value.{type = "Fixed", ms = 1000 }: A fixed amount of milliseconds to sleep between each retry attempt.{type = "Variable", ms = [1000, 5000, 10000]}: The amount of milliseconds between two consecutive retry attempts.The time to wait after ‘i’ retries is specified in the vector at position ‘i’.
If the number of retries is bigger than the vector length, then the last value in the vector is used. For example:
ms = [111,222,333]-> It waits 111 ms after the first failure, 222 ms after the second failure and then 333 ms for all following failures.
Example of a complete Retry Strategy configuration:
[tornado.daemon]
retry_strategy.retry_policy = {type = "Infinite"}
retry_strategy.backoff_policy = {type = "Variable", ms = [1000, 5000, 10000]}
When not provided explicitly, the following default Retry Strategy is used:
[tornado.daemon]
retry_strategy.retry_policy = {type = "MaxRetries", retries = 20}
retry_strategy.backoff_policy = {type = "Exponential", ms = 1000, multiplier = 2 }
Structure and Configuration: Enable the TCP event socket
Enabling the TCP event socket server allows Tornado to receive events through a direct TCP connection.
The TCP event socket configuration entries are available in the
tornado.toml file. Example of the TCP socket section the
tornado.toml file:
# Whether to enable the TCP listener
event_tcp_socket_enabled = true
# The IP address where we will listen for incoming events.
event_socket_ip = "127.0.0.1"
#The port where we will listen for incoming events.
event_socket_port = 4747
In this case, Tornado will listen for incoming events on the TCP address
127.0.0.1:4747.
Structure and Configuration: Enable the Nats connection
Enabling the Nats connection allows Tornado to receive events published on a Nats cluster.
The Nats configuration entries are available in the tornado.toml
file. Example of the Nats section the tornado.toml file:
# Whether to connect to the NATS server
nats_enabled = true

# The addresses of the NATS server
nats.client.addresses = ["127.0.0.1:4222"]
# The NATS Subject where tornado will subscribe and listen for incoming events
nats.subject = "tornado.events"
In this case, Tornado will connect to the “test-cluster” and listen for incoming events published on “tornado.events” subject. Also, since nats.client.auth.type is not provided, Tornado will not authenticate to the NATS server.
At the moment, when the nats_enabled entry is set to true, it is
required that the Nats server is available at Tornado startup.
Structure and Configuration: Nats authentication
Available authentication types for Tornado are:
None: Tornado does not authenticate to the NATS server
Tls: Tornado authenticates to the NATS server via certificates with TLS
If not differently specified, Tornado will use the None authentication type.
If you want instead to enable TLS authentication to the NATS server you need something similar to the following configuration:
# Whether to connect to the NATS server
nats_enabled = true

# The addresses of the NATS server
nats.client.addresses = ["127.0.0.1:4222"]
# The NATS Subject where tornado will subscribe and listen for incoming events
nats.subject = "tornado.events"
# The type of authentication used when connecting to the NATS server
#nats.client.auth.type = "None"
nats.client.auth.type = "Tls"
# The path to a pkcs12 bundle file which contains the certificate and private key to authenicate to the NATS server
nats.client.auth.path_to_pkcs12_bundle = "/path/to/pkcs12/bundle.pfx"
# The password used to decrypt the pkcs12 bundle
nats.client.auth.pkcs12_bundle_password = "mypwd"
# The path to a root certificate (in .pem format) to trust in addition to system's trust root.
# May be useful if the NATS server is not trusted by the system as default. Optional
#nats.client.auth.path_to_root_certificate = "/path/to/root/certificate.crt.pem"
In this case Tornado will authenticate to the NATS server using the
certificate in the file specified in the field
nats.client.auth.path_to_pkcs12_bundle, using the password mypwd
to decrypt the file.
Structure and Configuration: The Archive Executor
The archive executor processes and
executes Actions of type “archive”. This executor configuration is
specified in the archive_executor.toml file in the Tornado config
folder.
For instance, if Tornado is started with the command:
tornado --config-dir=/tornado/config
then the configuration file’s full path will be
/tornado/config/archive_executor.toml.
The archive_executor.toml file has the following structure:
base_path =  "./target/tornado-log"
default_path = "/default/file.log"
file_cache_size = 10
file_cache_ttl_secs = 1

[paths]
"one" = "/one/file.log"
More details about the meaning of each entry and how the archive executor functions can be found in the executor documentation.
Structure and Configuration: The Elasticsearch Executor
The Elasticsearch executor
processes and executes Actions of type “elasticsearch”. The
configuration for this executor is specified in the
elasticsearch_executor.toml file into the Tornado config folder.
For instance, if Tornado is started with the command:
tornado --config-dir=/tornado/config
then the configuration file’s full path will be
/tornado/config/elasticsearch_executor.toml.
The elasticsearch_executor.toml has an optional default_auth
section that allows to define the default authentication method to be
used with Elasticsearch. An action can override the default method by
specifying the auth payload parameter. All the authentication
types defined in Elasticsearch executor are supported.
In case the default_auth section is omitted, no default
authentication is available.
Defining default Authentication in elasticsearch_executor.toml
Connect without authentication:
[default_auth]
type = "None"
Authentication with PEM certificates:
[default_auth]
type = "PemCertificatePath"
certificate_path = "/path/to/tornado/conf/certs/tornado.crt.pem"
private_key_path = "/path/to/tornado/conf/certs/private/tornado.key.pem"
ca_certificate_path = "/path/to/tornado/conf/certs/root-ca.crt"
More details about the executor can be found in the Elasticsearch executor.
Structure and Configuration: The Foreach Executor
The foreach executor allows the recursive executions of a set of actions with dynamic parameters.
More details about the executor can be found in the foreach executor.
Structure and Configuration: The Icinga2 Executor
The Icinga2 executor processes and
executes Actions of type “icinga2”. The configuration for this
executor is specified in the icinga2_client_executor.toml file
into the Tornado config folder.
For instance, if Tornado is started with the command:
tornado --config-dir=/tornado/config
then the configuration file’s full path will be
/tornado/config/icinga2_client_executor.toml.
The icinga2_client_executor.toml has the following configuration options:
server_api_url: The complete URL of the Icinga2 APIs.
username: The username used to connect to the Icinga2 APIs.
password: The password used to connect to the Icinga2 APIs.
disable_ssl_verification: If true, the client will not verify the SSL certificate of the Icinga2 server.
(optional) timeout_secs: The timeout in seconds for a call to the Icinga2 APIs. If not provided, it defaults to 10 seconds.
More details about the executor can be found in the Icinga2 executor documentation.
Structure and Configuration: The Director Executor
The Director executor processes
and executes Actions of type “director”. The configuration for this
executor is specified in the director_client_executor.toml file into
the Tornado config folder.
For instance, if Tornado is started with the command:
tornado --config-dir=/tornado/config
then the configuration file’s full path will be
/tornado/config/director_client_executor.toml.
The director_client_executor.toml has the following configuration options:
server_api_url: The complete URL of the Director APIs.
username: The username used to connect to the Director APIs.
password: The password used to connect to the Director APIs.
disable_ssl_verification: If true, the client will not verify the SSL certificate of the Director REST API server.
(optional) timeout_secs: The timeout in seconds for a call to the Icinga Director REST APIs. If not provided, it defaults to 10 seconds.
More details about the executor can be found in the Director executor documentation.
Structure and Configuration: The Logger Executor
The logger executor logs the whole Action body to the standard log at the info level.
This executor has no specific configuration.
Structure and Configuration: The Script Executor
The script executor processes and executes Actions of type “script”.
This executor has no specific configuration, since everything required for script execution is contained in the Action itself as described in the executor documentation.
Structure and Configuration: The Smart Monitoring Check Result Executor
The configuration of the smart_monitoring_check_result executor is specified in the
smart_monitoring_check_result.toml file into the Tornado config
folder.
The smart_monitoring_check_result.toml has the following configuration options:
pending_object_set_status_retries_attempts: The number of attempts to perform a
process_check_resultfor an object in pending state.pending_object_set_status_retries_sleep_ms: The sleep time in ms between attempts to perform a process_check_result for an object in pending state.
The smart_monitoring_check_result.toml file is optional; if not
provided, the following default values will be used:
pending_object_set_status_retries_attempts = 5
pending_object_set_status_retries_sleep_ms = 2000
More details about the executor can be found in the smart_monitoring_check_result documentation.
Tornado Backend API v1
The Tornado Backend contains endpoints that allow you to interact with Tornado through REST endpoints.
In this section we describe the version 1 of the Tornado Backend APIs.
Tornado ‘Auth’ Backend API
The ‘auth’ APIs require the caller to pass an authorization token in the headers in the format:
Authorization : Bearer TOKEN_HERE
The token should be a base64 encoded JSON with this user data:
{
  "user": "THE_USER_IDENTIFIER",
  "roles": ["ROLE_1", "ROLE_2", "ROLE_2"]
}
In the coming releases the current token format will be replaced by a JSON Web Token (JWT).
Tornado ‘Config’ Backend API
The ‘config’ APIs require the caller to pass an authorization token in the headers as in the ‘auth’ API.
Working with configuration and drafts
These endpoints allow working with the configuration and the drafts
Endpoint: get the current Tornado configuration
HTTP Method: GET
path : /api/v1_beta/config/current
response type: JSON
response example:
{
  "type": "Rules",
  "rules": [
    {
      "name": "all_emails",
      "description": "This matches all emails",
      "continue": true,
      "active": true,
      "constraint": {
        "WHERE": {
          "type": "AND",
          "operators": [
            {
              "type": "equal",
              "first": "${event.type}",
              "second": "email"
            }
          ]
        },
        "WITH": {}
      },
      "actions": [
        {
          "id": "Logger",
          "payload": {
            "subject": "${event.payload.subject}",
            "type": "${event.type}"
          }
        }
      ]
    }
  ]
}
Endpoint: get list of draft ids
HTTP Method: GET
path : /api/v1_beta/config/drafts
response type: JSON
response: An array of String ids
response example:
["id1", "id2"]
Endpoint: get a draft by id
HTTP Method: GET
path : /api/v1_beta/config/drafts/{draft_id}
response type: JSON
response: the draft content
response example:
{
  "type": "Rules",
  "rules": [
    {
      "name": "all_emails",
      "description": "This matches all emails",
      "continue": true,
      "active": true,
      "constraint": {
        "WHERE": {},
        "WITH": {}
      },
      "actions": []
    }
  ]
}
Endpoint: create a new draft and return the draft id. The new draft is an exact copy of the current configuration; anyway, a root Filter node is added if not present.
HTTP Method: POST
path : /api/v1_beta/config/drafts
response type: JSON
response: the draft content
response example:
{
  "id": "id3"
}
Endpoint: update an existing draft
HTTP Method: PUT
path : /api/v1_beta/config/drafts/{draft_id}
request body type: JSON
request body: The draft content in the same JSON format returned by the GET /api/v1_beta/config/drafts/{draft_id} endpoint
response type: JSON
response: an empty json object
Endpoint: delete an existing draft
HTTP Method: DELETE
path : /api/v1_beta/config/drafts/{draft_id}
response type: JSON
response: an empty json object
Endpoint: take over an existing draft
HTTP Method: POST
path : /api/v1_beta/config/drafts/{draft_id}/take_over
response type: JSON
response: an empty json object
Endpoint: deploy an existing draft
HTTP Method: POST
path : /api/v1_beta/config/drafts/{draft_id}/deploy
response type: JSON
response: an empty json object
Tornado ‘Event’ Backend API
Send Test Event Endpoint
Endpoint: match an event on the current Tornado Engine configuration
HTTP Method: POST
path : /api/v1_beta/event/current/send
request type: JSON
request example:
{
    "event": {
      "type": "the_event_type",
      "created_ms": 123456,
      "payload": {
        "value_one": "something",
        "value_two": "something_else"
      }
    },
    "process_type": "SkipActions"
}
Where the event has the following structure:
type: The Event type identifier
created_ms: The Event creation timestamp in milliseconds since January 1, 1970 UTC
payload: A Map<String, Value> with event-specific data
process_type: Can be Full or SkipActions:
Full: The event is processed and linked actions are executed
SkipActions: The event is processed but actions are not executed
response type: JSON
response example:
{
 "event": {
   "type": "the_event_type",
   "created_ms": 123456,
   "payload": {
     "value_one": "something",
     "value_two": "something_else"
   }
 },
 "result": {
   "type": "Rules",
   "rules": {
     "rules": {
       "emails_with_temperature": {
         "rule_name": "emails",
         "status": "NotMatched",
         "actions": [],
         "message": null
       },
       "archive_all": {
         "rule_name": "archive_all",
         "status": "Matched",
         "actions": [
           {
             "id": "archive",
             "payload": {
               "archive_type": "one",
               "event": {
                 "created_ms": 123456,
                 "payload": {
                   "value_one": "something",
                   "value_two": "something_else"
                 },
                 "type": "the_event_type"
               }
             }
           }
         ],
         "message": null
       }
     },
     "extracted_vars": {}
   }
 }
}
Endpoint: match an event on a specific Tornado draft
HTTP Method: POST
path : /api/v1_beta/event/drafts/{draft_id}/send
request type: JSON
request/response example: same request and response of the /api/v1_beta/event/current/send endpoint
Tornado ‘RuntimeConfig’ Backend API
These endpoints allow inspecting and changing the tornado configuration at runtime. Please note that whatever configuration change performed with these endpoints will be lost when tornado is restarted.
Get the logger configuration
Endpoint: get the current logger level configuration
HTTP Method: GET
path : /api/v1_beta/runtime_config/logger
response type: JSON
response example:
{
  "level": "info",
  "stdout_enabled": true,
  "apm_enabled": false
}
Set the logger level
Endpoint: set the current logger level configuration
HTTP Method: POST
path : /api/v1_beta/runtime_config/logger/level
response: http status code 200 if the request was performed correctly
request body type: JSON
request body:
{
  "level": "warn,
  tornado=trace"
}
Set the logger stdout output
Endpoint: Enable or disable the logger stdout output
HTTP Method: POST
path : /api/v1_beta/runtime_config/logger/stdout
response: http status code 200 if the request was performed correctly
request body type: JSON
request body:
{
  "enabled": true
}
Set the logger output to Elastic APM
Endpoint: Enable or disable the logger output to Elastic APM
HTTP Method: POST
path : /api/v1_beta/runtime_config/logger/apm
response: http status code 200 if the request was performed correctly
request body type: JSON
request body:
{
  "enabled": true
}
Set the logger configuration with priority to Elastic APM
Endpoint: This will disable the stdout and enable the Elastic APM logger; in addition, the logger level will be set to the one provided, or to “info,tornado=debug” if not present.
HTTP Method: POST
ath : /api/v1_beta/runtime_config/logger/set_apm_priority_configuration
response: http status code 200 if the request was performed correctly
request body type: JSON
request body:
{
  "logger_level": true
}
Set the logger configuration with priority to stdout
Endpoint: This will disable the Elastic APM logger and enable the stdout; in addition, the logger level will be set to the one provided in the configuration file.
HTTP Method: POST
path : /api/v1_beta/runtime_config/logger/set_stdout_priority_configuration
response: http status code 200 if the request was performed correctly
request body type: JSON
request body:
{}
Tornado Backend API v2
The version 2 of the APIs allows for a granular querying of the processing tree, reducing the end-to-end latency with respect to the version 1 of the APIs.
The Tornado Backend APIs v2 furthermore allow for granular authorization on the processing tree for different users.
Tornado ‘Auth’ Backend API
The version 2 of the Tornado APIs require the caller to pass an authorization token in the headers in the format:
Authorization : Bearer TOKEN_HERE
The token should be a base64 encoded JSON with the following user data:
{
  "user": "THE_USER_IDENTIFIER",
  "auths": {
    "PARAM_AUTH_1": {
      "path": [
        "root"
      ],
      "roles": [
        "view",
        "edit",
        "test_event_execute_actions"
      ]
    },
    "PARAM_AUTH_2": {
      "path": [
        "root",
        "filter1",
        "filter2"
      ],
      "roles": [
        "view",
        "test_event_execute_actions"
      ]
    }
  },
  "preferences": {
    "language": "en_US"
  }
}
Tornado ‘Config’ Backend API
The ‘config’ APIs require the caller to pass an authorization token in the headers as in the ‘auth’ API.
Reading the current configuration
These endpoints allow to read the current configuration tree
Endpoint: get the current configuration tree of the root node.
HTTP Method: GET
path : /api/v2_beta/config/active/tree/children/{param_auth}
where {param_auth} is the key of one of the auth fields contained in the authentication header
response type: JSON
request permissions:
To call this endpoint you need the ConfigView permission.
response example:
[
  {
    "type": "Filter",
    "name": "root",
    "rules_count": 60,
    "description": "This is the root node",
    "children_count": 2
  }
]
Endpoint: get the current configuration tree of a specific node. Node names must be separated by a comma.
HTTP Method: GET
path : /api/v2_beta/config/active/tree/children/{param_auth}/root,foo
where {param_auth} is the key of one of the auth fields contained in the authentication header
response type: JSON
request permissions:
To call this endpoint you need the ConfigView permission.
response example:
[
  {
    "type": "Filter",
    "name": "foo",
    "rules_count": 40,
    "description": "This is the foo node",
    "children_count": 4
  }
]
Tornado ‘Rule Details’ Backend API Version 2
Reading a rule details
Endpoint: get single rule details giving the rule name and the ruleset path related to the current configuration tree. The ‘rule details’ APIs require the caller to pass an authorization token in the headers as in the ‘auth’ API.
HTTP Method: GET
path : /api/v2_beta/config/active/rule/details/admins/root,foo,rulesetA/foobar_rule
response type: JSON
response example:
{
    "name":"foobar_rule",
    "description":"foobar_rule description",
    "continue":true,
    "active":true,
    "constraint":{
        "type": "AND",
        "operators": [
            {
              "type": "equal",
              "first": "${event.type}",
              "second": "email"
            }
        ],
        "WITH":{}
    },
    "actions":[
        {
            "id": "Logger",
            "payload": {
                "subject": "${event.payload.subject}",
                "type": "${event.type}"
            }
        }
    ]
}
Tornado ‘Node Details’ Backend API
Reading the current configuration details
Endpoint: The ‘node details’ APIs require the caller to pass an authorization token in the headers as in the ‘auth’ API.
HTTP Method: GET
path : /api/v2_beta/config/active/tree/details/{param_auth}/root,foo
where {param_auth} is the key of one of the auth fields contained in the authentication header
response type: JSON
request permissions:
To call this endpoint you need the ConfigView permission.
response example:
 {
    "type":"Filter",
    "name":"foo",
    "description":"This filter allows events for Linux hosts",
    "active":true,
    "filter":{
        "type":"equals",
        "first":"${event.metadata.os}",
        "second":"linux"
    }
}
Tornado ‘Event’ Backend API
Send Test Event Endpoint V2
Endpoint: match an event on the current Tornado Engine configuration
HTTP Method: POST
path : /api/v2_beta/event/active/{param_auth}
where {param_auth} is the key of one of the auth fields contained in the authentication header
request type: JSON
request permissions:
To call this endpoint with a process_type equal to SkipActions you need at least one of the following permissions:
ConfigView
ConfigEdit
To call this endpoint with a process_type equal to Full you need the TestEventExecuteActions permission in addition to the permissions needed for the SkipActions process_type.
request example:
{
    "event": {
      "type": "the_event_type",
      "created_ms": 123456,
      "payload": {
        "value_one": "something",
        "value_two": "something_else"
      }
    },
    "process_type": "SkipActions"
}
Where the event has the following structure:
type: The Event type identifier
created_ms: The Event creation timestamp in milliseconds since January 1, 1970 UTC
payload: A Map<String, Value> with event-specific data
process_type: Can be Full or SkipActions:
Full: The event is processed and linked actions are executed
SkipActions: The event is processed but actions are not executed
response type: JSON
response example:
{
 "event": {
   "type": "the_event_type",
   "created_ms": 123456,
   "payload": {
     "value_one": "something",
     "value_two": "something_else"
   }
 },
 "result": {
   "type": "Rules",
   "rules": {
     "rules": {
       "emails_with_temperature": {
         "rule_name": "emails",
         "status": "NotMatched",
         "actions": [],
         "message": null
       },
       "archive_all": {
         "rule_name": "archive_all",
         "status": "Matched",
         "actions": [
           {
             "id": "archive",
             "payload": {
               "archive_type": "one",
               "event": {
                 "created_ms": 123456,
                 "payload": {
                   "value_one": "something",
                   "value_two": "something_else"
                 },
                 "type": "the_event_type"
               }
             }
           }
         ],
         "message": null
       }
     },
     "extracted_vars": {}
   }
 }
}
Endpoint: match an event on a specific Tornado draft
HTTP Method: POST
path : /api/v2_beta/event/drafts/{draft_id}/{param_auth}
request type: JSON
request permissions:
To call this endpoint with a process_type equal to SkipActions you need to be the owner of the draft and have the ConfigEdit permission.
To call this endpoint with a process_type equal to Full you need the TestEventExecuteActions permission in addition to the permissions needed for the SkipActions process_type.
request/response example: same request and response of the /api/v2_beta/event/active/{param_auth} endpoint
Tornado ‘Tree Info’ Backend API
Endpoint: The ‘tree info’ APIs require the caller to pass an authorization token in the headers as in the ‘auth’ API.
HTTP Method: GET
path : /api/v2_beta/config/active/tree/info/{param_auth}
where {param_auth} is the key of one of the auth fields contained in the authentication header
response type: JSON
request permissions:
To call this endpoint you need the ConfigView permission.
response example:
{
   "rules_count": 14,
   "filters_count": 2
}
Tornado Engine (Executable)
This crate contains the Tornado Engine executable code.
How It Works
The Tornado Engine executable is a configuration of the engine based on actix and built as a portable executable.
Structure of Tornado Engine
This specific Tornado Engine executable is composed of the following components:
A JSON collector
The engine
The archive executor
The Elasticsearch Executor
The foreach executor
The Icinga2 executor
The Director executor
The Monitoring executor
The logger executor
The script executor
The Smart Monitoring executor
Each component is wrapped in a dedicated actix actor.
This configuration is only one of many possible configurations. Each component has been developed as an independent library, allowing for greater flexibility in deciding whether and how to use it.
At the same time, there are no restrictions that force the use of the components into the same executable. While this is the simplest way to assemble them into a working product, the collectors and executors could reside in their own executables and communicate with the Tornado engine via a remote call. This can be achieved either through a direct TCP or HTTP call, with an RPC technology (e.g., Protobuf, Flatbuffer, or CAP’n’proto), or with a message queue system (e.g., Nats.io or Kafka) in the middle for deploying it as a distributed system.
Tornado API
The Tornado API endpoints allow to interact with a Tornado instance.
More details about the API can be found in the Tornado backend documentation.
Self-Monitoring API
The monitoring endpoints allow you to monitor the health of Tornado. They provide information about the status, activities, logs and metrics of a running Tornado instance. Specifically, they return statistics about latency, traffic, and errors.
Available endpoints:
Ping endpoint
This endpoint returns a simple message “pong - ” followed by the current date in ISO 8601 format.
Details:
name : ping
path : /monitoring/ping
response type: JSON
response example:
{
  "message": "pong - 2019-04-12T10:11:31.300075398+02:00",
}
Metrics endpoint
This endpoint returns tornado metrics in the Prometheus text format Details:
name : metrics/prometheus
path : /monitoring/v1/metrics/prometheus
response type: Prometheus text format
response example:
# HELP events_processed_counter Events processed count
# TYPE events_processed_counter counter
events_processed_counter{app="tornado",event_type="icinga_process-check-result"} 1
# HELP events_processed_duration_seconds Events processed duration
# TYPE events_processed_duration_seconds histogram
events_processed_duration_seconds_bucket{app="tornado",event_type="icinga_process-check-result",le="0.5"} 1
events_processed_duration_seconds_bucket{app="tornado",event_type="icinga_process-check-result",le="0.9"} 1
events_processed_duration_seconds_bucket{app="tornado",event_type="icinga_process-check-result",le="0.99"} 1
events_processed_duration_seconds_bucket{app="tornado",event_type="icinga_process-check-result",le="+Inf"} 1
events_processed_duration_seconds_sum{app="tornado",event_type="icinga_process-check-result"} 0.000696327
events_processed_duration_seconds_count{app="tornado",event_type="icinga_process-check-result"} 1
# HELP events_received_counter Events received count
# TYPE events_received_counter counter
events_received_counter{app="tornado",event_type="icinga_process-check-result",source="http"} 1
# HELP http_requests_counter HTTP requests count
# TYPE http_requests_counter counter
http_requests_counter{app="tornado"} 1
# HELP http_requests_duration_secs HTTP requests duration
# TYPE http_requests_duration_secs histogram
http_requests_duration_secs_bucket{app="tornado",le="0.5"} 1
http_requests_duration_secs_bucket{app="tornado",le="0.9"} 1
http_requests_duration_secs_bucket{app="tornado",le="0.99"} 1
http_requests_duration_secs_bucket{app="tornado",le="+Inf"} 1
http_requests_duration_secs_sum{app="tornado"} 0.001695673
http_requests_duration_secs_count{app="tornado"} 1
The following metrics are provided:
events_received_counter: total number of received events grouped by source (nats, tcp, http) and event typeevents_processed_counter: total number of processed events grouped by event typeevents_processed_duration_seconds_sum: total time spent for event processingevents_processed_duration_seconds_count: total number of processed eventsinvalid_events_received_counter: total number of received event with a not valid format. This can be caused, for example, by a not valid JSON representation or by the missing of mandatory fieldsactions_received_counter: total number of received actions grouped by typeactions_processed_counter: total number of processed actions grouped by type and outcome (failure or success)actions_processing_attempts_counter: total number of attempts to execute an action grouped by type and outcome (failure or success). This number can be greater than the total number of received actions because the execution of a single action can be attempted multiple times based on the defined Retry Strategy
Many other metrics can be derived from these ones, for example:
events_processed_counter - events_received_counter = events waiting to be processed
events_processed_duration_seconds_sum / events_processed_duration_seconds_count = mean processing time for an event
Matcher Engine
The tornado_engine_matcher crate contains the core functions of the Tornado Engine. It defines the logic for parsing Rules and Filters as well as for matching Events.
The Matcher implementation details are available here.
The Processing Tree
The engine logic is defined by a processing tree with two types of nodes:
Filter: A node that contains a filter definition and a set of child nodes
Rule set: A leaf node that contains a set of Rules
A full example of a processing tree is:
root
  |- node_0
  |    |- rule_one
  |    \- rule_two
  |- node_1
  |    |- inner_node
  |    |    \- rule_one
  |    \- filter_two
  \- filter_one
All identifiers of the processing tree (i.e. Rule names, Filter names, and node names) can be composed only of letters, numbers and the “_” (underscore) character.
The configuration of the processing tree is stored on the file system in small structures composed of directories and files in json format; when the processing tree is read to be processed, the Filter and Rule names are automatically inferred from the filenames–excluding the json extension, and the node names from the directory names.
In the tree above, the root node is of type Filter. In fact, it contains the definition of a Filter named filter_one and has two child nodes called node_0 and node_1.
When the matcher receives an Event, it will first check if it matches the filter_one condition; if it does, the matcher will proceed to evaluate its child nodes. If, instead, the filter condition does not match, the process stops and those children are ignored.
A node’s children are processed independently. Thus node_0 and node_1 will be processed in isolation and each of them will be unaware of the existence and outcome of the other one. This process logic is applied recursively to every node.
In the above processing tree, node_0 is a rule set, so when the node is processed, the matcher will evaluate an Event against each rule to determine which one matches and what Actions are generated.
On the contrary, node_1 is another Filter; in this case, the matcher will check if the event verifies the filter condition in order to decide whether to process its internal nodes.
Structure of a Filter
A Filter contains these properties:
filter name: A string value representing a unique Filter identifier. It can be composed only of letters, numbers and the “_” (underscore) character; it corresponds to the filename, stripped from its .json extension.description: A string providing a high-level description of the filter.active: A boolean value; iffalse, the Filter’s children will be ignored.filter: A boolean operator that, when applied to an event, returnstrueorfalse. This operator determines whether an Event matches the Filter; consequently, it determines whether an Event will be processed by the Filter’s inner nodes.
Implicit Filters
If a Filter is omitted, Tornado will automatically infer an implicit filter that passes through all Events. This feature allows for less boiler-plate code when a Filter is only required to blindly forward all Events to the internal rule sets.
For example, if filter_one.json is a Filter that allows all Events to pass through, then this processing tree:
root
  |- node_0
  |    |- ...
  |- node_1
  |    |- ...
  \- filter_one.json
is equivalent to:
root
  |- node_0
  |    |- ...
  \- node_1
       |- ...
Note that in the second tree we removed the filter_one.json file. In this case, Tornado will automatically generate an implicit Filter for the root node, and all incoming Events will be dispatched to each child node.
Filters available by default
The Tornado Processing Tree provides some out of the box Filters, which match all, and only, the Events originated by some given tenant. For more information on tenants in NetEye visit the dedicated page.
These Filters are created at the top level of the Processing Tree, in such a way that it is possible to set up tenant-specific Tornado pipelines.
Given for example a tenant named acme, the matching condition of the
Filter for the acme tenant will be defined as:
{
    "type": "equals",
    "first": "${event.metadata.tenant_id}",
    "second": "acme"
}
Keep in mind that these Filters must never be deleted nor modified, because they will be automatically re-created.
Note
Tornado Filters for tenants, including the Filter for the master tenant,
are only generated if some NetEye Satellites are configured
Structure of a Rule
A Rule is composed of a set of properties, constraints and actions.
Basic Properties
rule name: A string value representing a unique rule identifier. It can be composed only of alphabetical characters, numbers and the “_” (underscore) character.description: A string value providing a high-level description of the rule.continue: A boolean value indicating whether to proceed with the event matching process if the current rule matches.active: A boolean value; iffalse, the rule is ignored.
When the configuration is read from the file system, the rule name is automatically inferred from the filename by removing the extension and everything that precedes the first ‘_’ (underscore) symbol. For example:
0001_rule_one.json -> 0001 determines the execution order, “rule_one” is the rule name
0010_rule_two.json -> 0010 determines the execution order, “rule_two” is the rule name
Constraints
The constraint section contains the tests that determine whether or not an event matches the rule. There are two types of constraints:
WHERE: A set of operators that when applied to an event returns
trueorfalseWITH: A set of regular expressions that extract values from an Event and associate them with named variables
An event matches a rule if and only if the WHERE clause evaluates to
true and all regular expressions in the WITH clause return non-empty
values.
The following operators are available in the WHERE clause. Check also the examples in the remainder of this document to see how to use them.
‘contains’: Evaluates whether the first argument contains the second one. It can be applied to strings, arrays, and maps. The operator can also be called with the alias ‘contain’.
‘containsIgnoreCase’: Evaluates whether the first argument contains, in a case-insensitive way, the string passed as second argument. This operator can also be called with the alias ‘containIgnoreCase’.
‘equals’: Compares any two values (including, but not limited to, arrays, maps) and returns whether or not they are equal. An alias for this operator is ‘equal’.
‘equalsIgnoreCase’: Compares two strings and returns whether or not they are equal in a case-insensitive way. The operator can also be called with the alias ‘equalIgnoreCase’.
‘ge’: Compares two values and returns whether the first value is greater than or equal to the second one. If one or both of the values do not exist, it returns
false.‘gt’: Compares two values and returns whether the first value is greater than the second one. If one or both of the values do not exist, it returns
false.‘le’: Compares two values and returns whether the first value is less than or equal to the second one. If one or both of the values do not exist, it returns
false.‘lt’: Compares two values and returns whether the first value is less than the second one. If one or both of the values do not exist, it returns
false.‘ne’: This is the negation of the ‘equals’ operator. Compares two values and returns whether or not they are different. It can also be called with the aliases ‘notEquals’ and ‘notEqual’.
‘regex’: Evaluates whether a field of an event matches a given regular expression.
‘AND’: Receives an array of operator clauses and returns
trueif and only if all of them evaluate totrue.‘OR’: Receives an array of operator clauses and returns
trueif at least one of the operators evaluates totrue.‘NOT’: Receives one operator clause and returns
trueif the operator clause evaluates tofalse, while it returnsfalseif the operator clause evaluates totrue.
We use the Rust Regex library (see its github project home page ) to evaluate regular expressions provided by the WITH clause and by the regex operator. You can also refer to its dedicated documentation for details about its features and limitations.
Actions
An Action is an operation triggered when an Event matches a Rule.
Reading Event Fields
A Rule can access Event fields through the “${” and “}” delimiters. To do so, the following conventions are defined:
The ‘.’ (dot) char is used to access inner fields.
Keys containing dots are escaped with leading and trailing double quotes.
Double quote chars are not accepted inside a key.
For example, given the incoming event:
{
    "type": "trap",
    "created_ms": 1554130814854,
    "payload":{
        "protocol": "UDP",
        "oids": {
            "key.with.dots": "38:10:38:30.98"
        }
    }
}
The rule can access the event’s fields as follows:
${event.type}: Returns trap${event.payload.protocol}: Returns UDP${event.payload.oids."key.with.dots"}: Returns 38:10:38:30.98${event.payload}: Returns the entire payload${event}: Returns the entire event${event.metadata.key}: Returns the value of the key key from the metadata. The metadata is a special field of an event created by Tornado to store additional information where needed (e.g. the tenant_id, etc.)
String interpolation
An action payload can also contain text with placeholders that Tornado will replace at runtime. The values to be used for the substitution are extracted from the incoming Events following the conventions mentioned in the previous section; for example, using that Event definition, this string in the action payload:
Received a ${event.type} with protocol ${event.payload.protocol}
produces:
*Received a trap with protocol UDP*
Note
Only values of type String, Number, Boolean and null are valid. Consequently, the interpolation will fail, and the action will not be executed, if the value associated with the placeholder extracted from the Event is an Array, a Map, or undefined.
Example of Filters
Using a Filter to Create Independent Pipelines
We can use Filters to organize coherent set of Rules into isolated pipelines.
In this example we will see how to create two independent pipelines, one that receives only events with type ‘email’, and the other that receives only those with type ‘trapd’.
Our configuration directory will look like this::
rules.d
  |- email
  |    |- ruleset
  |    |     |- ... (all rules about emails here)
  |    \- only_email_filter.json
  |- trapd
  |    |- ruleset
  |    |     |- ... (all rules about trapds here)
  |    \- only_trapd_filter.json
  \- filter_all.json
This processing tree has a root Filter filter_all that matches all events. We have also defined two inner Filters; the first, only_email_filter, only matches events of type ‘email’. The other, only_trapd_filter, matches just events of type ‘trap’.
Therefore, with this configuration, the rules defined in email/ruleset receive only email events, while those in trapd/ruleset receive only trapd events.
This configuration can be further simplified by removing the filter_all.json file:
rules.d
  |- email
  |    |- ruleset
  |    |     |- ... (all rules about emails here)
  |    \- only_email_filter.json
  \- trapd
       |- ruleset
       |     |- ... (all rules about trapds here)
       \- only_trapd_filter.json
In this case, in fact, Tornado will generate an implicit Filter for the root node and the runtime behavior will not change.
Below is the content of our JSON Filter files.
Content of filter_all.json (if provided):
{
  "description": "This filter allows every event",
  "active": true
}
Content of only_email_filter.json:
{
  "description": "This filter allows events of type 'email'",
  "active": true,
  "filter": {
    "type": "equals",
    "first": "${event.type}",
    "second": "email"
  }
}
Content of only_trapd_filter.json:
{
  "description": "This filter allows events of type 'trapd'",
  "active": true,
  "filter": {
    "type": "equals",
    "first": "${event.type}",
    "second": "trapd"
  }
}
Examples of Rules and operators
The ‘contains’ Operator
The contains operator is used to check whether the first argument contains the second one.
It applies in three different situations:
The arguments are both strings: Returns true if the second string is a substring of the first one.
The first argument is an array: Returns true if the second argument is contained in the array.
The first argument is a map and the second is a string: Returns true if the second argument is an existing key in the map.
In any other case, it will return false.
Rule example:
{
  "description": "",
  "continue": true,
  "active": true,
  "constraint": {
    "WHERE": {
      "type": "contains",
      "first": "${event.payload.hostname}",
      "second": "linux"
    },
    "WITH": {}
  },
  "actions": []
}
An event matches this rule if in its payload appears an entry with key hostname and whose value is a string that contains linux.
A matching Event is:
{
    "type": "trap",
    "created_ms": 1554130814854,
    "payload":{
        "hostname": "linux-server-01"
    }
}
The ‘containsIgnoreCase’ Operator
The containsIgnoreCase operator is used to check whether the first argument contains the string passed as second argument, regardless of their capital and small letters. In other words, the arguments are compared in a case-insensitive way.
It applies in three different situations:
The arguments are both strings: Returns true if the second string is a case-insensitive substring of the first one
The first argument is an array: Returns true if the array passed as first parameter contains a (string) element which is equal to the string passed as second argument, regardless of uppercase and lowercase letters
The first argument is a map: Returns true if the second argument contains, an existing, case-insensitive, key of the map
In any other case, this operator will return false.
Rule example:
{
  "description": "",
  "continue": true,
  "active": true,
  "constraint": {
    "WHERE": {
      "type": "containsIgnoreCase",
      "first": "${event.payload.hostname}",
      "second": "Linux"
    },
    "WITH": {}
  },
  "actions": []
}
An event matches this rule if in its payload it has an entry with key “hostname” and whose value is a string that contains “linux”, ignoring the case of the strings.
A matching Event is:
{
    "type": "trap",
    "created_ms": 1554130814854,
    "payload":{
        "hostname": "LINUX-server-01"
    }
}
Additional values for hostname that match the rule include: linuX-SERVER-02, LInux-Host-12, Old-LiNuX-FileServer, and so on.
The ‘equals’, ‘ge’, ‘gt’, ‘le’, ‘lt’ and ‘ne’ Operators
The equals, ge, gt, le, lt, ne operators are used to compare two values.
All these operators can work with values of type Number, String, Bool, null and Array.
Warning
Please be extremely careful when using these operators with numbers of type float. The representation of floating point numbers is often slightly imprecise and can lead to unexpected results (for example, see https://www.floating-point-gui.de/errors/comparison/ ).
Example:
{
  "description": "",
  "continue": true,
  "active": true,
  "constraint": {
    "WHERE": {
      "type": "OR",
      "operators": [
        {
          "type": "equals",
          "first": "${event.payload.value}",
          "second": 1000
        },
        {
          "type": "AND",
          "operators": [
            {
              "type": "ge",
              "first": "${event.payload.value}",
              "second": 100
            },
            {
              "type": "le",
              "first": "${event.payload.value}",
              "second": 200
            },
            {
              "type": "ne",
              "first": "${event.payload.value}",
              "second": 150
            },
            {
              "type": "notEquals",
              "first": "${event.payload.value}",
              "second": 160
            }
          ]
        },
        {
          "type": "lt",
          "first": "${event.payload.value}",
          "second": 0
        },
        {
          "type": "gt",
          "first": "${event.payload.value}",
          "second": 2000
        }
      ]
    },
    "WITH": {}
  },
  "actions": []
}
An event matches this rule if event.payload.value exists and one or more of the following conditions hold:
It is equal to 1000
It is between 100 (inclusive) and 200 (inclusive), but not equal to 150 or to 160
It is less than 0 (exclusive)
It is greater than 2000 (exclusive)
A matching Event is:
{
    "type": "email",
    "created_ms": 1554130814854,
    "payload":{
      "value": 110
    }
}
Here are some examples showing how these operators behave:
[{"id":557}, {"one":"two"}]lt3: false (cannot compare different types, e.g. here the first is an array and the second is a number){id: "one"}lt{id: "two"}: false (maps cannot be compared)[["id",557], ["one"]]gt[["id",555], ["two"]]: true (elements in the array are compared recursively from left to right: so here “id” is first compared to “id”, then 557 to 555, returning true before attempting to match “one” and “two”)[["id",557]]gt[["id",555], ["two"]]: true (elements are compared even if the length of the arrays is not the same)truegtfalse: true (the value ‘true’ is evaluated as 1, and the value ‘false’ as 0; consequently, the expression is equivalent to “1 gt 0” which is true)“twelve” gt “two”: false (strings are compared lexically, and ‘e’ comes before ‘o’, not after it)
The ‘equalsIgnoreCase’ Operator
The equalsIgnoreCase operator is used to check whether the strings passed as arguments are equal in a case-insensitive way.
It applies only if both the first and the second arguments are strings. In any other case, the operator will return false.
Rule example:
{
  "description": "",
  "continue": true,
  "active": true,
  "constraint": {
    "WHERE": {
      "type": "equalsIgnoreCase",
      "first": "${event.payload.hostname}",
      "second": "Linux"
    },
    "WITH": {}
  },
  "actions": []
}
An event matches this rule if in its payload it has an entry with key “hostname” and whose value is a string that is equal to “linux”, ignoring the case of the strings.
A matching Event is:
{
    "type": "trap",
    "created_ms": 1554130814854,
    "payload":{
        "hostname": "LINUX"
    }
}
The ‘regex’ Operator
The regex operator is used to check if a string matches a regular expression. The evaluation is performed with the Rust Regex library (see its github project home page )
Rule example:
{
  "description": "",
  "continue": true,
  "active": true,
  "constraint": {
    "WHERE": {
      "type": "regex",
      "regex": "[a-fA-F0-9]",
      "target": "${event.type}"
    },
    "WITH": {}
  },
  "actions": []
}
An event matches this rule if its type matches the regular expression [a-fA-F0-9].
A matching Event is:
{
    "type": "trap0",
    "created_ms": 1554130814854,
    "payload":{}
}
The ‘AND’, ‘OR’, and ‘NOT’ Operators
The and and or operators work on a set of operators, while the not operator works on one single operator. They can be nested recursively to define complex matching rules.
As you would expect:
The and operator evaluates to true if all inner operators match
The or operator evaluates to true if at least an inner operator matches
The not operator evaluates to true if the inner operator does not match, and evaluates to false if the inner operator matches
Example:
{
  "description": "",
  "continue": true,
  "active": true,
  "constraint": {
    "WHERE": {
      "type": "AND",
      "operators": [
        {
          "type": "equals",
          "first": "${event.type}",
          "second": "rsyslog"
        },
        {
          "type": "OR",
          "operators": [
            {
              "type": "equals",
              "first": "${event.payload.body}",
              "second": "something"
            },
            {
              "type": "equals",
              "first": "${event.payload.body}",
              "second": "other"
            }
          ]
        },
        {
          "type": "NOT",
          "operator": {
              "type": "equals",
              "first": "${event.payload.body}",
              "second": "forbidden"
          }
        }
      ]
    },
    "WITH": {}
  },
  "actions": []
}
An event matches this rule if in its payload:
The type is “rsyslog”
AND an entry with key body whose value is wither “something” OR “other”
AND an entry with key body is NOT “forbidden”
A matching Event is:
{
    "type": "rsyslog",
    "created_ms": 1554130814854,
    "payload":{
        "body": "other"
    }
}
A ‘Match all Events’ Rule
If the WHERE clause is not specified, the Rule evaluates to true for each incoming event.
For example, this Rule generates an “archive” Action for each Event:
{
    "description": "",
    "continue": true,
    "active": true,
    "constraint": {
      "WITH": {}
    },
    "actions": [
      {
        "id": "archive",
        "payload": {
          "event": "${event}",
          "archive_type": "one"
        }
      }
    ]
}
The ‘WITH’ Clause
The WITH clause generates variables extracted from the Event based on regular expressions. These variables can then be used to populate an Action payload.
All variables declared by a Rule must be resolved, or else the Rule will not be matched.
Two simple rules restrict the access and use of the extracted variables:
Because they are evaluated after the WHERE clause is parsed, any extracted variables declared inside the WITH clause are not accessible by the WHERE clause of the very same rule
A rule can use extracted variables declared by other rules, even in its WHERE clause, provided that:
The two rules must belong to the same rule set
The rule attempting to use those variables should be executed after the one that declares them
The rule that declares the variables should also match the event
The syntax for accessing an extracted variable has the form:
_variables.[.RULE_NAME].VARIABLES_NAME
If the RULE_NAME is omitted, the current rule name is automatically selected.
Example:
{
  "description": "",
  "continue": true,
  "active": true,
  "constraint": {
    "WHERE": {
          "type": "equals",
          "first": "${event.type}",
          "second": "trap"
    },
    "WITH": {
      "sensor_description": {
        "from": "${event.payload.line_5}",
        "regex": {
          "match": "(.*)",
          "group_match_idx": 0
        }
      },
      "sensor_room": {
        "from": "${event.payload.line_6}",
        "regex": {
          "match": "(.*)",
          "group_match_idx": 0
        }
      }
    }
  },
  "actions": [
    {
      "id": "nagios",
      "payload": {
        "host": "bz-outsideserverroom-sensors",
        "service": "motion_sensor_port_4",
        "status": "Critical",
        "host_ip": "${event.payload.host_ip}",
        "room": "${_variables.sensor_room}",
        "message": "${_variables.sensor_description}"
      }
    }
  ]
}
This Rule matches only if its type is “trap” and it is possible to extract the two variables “sensor_description” and “sensor_room” defined in the WITH clause.
An Event that matches this Rule is:
{
  "type": "trap",
  "created_ms": 1554130814854,
  "payload":{
    "host_ip": "10.65.5.31",
    "line_1":  "netsensor-outside-serverroom.wp.lan",
    "line_2":  "UDP: [10.62.5.31]:161->[10.62.5.115]",
    "line_3":  "DISMAN-EVENT-MIB::sysUpTimeInstance 38:10:38:30.98",
    "line_4":  "SNMPv2-MIB::snmpTrapOID.0 SNMPv2-SMI::enterprises.14848.0.5",
    "line_5":  "SNMPv2-SMI::enterprises.14848.2.1.1.7.0 38:10:38:30.98",
    "line_6":  "SNMPv2-SMI::enterprises.14848.2.1.1.2.0 \"Outside Server Room\""
  }
}
It will generate this Action:
{
  "id": "nagios",
  "payload": {
    "host": "bz-outsideserverroom-sensors",
    "service": "motion_sensor_port_4",
    "status": "Critical",
    "host_ip": "10.65.5.31",
    "room": "SNMPv2-SMI::enterprises.14848.2.1.1.7.0 38:10:38:30.98",
    "message": "SNMPv2-SMI::enterprises.14848.2.1.1.2.0 \"Outside Server Room\""
  }
}
The ‘WITH’ Clause - Configuration details
As already seen in the previous section, the WITH clause generates variables extracted from the Event using regular expressions. There are multiple ways of configuring those regexes to obtain the desired result.
Common entries to all configurations:
from: An expression that determines to which value to apply the extractor regex;
modifiers_post: A list of String modifiers to post-process the extracted value. See following section for additional details.
In addition, three parameters combined will define the behavior of an extractor:
all_matches: whether the regex will loop through all the matches or only the first one will be considered. Accepted values are true and false. If omitted, it defaults to false
match, named_match or single_key_match: a string value representing the regex to be executed. In detail:
match is used in case of an index-based regex,
named_match is used when named groups are present.
single_key_match is used to search in a map for a key that matches the regex. In case of a match, the extracted variable will be the value of the map associated with that key that matched the regex. This match will fail if more than one key matches the defined regex.
Note that all these values are mutually exclusive.
group_match_idx: valid only in case of an index-based regex. It is a positive numeric value that indicates which group of the match has to be extracted. If omitted, an array with all groups is returned.
To show how they work and what is the produced output, from now on, we’ll use this hypotetical email body as input:
A critical event has been received:

STATUS: CRITICAL HOSTNAME: MYVALUE2 SERVICENAME: MYVALUE3
STATUS: OK HOSTNAME: MYHOST SERVICENAME: MYVALUE41231
Our objective is to extract from it information about the host status and name, and the service name. We show how using different extractors leads to different results.
Option 1
{
  "WITH": {
      "server_info": {
        "from": "${event.payload.email.body}",
        "regex": {
          "all_matches": false,
          "match": "STATUS:\\s+(.*)\\s+HOSTNAME:\\s+(.*)SERVICENAME:\\s+(.*)",
          "group_match_idx": 1
        }
      }
  }
}
This extractor:
processes only the first match because all_matches is false
uses an index-based regex specified by match
returns the group of index 1
In this case the output will be the string “CRITICAL”.
Please note that, if the group_match_idx was 0, it would have returned “STATUS: CRITICAL HOSTNAME: MYVALUE2 SERVICENAME: MYVALUE3” as in any regex the group with index 0 always represents the full match.
Option 2
{
  "WITH": {
      "server_info": {
        "from": "${event.payload.email.body}",
        "regex": {
          "all_matches": false,
          "match": "STATUS:\\s+(.*)\\s+HOSTNAME:\\s+(.*)SERVICENAME:\\s+(.*)"
        }
      }
  }
}
This extractor:
processes only the first match because all_matches is false
uses an index-based regex specified by match
returns an array with all groups of the match because group_match_idx is omitted.
In this case the output will be an array of strings:
[
  "STATUS: CRITICAL HOSTNAME: MYVALUE2 SERVICENAME: MYVALUE3",
  "CRITICAL",
  "MYVALUE2",
  "MYVALUE3"
]
Option 3
{
  "WITH": {
      "server_info": {
        "from": "${event.payload.email.body}",
        "regex": {
          "all_matches": true,
          "match": "STATUS:\\s+(.*)\\s+HOSTNAME:\\s+(.*)SERVICENAME:\\s+(.*)",
          "group_match_idx": 2
        }
      }
  }
}
This extractor:
processes all matches because all_matches is true
uses an index-based regex specified by match
for each match, returns the group of index 2
In this case the output will be an array of strings:
[
  "MYVALUE2", <-- group of index 2 of the first match
  "MYHOST"    <-- group of index 2 of the second match
]
Option 4
{
  "WITH": {
      "server_info": {
        "from": "${event.payload.email.body}",
        "regex": {
          "all_matches": true,
          "match": "STATUS:\\s+(.*)\\s+HOSTNAME:\\s+(.*)SERVICENAME:\\s+(.*)"
        }
      }
  }
}
This extractor:
processes all matches because all_matches is true
uses an index-based regex specified by match
for each match, returns an array with all groups of the match because group_match_idx is omitted.
In this case the output will be an array of arrays of strings:
[
  [
    "STATUS: CRITICAL HOSTNAME: MYVALUE2 SERVICENAME: MYVALUE3",
    "CRITICAL",
    "MYVALUE2",
    "MYVALUE3"
  ],
  [
    "STATUS: OK HOSTNAME: MYHOST SERVICENAME: MYVALUE41231",
    "OK",
    "MYHOST",
    "MYVALUE41231"
  ]
]
The inner array, in position 0, contains all the groups of the first match while the one in position 1 contains the groups of the second match.
Option 5
{
  "WITH": {
      "server_info": {
        "from": "${event.payload.email.body}",
        "regex": {
          "named_match": "STATUS:\\s+(?P<STATUS>.*)\\s+HOSTNAME:\\s+(?P<HOSTNAME>.*)SERVICENAME:\\s+(?P<SERVICENAME>.*)"
        }
      }
  }
}
This extractor:
processes only the first match because all_matches is omitted
uses a regex with named groups specified by named_match
In this case the output is an object where the group names are the property keys:
{
  "STATUS": "CRITICAL",
  "HOSTNAME": "MYVALUE2",
  "SERVICENAME: "MYVALUE3"
}
Option 6
{
  "WITH": {
      "server_info": {
        "from": "${event.payload.email.body}",
        "regex": {
          "all_matches": true,
          "named_match": "STATUS:\\s+(?P<STATUS>.*)\\s+HOSTNAME:\\s+(?P<HOSTNAME>.*)SERVICENAME:\\s+(?P<SERVICENAME>.*)"
        }
      }
  }
 }
This extractor:
processes all matches because all_matches is true
uses a regex with named groups specified by named_match
In this case the output is an array that contains one object for each match:
[
  {
    "STATUS": "CRITICAL",
    "HOSTNAME": "MYVALUE2",
    "SERVICENAME: "MYVALUE3"
  },
  {
    "STATUS": "OK",
    "HOSTNAME": "MYHOST",
    "SERVICENAME: "MYVALUE41231"
  },
]
The ‘WITH’ Clause - Post Modifiers
The WITH clause can include a list of String modifiers to post-process the extracted value. The available modifiers are:
Lowercase: it converts the resulting String to lower case. Syntax:
{
    "type": "Lowercase"
}
Map: it maps a string to another string value. Syntax:
{
      "type": "Map",
      "mapping": {
        "Critical": "2",
        "Warning": "1",
        "Clear": "0",
        "Major": "2",
        "Minor": "1"
      },
      "default_value": "3"
}
The
default_valueis optional; when provided, it is used to map values that do not have a corresponding key in themappingfield. When not provided, the extractor will fail if a specific mapping is not found.ReplaceAll: it returns a new string with all matches of a substring replaced by the new text; the
findproperty is parsed as a regex ifis_regexis true, otherwise it is evaluated as a static string. Syntax:{ "type": "ReplaceAll", "find": "the string to be found", "replace": "to be replaced with", "is_regex": false }
In addition, when
is_regexis true, is possible to interpolate the regex captured groups in thereplacestring, using the$<position>syntax, for example:{ "type": "ReplaceAll", "find": "(?P<lastname>[^,\\s]+),\\s+(?P<firstname>\\S+)", "replace": "firstname: $2, lastname: $1", "is_regex": true }
Valid forms of the
replacefield are:extract from event:
${events.payload.hostname_ext}use named groups from regex:
$digits and otheruse group positions from regex:
$1 and other
ToNumber: it transforms the resulting String into a number. Syntax:
{
    "type": "ToNumber"
}
Trim: it trims the resulting String. Syntax:
{
    "type": "Trim"
}
A full example of a WITH clause using modifiers is:
{
  "WITH": {
      "server_info": {
       "from": "${event.payload.email.body}",
        "regex": {
          "all_matches": false,
          "match": "STATUS:\s+(.*)\s+HOSTNAME:\s+(.*)SERVICENAME:\s+(.*)",
          "group_match_idx": 1
        },
        "modifiers_post": [
            {
              "type": "Lowercase"
            },
            {
              "type": "ReplaceAll",
              "find": "to be found",
              "replace": "to be replaced with",
              "is_regex": false
            },
            {
              "type": "Trim"
            }
        ]
       }
     }
  }
This extractor has three modifiers that will be applied to the extracted value. The modifiers are applied in the order they are declared, so the extracted string will be transformed in lowercase, then some text replaced, and finally, the string will be trimmed.
Complete Rule Example 1
An example of a valid Rule in a JSON file is:
{
  "description": "This matches all emails containing a temperature measurement.",
  "continue": true,
  "active": true,
  "constraint": {
    "WHERE": {
      "type": "AND",
      "operators": [
        {
          "type": "equals",
          "first": "${event.type}",
          "second": "email"
        }
      ]
    },
    "WITH": {
      "temperature": {
        "from": "${event.payload.body}",
        "regex": {
          "match": "[0-9]+\\sDegrees",
          "group_match_idx": 0
        }
      }
    }
  },
  "actions": [
    {
      "id": "Logger",
      "payload": {
        "type": "${event.type}",
        "subject": "${event.payload.subject}",
        "temperature:": "The temperature is: ${_variables.temperature} degrees"
      }
    }
  ]
}
This creates a Rule with the following characteristics:
Its unique name is ‘emails_with_temperature’. There cannot be two rules with the same name.
An Event matches this Rule if, as specified in the WHERE clause, it has type “email”, and as requested by the WITH clause, it is possible to extract the “temperature” variable from the “event.payload.body” with a non-null value.
If an Event meets the previously stated requirements, the matcher produces an Action with id “Logger” and a payload with the three entries type, subject and temperature.
Director Executor
The Director Executor is an application that extracts data from a Tornado Action and prepares it to be sent to the Icinga Director REST API.
How It Works
This executor expects a Tornado Action to include the following elements in its payload:
An action_name: The Director action to perform.
An action_payload (optional): The payload of the Director action.
An icinga2_live_creation (optional): Boolean value, which determines whether to create the specified Icinga Object also in Icinga2.
Valid values for action_name are:
create_host: creates an object of type
hostin the Directorcreate_service: creates an object of type
servicein the Director
The action_payload should contain at least all mandatory parameters expected by the Icinga Director REST API for the type of object you want to create.
An example of a valid Tornado Action is:
{
    "id": "director",
    "payload": {
        "action_name": "create_host",
        "action_payload": {
          "object_type": "object",
          "object_name": "my_host_name",
          "address": "127.0.0.1",
          "check_command": "hostalive",
          "vars": {
            "location": "Bolzano"
          }
        },
        "icinga2_live_creation": true
    }
}
Logger Executor
An Executor that logs received Actions.
Script Executor
An executor that runs custom shell scripts on a Unix-like system.
How It Works
To be correctly processed by this executor, an Action should provide two entries in its payload: the path to a script on the local filesystem of the executor process, and all the arguments to be passed to the script itself.
The script path is identified by the payload key script. It is important to verify that the executor has both read and execute rights at that path.
The script arguments are identified by the payload key args; if present, they are passed as command line arguments when the script is executed.
An example of a valid Action is:
{
    "id": "script",
    "payload" : {
        "script": "./usr/script/my_script.sh",
        "args": [
            "tornado",
            "rust"
        ]
    }
}
In this case the executor will launch the script my_script.sh with the arguments “tornado” and “rust”. Consequently, the resulting command will be:
./usr/script/my_script.sh tornado rust
Other Ways of Passing Arguments
There are different ways to pass the arguments for a script:
Passing arguments as a String:
{
  "id": "script",
  "payload" : {
      "script": "./usr/script/my_script.sh",
      "args": "arg_one arg_two -a --something else"
  }
}
If args is a String, the entire String is appended as a single argument to the script. In this case the resulting command will be:
./usr/script/my_script.sh "arg_one arg_two -a --something else"Passing arguments in an array:
{
  "id": "script",
  "payload" : {
      "script": "./usr/script/my_script.sh",
      "args": [
          "--arg_one tornado",
          "arg_two",
          true,
          100
      ]
  }
}
Here the argument’s array elements are passed as four arguments to the script in the exact order they are declared. In this case the resulting command will be:
./usr/script/my_script.sh "--arg_one tornado" arg_two true 100
Passing arguments in a map:
{
  "id": "script",
  "payload" : {
      "script": "./usr/script/my_script.sh",
      "args": {
        "arg_one": "tornado",
        "arg_two": "rust"
    }
  }
}
When arguments are passed in a map, each entry in the map is considered to be a (option key, option value) pair. Each pair is passed to the script using the default style to pass options to a Unix executable which is –key followed by the value. Consequently, the resulting command will be:
./usr/script/my_script.sh --arg_one tornado --arg_two rust
Please note that ordering is not guaranteed to be preserved in this case, so the resulting command line could also be:
./usr/script/my_script.sh --arg_two rust --arg_one tornado
Thus if the order of the arguments matters, you should pass them using either the string- or the array-based approach.
Passing no arguments:
{
  "id": "script",
  "payload" : {
      "script": "./usr/script/my_script.sh"
  }
}
Since arguments are not mandatory, they can be omitted. In this case the resulting command will simply be:
./usr/script/my_script.sh
Monitoring Executor
The Monitoring Executor is an executor that permits to perform Icinga
process check results also in the case that the Icinga object for
which you want to perform the process check result does not yet
exist.
This is done by means of executing the action process check result
with the Icinga Executor, and by executing the actions
create_host/create_service with the Director Executor, in case
the underlying Icinga objects do not yet exist in Icinga.
Warning
The Monitoring Executor requires the live-creation feature of the Icinga Director to be exposed in the REST API. If this is not the case, the actions of this executor will always fail in case the Icinga Objects are not already present in Icinga2.
How It Works
This executor expects a Tornado Action to include the following elements in its payload:
An action_name: The Monitoring action to perform.
A process_check_result_payload: The payload for the Icinga2
process check resultaction.A host_creation_payload: The payload which will be sent to the Icinga Director REST API for the host creation.
A service_creation_payload: The payload which will be sent to the Icinga Director REST API for the service creation (mandatory only in case action_name is
create_and_or_process_service_passive_check_result).
Valid values for action_name are:
create_and_or_process_host_passive_check_result: sets the
passive check resultfor ahost, and, if necessary, it also creates the host.create_and_or_process_service_passive_check_result: sets the
passive check resultfor aservice, and, if necessary, it also creates the service.
The process_check_result_payload should contain at least all
mandatory parameters expected by the Icinga API to perform the action.
The object on which you want to set the passive check result must be
specified with the field host in case of action
create_and_or_process_host_passive_check_result, and service in
case of action create_and_or_process_service_passive_check_result
(e.g. specifying a set of objects on which to apply the
passive check result with the parameter filter is not valid)
The host_creation_payload should contain at least all mandatory parameters expected by the Icinga Director REST API to perform the creation of a host.
The servie_creation_payload should contain at least all mandatory parameters expected by the Icinga Director REST API to perform the creation of a service.
An example of a valid Tornado Action is:
{
  "id": "monitoring",
  "payload": {
    "action_name": "create_and_or_process_service_passive_check_result",
    "process_check_result_payload": {
      "exit_status": "2",
      "plugin_output": "Output message",
      "service": "myhost!myservice",
      "type": "Service"
    },
    "host_creation_payload": {
      "object_type": "Object",
      "object_name": "myhost",
      "address": "127.0.0.1",
      "check_command": "hostalive",
      "vars": {
        "location": "Rome"
      }
    },
    "service_creation_payload": {
      "object_type": "Object",
      "host": "myhost",
      "object_name": "myservice",
      "check_command": "ping"
    }
  }
}
The flowchart shown in Fig. 113 helps to understand the behaviour of the Monitoring Executor in relation to Icinga2 and Icinga Director REST APIs.
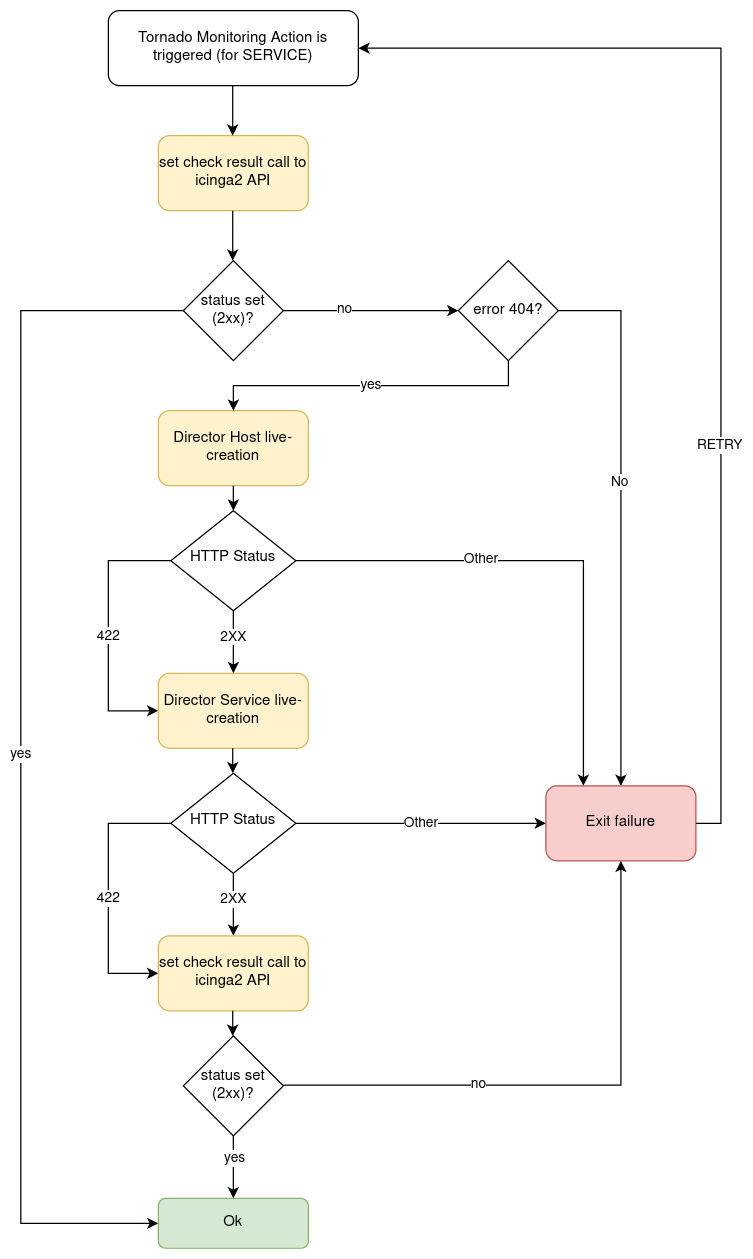
Fig. 113 Flowchart of Monitoring Executor.
Foreach Executor
An Executor that loops through a set of data and executes a list of actions for each entry.
How it Works
The Foreach executor extracts all values from an array of elements and injects each value to a list of action under the item key.
It has two mandatory configuration entries in its payload:
target: the array of elements
actions: the array of action to execute
For example, given this rule definition:
{
  "name": "do_something_foreach_value",
  "description": "This uses a foreach loop",
  "continue": true,
  "active": true,
  "constraint": {
    "WITH": {}
  },
  "actions": [
    {
      "id": "foreach",
      "payload": {
        "target": "${event.payload.values}",
        "actions": [
          {
            "id": "logger",
            "payload": {
              "source": "${event.payload.source}",
              "value": "the value is ${item}"
            }
          },
          {
            "id": "archive",
            "payload": {
              "event": "${event}",
              "item_value": "${item}"
            }
          }
        ]
      }
    }
  ]
}
When an event with this payload is received:
{
  "type": "some_event",
  "created_ms": 123456,
  "payload":{
    "values": ["ONE", "TWO", "THREE"],
    "source": "host_01"
  }
}
Then the target of the foreach action is the array
["ONE", "TWO", "THREE"]; consequently, each one of the two inner
actions is executed three times; the first time with item = “ONE”,
then with item = “TWO” and, finally, with item = “THREE”.
Archive Executor
The Archive Executor is an executor that writes the Events from the received Actions to a file.
Requirements and Limitations
The archive executor can only write to locally mounted file systems. In addition, it needs read and write permissions on the folders and files specified in its configuration.
Configuration
The archive executor has the following configuration options:
file_cache_size: The number of file descriptors to be cached. You can improve overall performance by keeping files from being continuously opened and closed at each write.
file_cache_ttl_secs: The Time To Live of a file descriptor. When this time reaches 0, the descriptor will be removed from the cache.
base_path: A directory on the file system where all logs are written. Based on their type, rule Actions received from the Matcher can be logged in subdirectories of the base_path. However, the archive executor will only allow files to be written inside this folder.
default_path: A default path where all Actions that do not specify an
archive_typein the payload are logged.paths: A set of mappings from an archive_type to an
archive_path, which is a subpath relative to the base_path. The archive_path can contain variables, specified by the syntax${parameter_name}, which are replaced at runtime by the values in the Action’s payload.
The archive path serves to decouple the type from the actual subpath, allowing you to write Action rules without worrying about having to modify them if you later change the directory structure or destination paths.
As an example of how an archive_path is computed, suppose we have the following configuration:
base_path =  "/tmp"
default_path = "/default/out.log"
file_cache_size = 10
file_cache_ttl_secs = 1

[paths]
"type_one" = "/dir_one/file.log"
"type_two" = "/dir_two/${hostname}/file.log"
and these three incoming actions:
action_one:
{
    "id": "archive",
    "payload": {
        "archive_type": "type_one",
        "event": "__the_incoming_event__"
    }
}
action_two:
{
    "id": "archive",
    "payload": {
        "archive_type": "type_two",
        "hostname": "net-test",
        "event": "__the_incoming_event__"
    }
}
action_three:
{
    "id": "archive",
    "payload": {
        "event": "__the_incoming_event__"
    }
}
then:
action_one will be archived in /tmp/dir_one/file.log
action_two will be archived in /tmp/dir_two/net-test/file.log
action_three will be archived in /tmp/default/out.log
How it Works
The archive executor expects an Action to include the following elements in the payload:
An event: The Event to be archived should be included in the payload under the key
event.An archive type (optional): The archive type is specified in the payload under the key
archive_type.
When an archive_type is not specified, the default_path is used (as in
action_three). Otherwise, the executor will use the archive_path in the
paths configuration corresponding to the archive_type key
(action_one and action_two).
When an archive_type is specified but there is no corresponding key in
the mappings under the paths configuration, or it is not possible to
resolve all path parameters, then the Event will not be archived.
Instead, the archiver will return an error.
The Event from the payload is written into the log file in JSON format, one event per line.
Elasticsearch Executor
The Elasticsearch Executor is a functionality that extracts data from a Tornado Action and sends it to Elasticsearch.
How It Works
The executor expects a Tornado Action that includes the following elements in its payload:
An endpoint : The Elasticsearch endpoint which Tornado will call to create the Elasticsearch document.
An index : The name of the Elasticsearch index in which the document will be created.
An data: The content of the document that will be sent to Elasticsearch.
(optional) An auth: a method of authentication, see next section.
An example of a valid Tornado Action is a json document like this:
{
    "id": "elasticsearch",
    "payload": {
        "endpoint": "http://localhost:9200",
        "index": "tornado-example",
        "data": {
            "user" : "kimchy",
            "post_date" : "2009-11-15T14:12:12",
            "message" : "trying out Elasticsearch"
        }
    }
}
The Elasticsearch Executor will create a new document in the specified Elasticsearch index for each action executed; also the specified index will be created if it does not already exist.
In the above json document, no authentication is specified, therefore
the default authentication method created during the executor creation
is used. This method is saved in a tornado configuration file
(elasticsearch_executor.toml) and can be overridden for each Tornado
Action, as described in the next section.
Elasticsearch authentication
When the Elasticsearch executor is created, a default authentication method can be specified and will be used to authenticate to Elasticsearch, if not differently specified by the action. On the contrary, if a default method is not defined at creation time, then each action that does not specify an authentication method will fail.
To use a specific authentication method the action should include the
auth field with either of the following authentication types:
None or PemCertificatePath, like shown in the following
examples.
None: the client connects to Elasticsearch without authentication
Example:
{
    "id": "elasticsearch",
    "payload": {
        "index": "tornado-example",
        "endpoint": "http://localhost:9200",
        "data": {
            "user": "myuser"
        },
        "auth": {
            "type": "None"
        }
    }
}
PemCertificatePath: the client connects to Elasticsearch using the PEM certificates read from the local file system. When this method is used, the following information must be provided:
certificate_path: path to the public certificate accepted by Elasticsearch
private_key_path: path to the corresponding private key
ca_certificate_path: path to CA certificate needed to verify the identity of the Elasticsearch server
Example:
{
    "id": "elasticsearch",
    "payload": {
        "index": "tornado-example",
        "endpoint": "http://localhost:9200",
        "data": {
            "user": "myuser"
        },
        "auth": {
            "type": "PemCertificatePath",
            "certificate_path": "/path/to/tornado/conf/certs/tornado.crt.pem",
            "private_key_path": "/path/to/tornado/conf/certs/private/tornado.key.pem",
            "ca_certificate_path": "/path/to/tornado/conf/certs/root-ca.crt"
        }
    }
}
Icinga2 Executor
The Icinga2 Executor is an executor that extracts data from a Tornado Action and prepares it to be sent to the Icinga2 API.
How It Works
This executor expects a Tornado Action to include the following elements in its payload:
An icinga2_action_name: The Icinga2 action to perform.
An icinga2_action_payload (optional): The parameters of the Icinga2 action.
The icinga2_action_name should match one of the existing Icinga2 actions.
The icinga2_action_payload should contain at least all mandatory parameters expected by the specific Icinga2 action.
An example of a valid Tornado Action is:
{
    "id": "icinga2",
    "payload": {
        "icinga2_action_name": "process-check-result",
        "icinga2_action_payload": {
            "exit_status": "${event.payload.exit_status}",
            "plugin_output": "${event.payload.plugin_output}",
            "filter": "host.name==\"example.localdomain\"",
            "type": "Host"
        }
    }
}
Smart Monitoring Check Result Executor
The Smart Monitoring Check Result Executor permits to perform an Icinga
process check results also in case the Icinga object for which you
want to carry out that action does not exist.
This is done by first running the action process check result with
the Icinga Executor, and then, in case the underlying Icinga objects do
not exist in Icinga, the actions create_host/create_service with
the Director Executor.
Warning
The Smart Monitoring Check Result Executor requires the live-creation feature of the Icinga Director to be exposed in the REST API. If this is not the case, the actions of this executor will always fail in case the Icinga Objects are not already present in Icinga2.
Note however, that the Icinga agent cannot be created live using Smart Monitoring Executor because it always requires a defined endpoint in the configuration which is not possible since the Icinga API doesn’t support live-creation of an endpoint.
How It Works
This executor expects a Tornado Action to include the following elements in its payload:
A check_result: The basic data to build the Icinga2
process check resultaction payload.A host: The data to build the payload which will be sent to the Icinga Director REST API for the host creation.
A service: The data to build the payload which will be sent to the Icinga Director REST API for the service creation (optional).
The check_result should contain all mandatory parameters expected by the Icinga API except the following ones that are automatically filled by the executor:
hostservicetype
The host and service should contain all mandatory parameters expected by the Icinga Director REST API to perform the creation of a host and/or a service, except:
object_type
The service key is optional. When it is included in the action
payload, the executor will invoke the process check results call to
set the status of a service; otherwise, it will set the one of a host.
An example of a valid Tornado Action is to set the status of the service
myhost|myservice:
{
  "id": "smart_monitoring_check_result",
  "payload": {
    "check_result": {
      "exit_status": "2",
      "plugin_output": "Output message"
    },
    "host": {
      "object_name": "myhost",
      "address": "127.0.0.1",
      "check_command": "hostalive",
      "vars": {
        "location": "Rome"
      }
    },
    "service": {
       "object_name": "myservice",
       "check_command": "ping"
    }
  }
}
By simply removing the service key, the same action will set the
status of the host myhost:
{
  "id": "smart_monitoring_check_result",
  "payload": {
    "check_result": {
      "exit_status": "2",
      "plugin_output": "Output message"
    },
    "host": {
      "object_name": "myhost",
      "address": "127.0.0.1",
      "check_command": "hostalive",
      "vars": {
        "location": "Rome"
      }
    }
  }
}
The flowchart shown in Fig. 113 helps to understand the behaviour of the Monitoring Executor in relation to Icinga2 and Icinga Director REST APIs.
Retry logic
When a new object is created, after the call to the
process_check_result the executor calls the Icinga /v1/objects
API to check whether the new object is still in PENDING state. In
case the object is found to be pending, the executor will call again the
process_check_result API, for a predefined number of attempts, until
the check to the object state returns that it is not PENDING
anymore.
Common Logger
The tornado_common_logger crate contains the logger configuration for the Tornado components.
The configuration is based on three entries:
level: A list of comma separated logger verbosity levels. Valid values for a level are: trace, debug, info, warn, and error. If only one level is provided, this is used as global logger level. Otherwise, a list of per package levels can be used. E.g.:
level=info: the global logger level is set to infolevel=warn,tornado=debug: the global logger level is set to warn, the tornado package logger level is set to debug
stdout-output: A boolean value that determines whether the Logger should print to standard output. Valid values are true and false.
file-output-path: An optional string that defines a file path in the file system. If provided, the Logger will append any output to that file.
The configuration subsection logger.tracing_elastic_apm allows to configure the connection to Elastic APM for the tracing functionality. The following entries can be configured:
__apm_output__: Whether the Logger data should be sent to the Elastic APM Server. Valid values are true and false.
__apm_server_url__: The url of the Elastic APM Server.
__apm_server_api_credentials.id__: (Optional) the ID of the Api Key for authenticating to the Elastic APM server.
__apm_server_api_credentials.key__: (Optional) the key of the Api Key for authenticating to the Elastic APM server. If apm_server_api_credentials.id and apm_server_api_credentials.key are not provided, they will be read from the file <config_dir>/apm_server_api_credentials.json
In Tornado executables, the Logger configuration is usually defined with command line parameters managed by structopt. In that case, the default level is set to warn, stdout-output is disabled and the file-output-path is empty.
For example:
./tornado --level=info --stdout-output --file-output-path=/tornado/log
Matcher Engine Implementation Details
Matcher Crate
The Matcher crate contains the core logic of the Tornado Engine. It is in charge of: - Receiving events from the collectors - Processing incoming events and detecting which Filter and Rule they satisfy - Triggering the expected actions
Due to its strategic position, its performance is of utmost importance for global throughput.
The code’s internal structure is kept simple on purpose, and the final objective is reached by splitting the global process into a set of modular, isolated and well-tested blocks of logic. Each “block” communicates with the others through a well-defined API, which at the same time hides its internal implementation.
This modularization effort is twofold; first, it minimizes the risk that local changes will have a global impact; and second, it separates functional from technical complexity, so that increasing functional complexity does not result in increasing code complexity. As a consequence, the maintenance and evolutionary costs of the code base are expected to be linear in the short, mid- and long term.
At a very high level view, when the matcher initializes, it follows these steps:
Configuration (see the code in the “config” module): The configuration phase loads a set of files from the file system. Each file is a Filter or a Rule in JSON format. The outcome of this step is a processing tree composed of Filter and Rule configurations created from the JSON files.
Validation (see the code in the “validator” module): The Validator receives the processing tree configuration and verifies that all nodes respect a set of predefined constraints (e.g., the identifiers cannot contain dots). The output is either the same processing tree as the input, or else an error.
Match Preparation (see the code in the “matcher” module): The Matcher receives the processing tree configuration, and for each node:
if the node is a Filter:
Builds the Accessors for accessing the event properties using the AccessorBuilder (see the code in the “accessor” module).
Builds an Operator for evaluating whether an event matches the Filter itself (using the OperatorBuilder, code in the “operator” module).
if the node is a rule:
Builds the Accessors for accessing the event properties using the AccessorBuilder (see the code in the “accessor” module).
Builds the Operator for evaluating whether an event matches the “WHERE” clause of the rule (using the OperatorBuilder, code in the “operator” module).
Builds the Extractors for generating the user-defined variables using the ExtractorBuilder (see the code in the “extractor” module). This step’s output is an instance of the Matcher that contains all the required logic to process an event against all the defined rules. A matcher is stateless and thread-safe, thus a single instance can be used to serve the entire application load.
Listening: Listen for incoming events and then match them against the stored Filters and Rules.
Tornado Monitoring and Statistics
Tornado Engine performance metrics are exposed via Tornado APIs and periodically collected by a dedicated telegraf instance telegraf_tornado_monitoring.service. Metrics are stored into the database master_tornado_monitoring in InfluxDB.
Tornado Monitoring and Statistics gives an insight about what data Tornado is processing and how. These information can be useful in several scenarios, including workload inspection, identification of bottlenecks, and issue debugging. A common use case is to identify performance-related issues: for example a difference between the amount of events received and events processed by Tornado may identify a performance problem because Tornado does not have enough resources to handle the current workload.
Examples of collected metrics are:
events_processed_counter: total amount of event processed by Tornado Engine
events_received_counter: total amount of events received by Tornado Engine through all collectors
actions_processed_counter: total amount of actions executed by Tornado Engine
Metrics will be automatically deleted according to the selected retention policy.
The user can configure Tornado Monitoring and Statistics via GUI under . Two parameters are available:
Tornado Monitoring Retention Policy: defines the number of days for which metrics are retained in InfluxDB and defaults to 7 days, after which data will be no longer available.
Tornado Monitoring Polling Interval: sets how often the collector queries the Tornado APIs to gather metrics and defaults to 5 seconds.
To apply changes you have to either run neteye_secure_install for both options or execute /usr/share/neteye/tornadocarbon/scripts/apply_tornado_monitoring_retention_policy.sh or /usr/share/neteye/tornadocarbon/scripts/apply_tornado_monitoring_polling_interval.sh, according to the parameter changed.
Note
On a NetEye Cluster, execute the command on the node where icingaweb2 is active.
Jobs
The Icinga Director Background Daemon is responsible for running Jobs accoring our schedule. Director allows you to schedule eventually long-running tasks so that they can run in the background.
Currently this includes:
Import runs
Sync runs
Housekeeping tasks
Config rendering and deployment
This component is internally provided as a Hook. This allows other Icinga Web 2 modules to benefit from the Job Runner by providing their very own Job implementations.
Theory of operation
Jobs are configured via the Web frontend. You can create multiple definitions for the very same Job. Every single job will run with a configurable interval. Please do not expect this to behave like a scheduler or a cron daemon. Jobs are currently not executed in parallel. Therefore if one job takes longer, it might have an influence on the scheduling of other jobs.
Some of you might want actions like automated config deployment not to be executed all around the clock. That’s why you have the possibility to assign time periods to your jobs. Choose an Icinga timeperiod, the job will only be executed within that period.
Time periods
Icinga time periods can get pretty complex. You configure them with Director, but until now it didn’t have the necessity to “understand” them. This of course changed with Time Period support in our Job Runner. Director will try to fully “understand” periods in future, but right now it is only capable to interpret a limited subset of timeperiod range definitions.
API
Large parts of the Director’s functionality are also available as API on your CLI.
Manage Objects
Use icingacli director <type> <action> show, create modify or delete
Icinga objects of a specific type:
Action |
Description |
|---|---|
|
Create a new object |
|
Delete a specific object |
|
Whether a specific object exists |
|
Modify an existing objects properties |
|
Show a specific object |
Currently the following object types are available on CLI:
command
endpoint
host
hostgroup
notification
service
timeperiod
user
usergroup
zone
Create a new object
Use this command to create a new Icinga object
Usage
icingacli director <type> create [<name>] [options]
Options
Option |
Description |
|---|---|
|
Provide all properties as single command line options |
|
Otherwise provide all options as a JSON string |
Examples
To create a new host you can provide all of its properties as command line parameters:
icingacli director host create localhost \
    --import generic-host \
    --address 127.0.0.1 \
    --vars.location 'My datacenter'
It would say:
Host 'localhost' has been created
Providing structured data could become tricky that way. Therefore you are also allowed to provide JSON formatted properties:
icingacli director host create localhost \
    --json '{ "address": "127.0.0.1", "vars": { "test": [ "one", "two" ] } }'
Delete a specific object
Use this command to delete a single Icinga object. Just run
icingacli director <type> delete <name>
That’s it. To delete the host created before, this would read
icingacli director host delete localhost
It will tell you whether your command succeeded:
Host 'localhost' has been deleted
Check whether a specific object exists
Use this command to find out whether a single Icinga object exists. Just run:
icingacli director <type> exists <name>
So if you run…
icingacli director host exists localhost
…it will either tell you …
Host 'localhost' exists
…or:
Host 'localhost' does not exist
When executed from custom scripts you could also just check the exit
code, 0 means that the object exists, 1 that it doesn’t.
Modify an existing objects property
Use this command to modify specific properties of an existing Icinga object.
Usage
icingacli director <type> set <name> [options]
Options
Option |
Description |
|---|---|
|
Provide all properties as single command line options |
|
Appends to array values, like
|
|
|
|
Remove a specific property, eventually only |
when matching |
|
array it will remove just
|
|
|
Otherwise provide all options as a JSON string |
|
Replace all object properties with the given ones |
|
Create the object in case it does not exist |
Examples
icingacli director host set localhost \
    --address 127.0.0.2 \
    --vars.location 'Somewhere else'
It will either tell you
Host 'localhost' has been modified
or, when for example issued immediately a second time:
Host 'localhost' has not been modified
Like create, this also allows you to provide JSON-formatted properties:
icingacli director host set localhost --json '{ "address": "127.0.0.2" }'
This command will fail in case the specified object does not exist. This
is when the --auto-create parameter comes in handy. Command output
will tell you whether an object has either been created or (not)
modified.
With set you only set the specified properties and do not touch the
other ones. You could also want to completely override an object,
purging all other eventually existing and unspecified parameters. Please
use --replace if this is the desired behaviour.
Show a specific object
Use this command to show single objects rendered as Icinga 2 config or in JSON format.
Usage
icingacli director <type> show <name> [options]
Options
Option |
Description |
|---|---|
|
Resolve all inherited properties and show a flat object |
object |
|
|
Use JSON format |
|
JSON is pretty-printed per default (for PHP >= 5.4) |
Use this flag to enforce unformatted JSON |
|
|
Per default JSON output skips null or default values |
With this flag you will get all properties |
Clone an existing object
Use this command to clone a specific object.
Usage
icingacli director <type> clone <name> --from <original> [options]
Options
Option |
Description |
|---|---|
|
The name of the object you want to clone |
|
Override specific properties while cloning |
|
In case an object already exists replace it |
with the clone |
|
|
Do no keep inherited properties but create a flat |
object with all resolved/inherited properties |
Examples
icingacli director host clone localhost2 --from localhost
icingacli director host clone localhost3 --from localhost --address 127.0.0.3
Other interesting tasks
Rename objects
There is no rename command, but a simple set can easily accomplish
this task:
icingacli director host set localhost --object_name localhost2
Please note that it is usually absolutely no problem to rename objects
with the Director. Even renaming something essential as a template like
the famous generic-host will not cause any trouble. At least not
unless you have other components outside your Director depending on that
template.
Disable an object
Objects can be disabled. That way they will still exist in your Director
DB, but they will not be part of your next deployment. Toggling the
disabled property is all you need:
icingacli director host set localhost --disabled
Valid values for booleans are y, n, 1 and 0. So to
re-enable an object you could use:
icingacli director host set localhost --disabled n
Working with booleans
As we learned before, y, n, 1 and 0 are valid values for
booleans. But custom variables have no data type. And even if there is
such, you could always want to change or override this from CLI. So you
usually need to provide booleans in JSON format in case you need them in
a custom variable.
There is however one exception from this rule. CLI parameters without a
given value are handled as boolean flags by the Icinga Web 2 CLI. That
explains why the example disabling an object worked without passing
y or 1. You could use this also to set a custom variable to
boolean true:
icingacli director host set localhost --vars.some_boolean
Want to change it to false? No chance this way, you need to pass JSON:
icingacli director host set localhost --json '{ "vars.some_boolean": false }'
This example shows the dot-notation to set a specific custom variable.
If we have had used { "vars": { "some_boolean": false } }, all other
custom vars on this object would have been removed.
Change object types
The Icinga Director distincts between the following object types:
Type |
Description |
|---|---|
|
The default object type. A host, a command and similar |
|
An Icinga template |
|
An apply rule. This allows for assign rules |
|
An external object. Can be referenced and used, will not be |
deployed |
Example for creating a host template:
icingacli director host create 'Some template' \
    --object_type template \
    --check_command hostalive
Please take a lot of care when modifying object types, you should not do so for a good reason. The CLI allows you to issue operations that are not allowed in the web frontend. Do not use this unless you really understand its implications. And remember, with great power comes great responsibility.
Import/Export Director Objects
Some objects are not directly related to Icinga Objects but used by the Director to manage them. To make it easier for administrators to for example pre-fill an empty Director Instance with Import Sources and Sync Rules, related import/export commands come in handy.
Use icingacli director export <type> [options] to export objects of
a specific type:
Type |
Description |
|---|---|
|
Export all DataField definitions |
|
Export all DataList definitions |
|
Export all IcingaTemplateChoiceHost definitions |
|
Export all ImportSource definitions |
|
Export all Job definitions |
|
Export all SyncRule definitions |
Options
Option |
Description |
|---|---|
|
JSON is pretty-printed per default. Use this flag to |
enforce unformatted JSON |
Use icingacli director import <type> < exported.json to import
objects of a specific type:
Type |
Description |
|---|---|
|
Import ImportSource definitions from STDIN |
|
Import SyncRule definitions from STDIN |
This feature is available since v1.5.0.
Director Configuration Basket
A basket contains a set of Director Configuration objects (like Templates, Commands, Import/Sync definitions - but not single Hosts or Services). This CLI command allows you to integrate them into your very own workflows
Available Actions
Action |
Description |
|---|---|
|
JSON-dump for objects related to the given Basket |
|
List configured Baskets |
|
Restore a Basket from JSON dump provided on STDIN |
|
Take a snapshot for the given Basket |
Options
Option |
Description |
|---|---|
|
|
Use icingacli director basket restore < exported-basket.json to
restore objects from a specific basket. Take a snapshot or a backup
first to be on the safe side.
This feature is available since v1.6.0.
Health Check Plugin
You can use the Director CLI as an Icinga CheckPlugin and monitor your Director Health. This will run all or just one of the following test suites:
Name |
Description |
|---|---|
|
Configuration, Schema, Migrations |
|
All configured Sync Rules (pending changes are not a problem) |
|
All configured Import Sources (pending changes are not a problem) |
|
All configured Jobs (ignores disabled ones) |
|
Deployment Endpoint, last deployment outcome |
Usage
icingacli director health check [options]
Options
Option |
Description |
|---|---|
|
Run only a specific test suite |
|
Use a specific Icinga Web DB resource |
Examples
icingacli director health check
Example for running a check only for the configuration:
icingacli director health check --check config
Sample output:
Director configuration: 5 tests OK
[OK] Database resource 'Director DB' has been specified'
[OK] Make sure the DB schema exists
[OK] There are no pending schema migrations
[OK] Deployment endpoint is 'icinga.example.com'
[OK] There is a single un-deployed change
Kickstart and schema handling
The kickstart and the migration command are handled in the
automation section of the upstream documentation.
Configuration handling
Render your configuration
The Director distincts between rendering and deploying your configuration. Rendering means that Icinga 2 config will be pre-rendered and stored to the Director DB. Nothing bad happens if you decide to render the current config thousands of times in a loop. In case a config with the same checksum already exists, it will store - nothing.
You can trigger config rendering by running
icingacli director config render
In case a new config has been created, it will tell you so:
New config with checksum b330febd0820493fb12921ad8f5ea42102a5c871 has been generated
Run it once again, and you’ll see that the output changes:
Config with checksum b330febd0820493fb12921ad8f5ea42102a5c871 already exists
Config deployment
You do not need to explicitely render your config before deploying it to your Icinga 2 master node. Just trigger a deployment, it will re-render the current config:
icingacli director config deploy
The output tells you which config has been shipped:
Config 'b330febd0820493fb12921ad8f5ea42102a5c871' has been deployed
Director tries to avoid needless deployments, so in case you immediately deploy again, the output changes:
Config matches active stage, nothing to do
You can override this by adding the --force parameter. It will then
tell you:
Config matches active stage, deploying anyway
In case you want to do not want deploy to waste time to re-render
your config or in case you decide to re-deploy a specific, eventually
older config version the deploy command allows you to provide a
specific checksum:
icingacli director config deploy --checksum b330febd0820493fb12921ad8f5ea42102a5c871
Deployments status
In case you want to fetch the information about the deployments status, you can call the following CLI command:
icingacli director config deploymentstatus
{
     "active_configuration": {
         "stage_name": "5c65cae0-4f1b-47b4-a890-766c82681622",
         "config": "617b9cbad9e141cfc3f4cb636ec684bd60073be1",
         "activity": "4f7bc6600dd50a989f22f82d3513e561ef333363"
     }
}
In case there is no active stage name related to the Director, active_configuration is set to null.
Another possibility is to pass a list of checksums to fetch the status of specific deployments and (activity log) activities. Following, you can see an example of how to do it:
icingacli director config deploymentstatus \
 --configs 617b9cbad9e141cfc3f4cb636ec684bd60073be1 \
 --activities 4f7bc6600dd50a989f22f82d3513e561ef333363
{
     "active_configuration": {
         "stage_name": "5c65cae0-4f1b-47b4-a890-766c82681622",
         "config": "617b9cbad9e141cfc3f4cb636ec684bd60073be1",
         "activity": "4f7bc6600dd50a989f22f82d3513e561ef333363"
     },
     "configs": {
         "617b9cbad9e141cfc3f4cb636ec684bd60073be1": "active"
     },
     "activities": {
         "4f7bc6600dd50a989f22f82d3513e561ef333363": "active"
     }
}
You can also decide to access directly to a value inside the result JSON by using the –key param:
icingacli director config deploymentstatus \
 --configs 617b9cbad9e141cfc3f4cb636ec684bd60073be1 \
 --activities 4f7bc6600dd50a989f22f82d3513e561ef333363 \
 --key active_configuration.config
617b9cbad9e141cfc3f4cb636ec684bd60073be1
Cronjob usage
You could decide to pre-render your config in the background quite often. As of this writing this has one nice advantage. It allows the GUI to find out whether a bunch of changes still results into the very same config. only one
Run sync and import jobs
Import Sources
List available Import Sources shows a table with your defined Import Sources, their IDs and current state. As triggering Imports requires an ID, this is where you can look up the desired ID:
icingacli director importsource list
Check a given Import Source for changes fetches data from the given Import Source and compares it to the most recently imported data:
icingacli director importsource check --id <id>
Options:
Option
Description
--id <id>An Import Source ID. Use the list command to figure out
--benchmarkShow timing and memory usage details
Fetch data from a given Import Source fetches data from the given Import Source and outputs them as plain JSON:
icingacli director importsource fetch --id <id>
Options:
Option
Description
--id <id>An Import Source ID. Use the list command to figure out
--benchmarkShow timing and memory usage details
Trigger an Import Run for a given Import Source fetches data from the given Import Source and stores it to the Director DB, so that the next related Sync Rule run can work with fresh data. In case data didn’t change, nothing is going to be stored:
icingacli director importsource run --id <id>
Options:
Option
Description
--id <id>An Import Source ID. Use the list command to figure out
--benchmarkShow timing and memory usage details
Sync Rules
List defined Sync Rules shows a table with your defined Sync Rules, their IDs and current state. As triggering a Sync requires an ID, this is where you can look up the desired ID:
icingacli director syncrule list
Check a given Sync Rule for changes runs a complete Sync in memory but doesn’t persist eventual changes:
icingacli director syncrule check --id <id>
Options
Option
Description
--id <id>A Sync Rule ID. Use the list command to figure out
--benchmarkShow timing and memory usage details
Trigger a Sync Run for a given Sync Rule builds new objects according your Sync Rule, compares them with existing ones and persists eventual changes:
icingacli director syncrule run --id <id>
Options
Option
Description
--id <id>A Sync Rule ID. Use the list command to figure out
--benchmarkShow timing and memory usage details
Database housekeeping
Your database may grow over time and ask for various housekeeping tasks. You can usually store a lot of data in your Director DB before you would even notice a performance impact.
Still, we started to prepare some tasks that assist with removing useless garbage from your DB. You can show available tasks with:
icingacli director housekeeping tasks
The output might look as follows:
 Housekeeping task (name)                                  | Count
-----------------------------------------------------------|-------
 Undeployed configurations (oldUndeployedConfigs)          |     3
 Unused rendered files (unusedFiles)                       |     0
 Unlinked imported row sets (unlinkedImportedRowSets)      |     0
 Unlinked imported rows (unlinkedImportedRows)             |     0
 Unlinked imported properties (unlinkedImportedProperties) |     0
You could run a specific task with
icingacli director housekeeping run <taskName>
…like in:
icingacli director housekeeping run unlinkedImportedRows
Or you could also run all of them, that’s the preferred way of doing this:
icingacli director housekeeping run ALL
Please note that some tasks once issued create work for other tasks, as
lost imported rows might appear once you remove lost row sets. So
ALL is usually the best choice as it runs all of them in the best
order.
The Icinga Director REST API
Icinga Director has been designed with a REST API in mind. Most URLs you can access with your browser will also act as valid REST url endpoints.
Base Headers
All your requests MUST have a valid accept header. The only acceptable
variant right now is application/json, so please always append a
header as follows to your requests:
Accept: application/json
Authentication
Please use HTTP authentication and any valid Icinga Web 2 user, granted
enough permissions to accomplish the desired actions. The restrictions
and permissions that have been assigned to web users will also be
enforced for API users. In addition, the permission director/api is
required for any API access.
Versioning
There are no version strings so far in the Director URLs. We will try hard to not break compatibility with future versions. Sure, sooner or later we also might be forced to introduce some kind of versioning. But who knows?
As a developer you can trust us to not remove any existing REST url or any provided property. However, you must always be ready to accept new properties.
URL scheme and supported methods
We support GET, POST, PUT and DELETE.
Method |
Meaning |
|---|---|
GET |
Read / fetch data. Not allowed to run operations with the potential to cause any harm |
POST |
Trigger actions, create or modify objects. Can also be used to partially modify objects |
PUT |
Creates or replaces objects, cannot be used to modify single object properties |
DELETE |
Remove a specific object |
First example request with CURL
curl -H 'Accept: application/json' \
     -u 'username:password' \
     'https://icinga.example.com/icingaweb2/director/host?name=hostname.example.com'
CURL helper script
A script like the following makes it easy to play around with curl:
METHOD=$1
URL=$2
BODY="$3"
USERNAME="demo"
PASSWORD="***"
test -z "$PASSWORD" || USERNAME="$USERNAME:$PASSWORD"

test -z "$BODY" && curl -u "$USERNAME" \
  -i https://icingaweb/icingaweb/$URL \
  -H 'Accept: application/json' \
  -X $METHOD

test -z "$BODY" || curl -u "$USERNAME" \
  -i https://icingaweb/icingaweb/$URL \
  -H 'Accept: application/json' \
  -X $METHOD \
  -d "$BODY"

echo
It can be used as follows:
director-curl GET director/host?name=localhost

director-curl POST director/host '{"object_name": "host2", "... }'
Should I use HTTPS?
Sure, absolutely, no doubt. There is no, absolutely no reason to NOT use HTTPS these days. Especially not for a configuration tool allowing you to configure check commands that are going to be executed on all your servers.
Special parameters for Icinga Objects
Resolve object properties. In case you add the
resolveparameter to your URL, all inherited object properties will be resolved. Such a URL could look as follows:director/host?name=hostname.example.com&resolved
Retrieve all properties. Per default properties with
nullvalue are skipped when shipping a result. You can influence this behavior with the properties parameter. Just appendproperties=ALLto your URL:director/host?name=hostname.example.com&properties=all
Retrieve only specific properties. The
propertiesparameter also allows you to specify a list of specific properties. In that case, only the given properties will be returned, even when they have no (null) value:director/host?name=hostname.example.com&properties=object_name,address,vars
Example
GET director/host?name=pe2015.example.com
{
  "address": "127.0.0.3",
  "check_command": null,
  "check_interval": null,
  "display_name": "pe2015 (example.com)",
  "enable_active_checks": null,
  "flapping_threshold": null,
  "groups": [ ],
  "imports": [
    "generic-host"
  ],
  "retry_interval": null,
  "vars": {
    "facts": {
      "aio_agent_build": "1.2.5",
      "aio_agent_version": "1.2.5",
      "architecture": "amd64",
      "augeas": {
        "version": "1.4.0"
      },
   ...
}
director/host?name=pe2015.example.com&resolved
{
    "address": "127.0.0.3",
    "check_command": "tom_ping",
    "check_interval": "60",
    "display_name": "pe2015 (example.com)",
    "enable_active_checks": true,
    "groups": [ ],
    "imports": [
      "generic-host"
    ],
    "retry_interval": "10",
    "vars": {
      "facts": {
        "aio_agent_build": "1.2.5",
        "aio_agent_version": "1.2.5",
        "architecture": "amd64",
        "augeas": {
          "version": "1.4.0"
        },
        ...
      }
    }
}
JSON is pretty-printed per default, at least for PHP >= 5.4
Error handling
Director tries hard to return meaningful output and error codes:
HTTP/1.1 400 Bad Request
Server: Apache
Content-Length: 46
Connection: close
Content-Type: application/json
{
    "error": "Invalid JSON: Syntax error"
}
Trigger actions
You can of course also use the API to trigger specific actions. Deploying the configuration is as simple as issuing::
POST director/config/deploy
Note
Currently we do not handle Last-Modified and ETag headers. This would involve some work, but could be a cool feature. Let us know your ideas!
Sample scenario
Let’s show you how the REST API works with a couple of practical examples:
Create a new host
POST director/host
{
  "object_name": "apitest",
  "object_type": "object",
  "address": "127.0.0.1",
  "vars": {
    "location": "Berlin"
  }
}
Response
HTTP/1.1 201 Created
Date: Tue, 01 Mar 2016 04:43:55 GMT
Server: Apache
Content-Length: 140
Content-Type: application/json
{
    "address": "127.0.0.1",
    "object_name": "apitest",
    "object_type": "object",
    "vars": {
        "location": "Berlin"
    }
}
The most important part of the response is the response code: 201, a
resource has been created. Just for fun, let’s fire the same request
again. The answer obviously changes:
HTTP/1.1 500 Internal Server Error
Date: Tue, 01 Mar 2016 04:45:04 GMT
Server: Apache
Content-Length: 60
Connection: close
Content-Type: application/json
{
    "error": "Trying to recreate icinga_host (apitest)"
}
So, let’s update this host. To work with existing objects, you must ship
their name in the URL:
POST director/host?name=apitest
{
  "object_name": "apitest",
  "object_type": "object",
  "address": "127.0.0.1",
  "vars": {
    "location": "Berlin"
  }
}
Same body, so no change:
HTTP/1.1 304 Not Modified
Date: Tue, 01 Mar 2016 04:45:33 GMT
Server: Apache
So let’s now try to really change something:
POST director/host?name=apitest
{"address": "127.0.0.2", "vars.event": "Icinga CAMP" }
We get status 200, changes have been applied:
HTTP/1.1 200 OK
Date: Tue, 01 Mar 2016 04:46:25 GMT
Server: Apache
Content-Length: 172
Content-Type: application/json
{
    "address": "127.0.0.2",
    "object_name": "apitest",
    "object_type": "object",
    "vars": {
        "location": "Berlin",
        "event": "Icinga CAMP"
    }
}
The response always returns the full object on modification. This way
you can immediately investigate the merged result. As you can see,
POST requests only touch the parameters you passed - the rest
remains untouched.
One more example to prove this:
POST director/host?name=apitest
{"address": "127.0.0.2", "vars.event": "Icinga CAMP" }
No modification, you get a 304. HTTP standards strongly discourage
shipping a body in this case:
HTTP/1.1 304 Not Modified
Date: Tue, 01 Mar 2016 04:52:05 GMT
Server: Apache
As you might have noted, we only changed single properties in the vars dictionary. Now lets override the whole dictionary:
POST director/host?name=apitest
{"address": "127.0.0.2", "vars": { "event": [ "Icinga", "Camp" ] } }
The response shows that this works as expected:
HTTP/1.1 200 OK
Date: Tue, 01 Mar 2016 04:52:33 GMT
Server: Apache
Content-Length: 181
Content-Type: application/json
{
    "address": "127.0.0.2",
    "object_name": "apitest",
    "object_type": "object",
    "vars": {
        "event": [
            "Icinga",
            "Camp"
        ]
    }
}
If merging properties is not what you want, PUT comes to the rescue:
PUT director/host?name=apitest
{ "vars": { "event": [ "Icinga", "Camp" ] }
All other properties vanished, all but name and type:
HTTP/1.1 200 OK
Date: Tue, 01 Mar 2016 04:54:33 GMT
Server: Apache
Content-Length: 153
Content-Type: application/json
{
    "object_name": "apitest",
    "object_type": "object",
    "vars": {
        "event": [
            "Icinga",
            "Camp"
        ]
    }
}
Let’s put “nothing”:
PUT director/host?name=apitest
{}
Works as expected:
HTTP/1.1 200 OK
Date: Tue, 01 Mar 2016 04:57:35 GMT
Server: Apache
Content-Length: 62
Content-Type: application/json
{
    "object_name": "apitest",
    "object_type": "object"
}
Of course, PUT also supports 304, you can check this by sending
the same request again.
Now let’s try to cheat:
KILL director/host?name=apitest
HTTP/1.1 400 Bad Request
Date: Tue, 01 Mar 2016 04:54:07 GMT
Server: Apache
Content-Length: 43
Connection: close
Content-Type: application/json
{
    "error": "Unsupported method KILL"
}
Ok, no way. So let’s use the correct method:
DELETE director/host?name=apitest
HTTP/1.1 200 OK
Date: Tue, 01 Mar 2016 05:59:22 GMT
Server: Apache
Content-Length: 109
Content-Type: application/json
{
    "imports": [
        "generic-host"
    ],
    "object_name": "apitest",
    "object_type": "object"
}
Service Apply Rules
Please note that Service Apply Rule names are not unique in Icinga 2.
They are not real objects, they are creating other objects in a loop.
This makes it impossible to distinct them by name. Therefore, a
dedicated REST API endpoint director/serviceapplyrules ships all
Service Apply Rules combined with their internal ID. This ID can then be
used to modify or delete a Rule via director/service.
Deployment Status
In case you want to fetch the information about the deployments status, you can call the following API:
GET director/config/deployment-status
HTTP/1.1 200 OK
Date: Wed, 07 Oct 2020 13:14:33 GMT
Server: Apache
Content-Type: application/json
{
    "active_configuration": {
        "stage_name": "b191211d-05cb-4679-842b-c45170b96421",
        "config": "617b9cbad9e141cfc3f4cb636ec684bd60073be1",
        "activity": "028b3a19ca7457f5fc9dbb5e4ea527eaf61616a2"
    }
}
This throws a 500 in case Icinga isn’t reachable. In case there is no active stage name related to the Director, active_configuration is set to null.
Another possibility is to pass a list of checksums to fetch the status of specific deployments and (activity log) activities. Following, you can see an example of how to do it:
GET director/config/deployment-status?config_checksums=617b9cbad9e141cfc3f4cb636ec684bd60073be2,
617b9cbad9e141cfc3f4cb636ec684bd60073be1&activity_log_checksums=617b9cbad9e141cfc3f4cb636ec684bd60073be1,
028b3a19ca7457f5fc9dbb5e4ea527eaf61616a2
{
    "active_configuration": {
        "stage_name": "b191211d-05cb-4679-842b-c45170b96421",
        "config": "617b9cbad9e141cfc3f4cb636ec684bd60073be1",
        "activity": "028b3a19ca7457f5fc9dbb5e4ea527eaf61616a2"
    },
    "configs": {
        "617b9cbad9e141cfc3f4cb636ec684bd60073be2": "deployed",
        "617b9cbad9e141cfc3f4cb636ec684bd60073be1": "active"
    },
    "activities": {
        "617b9cbad9e141cfc3f4cb636ec684bd60073be1": "undeployed",
        "028b3a19ca7457f5fc9dbb5e4ea527eaf61616a2": "active"
    }
}
The list of possible status is:
active: whether this configuration is currently active
deployed: whether this configuration has ever been deployed
failed: whether the deployment of this configuration has failed
undeployed: whether this configuration has been rendered, but not yet deployed
unknown: whether no configurations have been found for this checksum
Agent Tickets
The Director is very helpful when it goes to manage your Icinga Agents. In case you want to fetch tickets through the API, please do as follows:
GET director/host/ticket?name=apitest
HTTP/1.1 200 OK
Date: Thu, 07 Apr 2016 22:19:24 GMT
Server: Apache
Content-Length: 43
Content-Type: application/json
"5de9883080e03278039bce57e4fbdbe8fd262c40"
Please expect an error in case the host does not exist or has not been configured to be an Icinga Agent.
Self Service API
Theory of operation
Icinga Director offers a Self Service API, allowing new Icinga nodes to register themselves. No credentials are required, authentication is based on API keys. There are two types of such keys:
Host Template API keys
Host Object API keys
Template keys basically grant the permission to:
Create a new host based on that template
Specify name and address properties for that host
This is a one-time operation and allows one to claim ownership of a specific host. Now, there are two possible scenarios:
The host already exists
The host is not known to Icinga Director
In case the host already exists, Director will check whether it’s API key matches the given one. [..]
Request processing for Host registration
A new node will
POSTtoself-service/register-host, with two parameters in the URL:name: it’s desired object name, usually the FQDNkey: a valid Host Template API key
In it’s body it is allowed to specify a specific set of properties. At the time of this writing, these are:
display_nameaddressaddress6
Director will validate the
keyand load the corresponding Host Template. In case no such is found, the request is rejected. Then it checks whether a Host with the givennameexists. In case it does, the request is rejected unless:It inherits the loaded Host Template
It already has an API key
If these conditions match, the request is processed. The following sketch roughly shows the decision tree (AFTER the key has been validated):
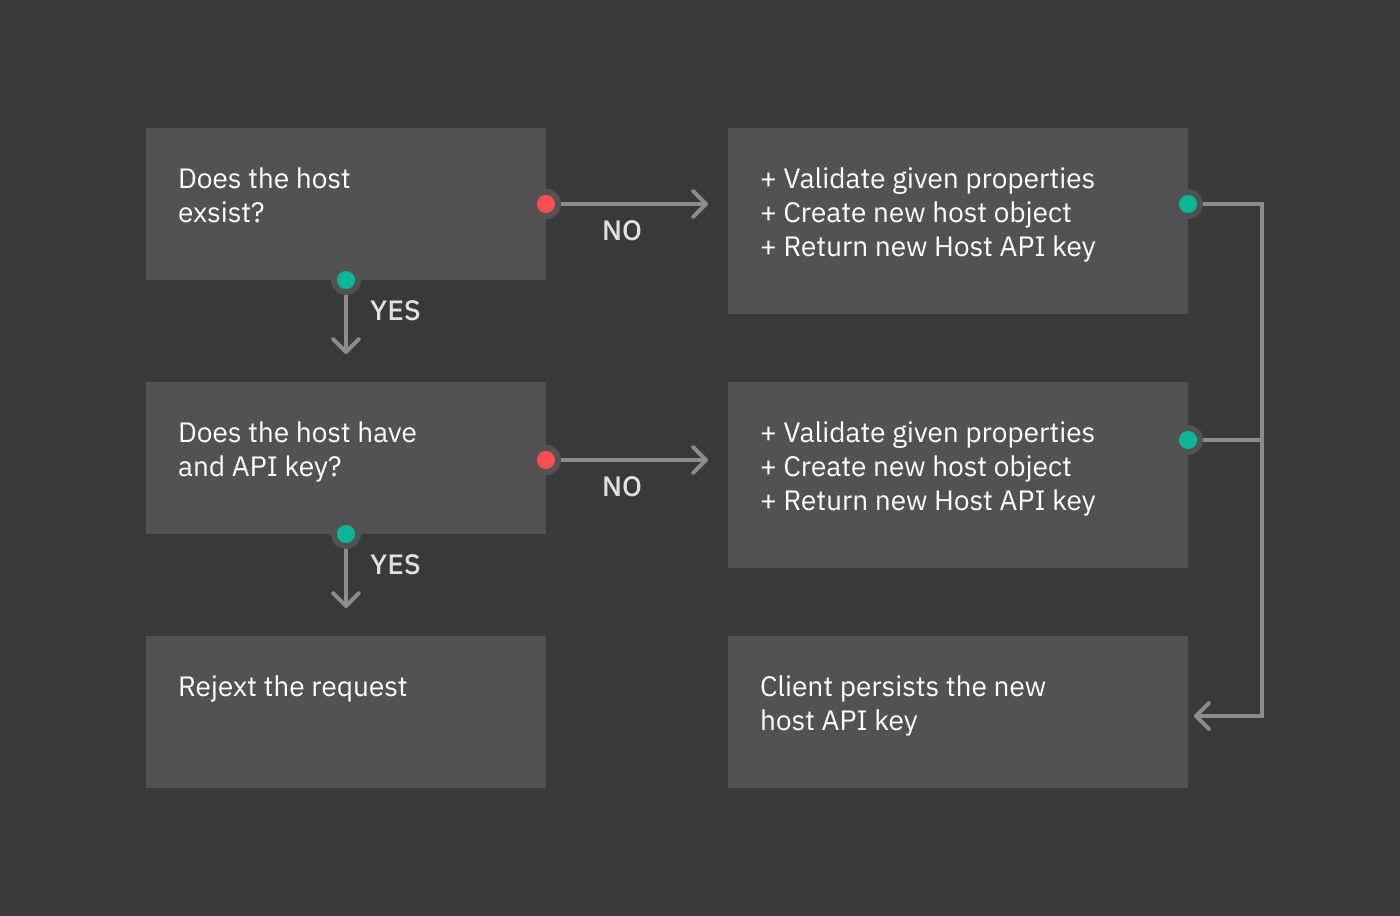
Self Service API
Icinga Director offers a Self Service API, allowing new Hosts running the Icinga Agent to register themselves in a secure way.
Windows Agents
Windows Agents are the main target audience for this feature. It allows you to generate a single Powershell Script based on the Icinga 2 Powershell Module. You can either use the same script for all of your Windows Hosts or generate different ones for different kind of systems.
This installation script could then be shipped with your base images, invoked remotely via PowerShell Remoting, distributed as a module via Group Policies and/or triggered via Run-Once (AD Policies).
Linux Agents
At the time of this writing, we do not ship a script with all the functionality you can find in the Windows Powershell script. Linux and Unix environments are mostly highly automated these days, and such a magic shell script is often not what people want.
Still, you can also benefit from this feature by directly using our Self Service REST API. It should be easy to integrate it into the automation tool of your choice.
Base Configuration
You have full control over the automation Script generated by the Icinga Director. Please got to the Infrastructure Dashboard and choose the Self Service API:
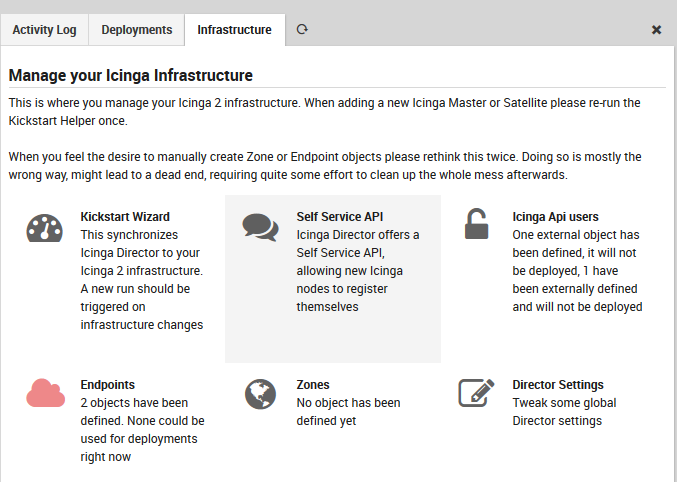
Fig. 114 Infrastructure Dashboard - Self Service API
This leads to the Self Service API Settings form. Most settings are self-explaining and come with detailled inline hints. The most important choice is whether the script should automatically install the Icinga Agent:
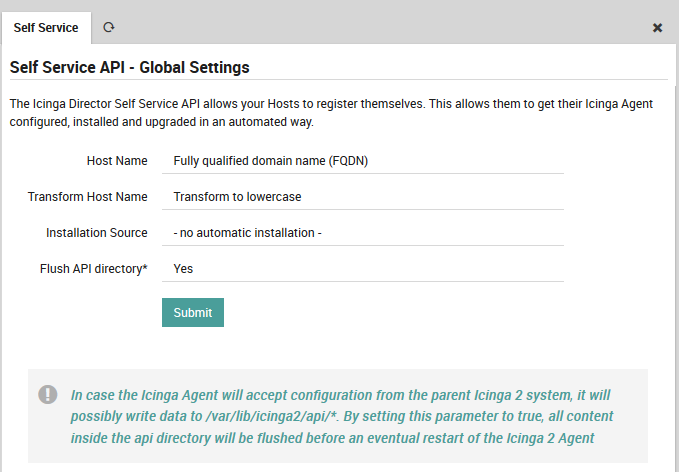
Fig. 115 Settings - Choose installation source
In case you opted for automated installation, more options will pop up:
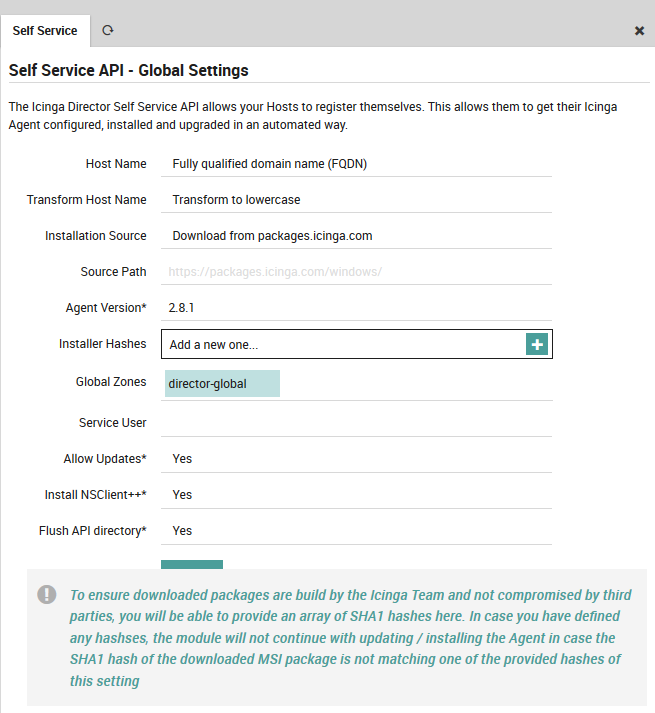
Fig. 116 Settings - Installer Details
The Icinga Director “Live-Creation” experimental feature permits to create Icinga Objects in the Director and simultaneously also directly in Icinga2, without the need to deploy the Director configuration.
The Live-Creation is available both from icingacli and from the Director REST API.
Below you see a flowchart which gives you an idea of what happens when the Object Live-Creation is called from the Director REST API.
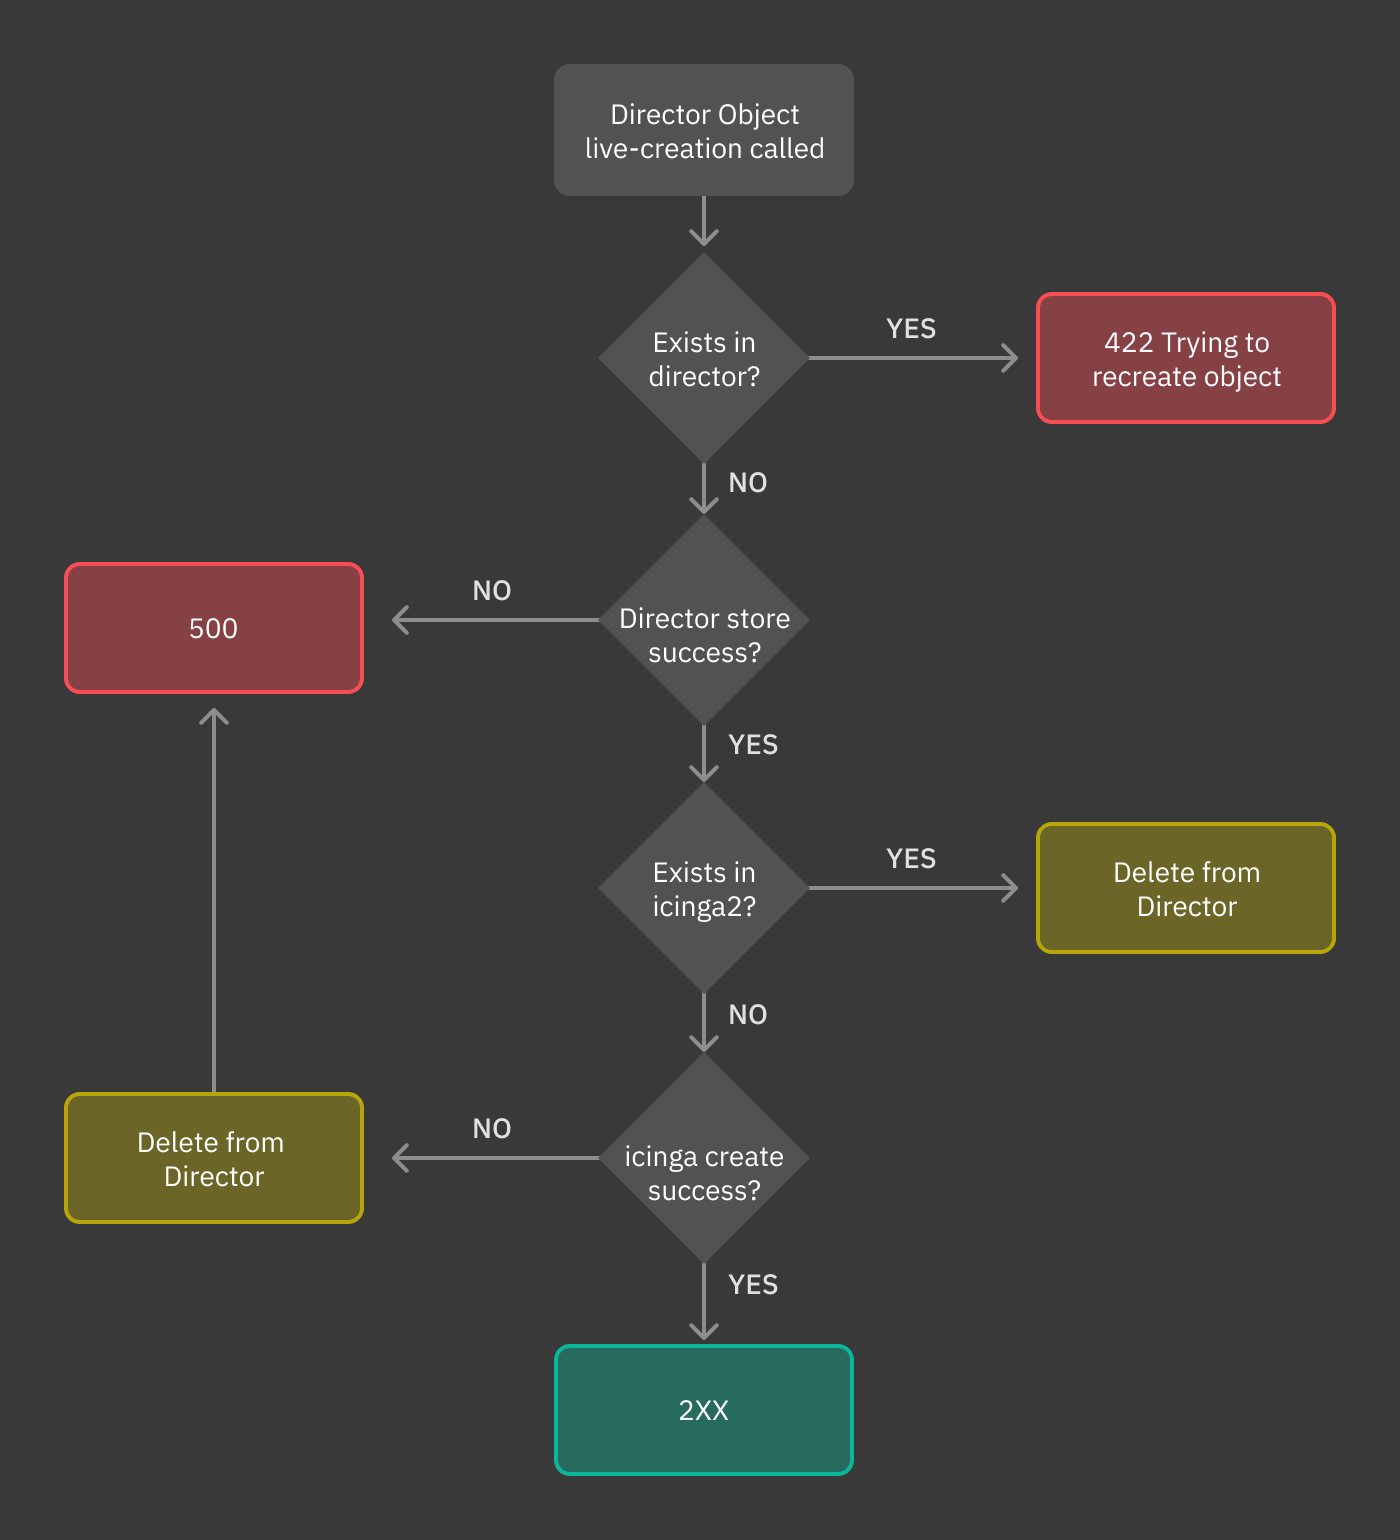
Fig. 117 Import source
CLI Commands
Fetch all available Virtual Machines
This command is mostly for test/debug reasons and gives you an output of all Virtual Machines with a default set of properties:
icingacli vsphere fetch virtualmachines [options]
The available options are:
Option |
Description |
|---|---|
|
IP, host or URL for your vCenter or ESX host |
|
When authenticating, this username will be used |
|
The related password |
|
Replace id-references with their name |
|
Accept certificates signed by an unknown CA |
|
Accept certificates not matching the host name |
|
Use plaintext HTTP requests |
|
Use the given Proxy (ip, host or host:port |
|
HTTP (default) or SOCKS5 |
|
Username for authenticated HTTP proxy |
|
Password for authenticated HTTP proxy |
|
Show resource usage summary |
|
Dump JSON output |
Fetch all available Host Systems
This command is mostly for test/debug reasons and gives you an output of all Host Systems with a default set of properties:
icingacli vsphere fetch hostsystems [options]
The available options are:
Option |
Description |
|---|---|
|
IP, host or URL for your vCenter or ESX host |
|
When authenticating, this username will be used |
|
The related password |
|
Accept certificates signed by an unknown CA |
|
Accept certificates not matching the host name |
|
Use plaintext HTTP requests |
|
Use the given Proxy (ip, host or host:port |
|
HTTP (default) or SOCKS5 |
|
Username for authenticated HTTP proxy |
|
Password for authenticated HTTP proxy |
|
Show resource usage summary |
|
Dump JSON output |
Shutdown Management Rest API
Shutdown can be executed on an host using a REST API. Currently, the following calls are available.
Trigger Shutdown Definition
Endpoint: trigger-shutdown-definition
This endpoint enables you to trigger an asynchronous run of a shutdown definition via a REST API call. The call is non blocking and the shutdown will be performed in background.
Parameters: * id: The ID of the shutdown definition
Example:
curl -u root:xxx -H 'Accept: application/json' https://localhost/neteye/shutdownmanager/api/trigger-shutdown-definition?id=1
Configuring Icinga Monitoring Retention Policy
This section describes how to configure and applying the retention time for Icinga Data Output (IDO) DB.
The retention time is by default set to 550 days, meaning that the data stored in IDO DB are kept for 550 days and deleted afterwards. This will affect the monitoring data history, that are used for populating SLM reports. This value can be changed at a later point, customize it based on user’s needs.
Background
In the 4.13 release a new setting has been introduced, called retention policy. The reason for its introduction is that the all data (warnings, logs, output of checks, and so on) are stored in the Database, which can dramatically grow over time. This setting will be enabled by default in new installation only, while existing installation must configure it and enable it, following the steps described next. The default value given to this setting is 550 days, but can be changed at a later point.
How To Set The Retention Time
To configure or modify the value, go to Configuration > Modules > Neteye > Configuration.
Step 0. Click on the slider called Enable default retention policy to enable the feature. The slider will disappear afterwards. Indeed, once the feature is enabled, there is no rolling back, it will remain enabled forever.
Step 1. Insert a value in days for the Default retention policy age, which by default is 550, i.e., one year.
Step 2. Click on the Save Changes button.
Step 4. Go to the command line and run the
neteye_secure_installscript.
Warning
Only after Step 4 the setting will be applied and enabled, so make sure to complete successfully all the steps!
How To Disable the Retention Time
The retention time can be disabled, meaning that no data will ever be deleted. To do so, set the value of retention time to 0 (zero).
Warning
Disabling the retention time is discouraged, because the disk space required by the Databases might grow quickly if the monitoring activities on NetEye create a lot of input.
This website uses cookies that store your theme preferences. These cookies do not store any personally identifiable data.