


 NetEye.Cloud Solution
Navigating the UI
The NetEye.Cloud user interface provides access to the monitoring information that is relevant for your organization. You can use the interface to check the overall status of your monitored environment, identify active problems, review alerts, and open the available details for hosts, services, and monitoring modules.
This chapter introduces the main areas of the interface from a first-time user perspective. It focuses on where to start depending on the task you want to perform.
Start from the Dashboard
Use the dashboard as the starting point for daily monitoring activities. The dashboard gives you a high-level overview of the monitored environment and helps you understand whether everything is operating normally or whether something requires your attention.
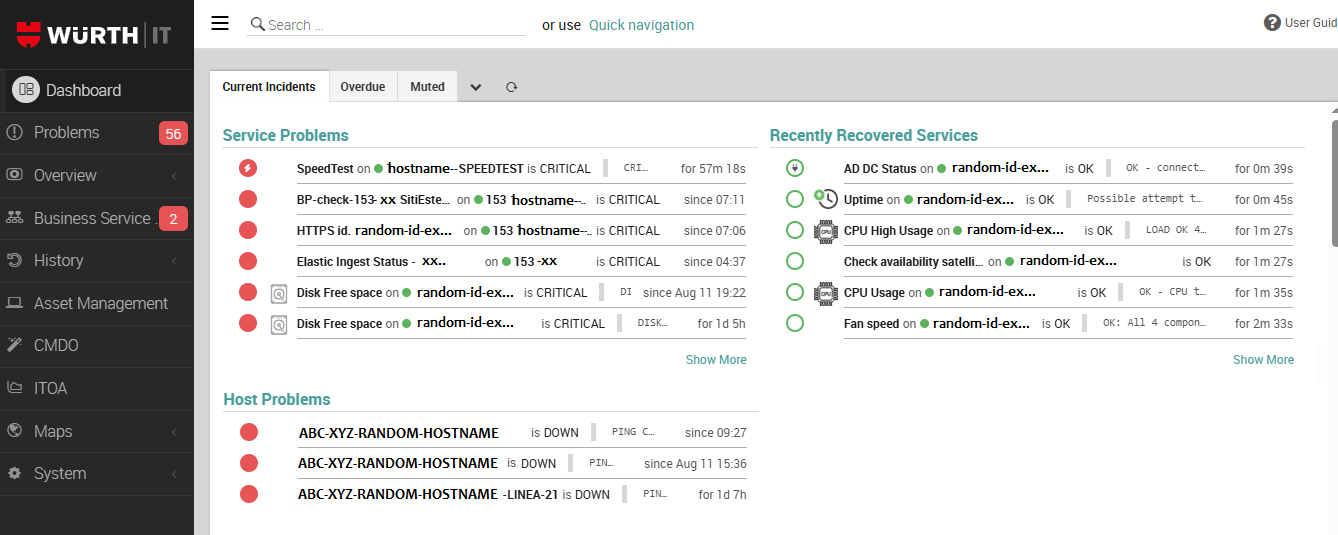
Fig. 189 Current Incidents view of the Dashboard
From the dashboard, you can typically answer questions such as:
Is the monitored environment currently healthy?
Are there active problems that need to be checked?
Which monitored areas, services, or components require attention?
Where should I go next to investigate an issue?
When you notice an unhealthy status or an indicator that requires attention, continue by opening the related problem, alert, or monitored object, depending on the information available in the dashboard.
Review active Issues
Open the Problems view when you want to understand which issues are currently active in your monitored environment. This view is useful when the dashboard indicates that something is not operating as expected, or when you want to review the current situation without starting from a specific host or service.
The Problems view is intended to help you understand what problems are active right now, which hosts, services, or monitored objects are affected, the severity and the time of occurrence of the problem.
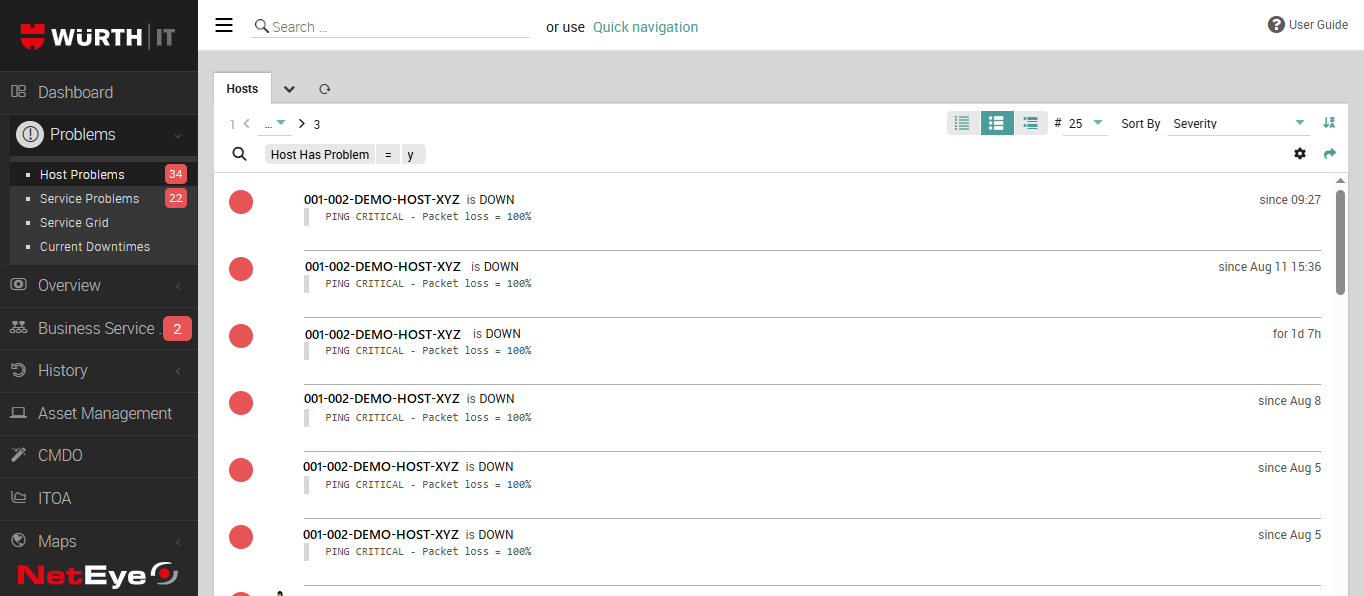
Fig. 190 Host Problems view
After identifying a relevant problem, open its details to review the available context. Depending on the information shown in your NetEye.Cloud environment, the details may help you understand the affected object, the current status, related checks, and recent monitoring information.
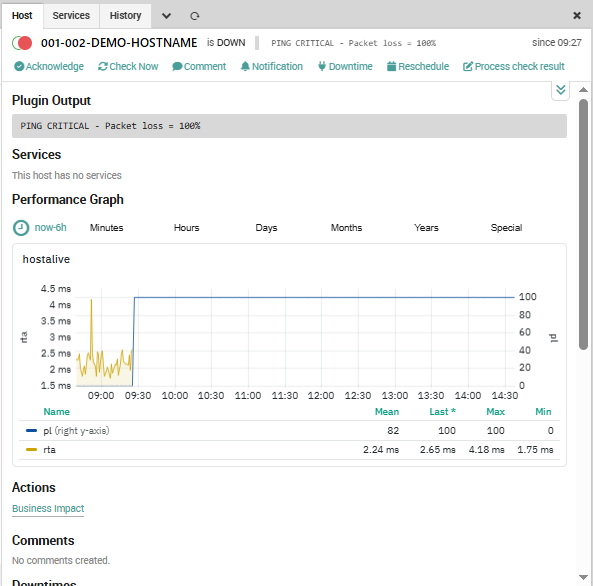
Fig. 191 Detailed view of a host with a problem detected
Review Alerts and recent Events
Use the Alerts view to review relevant monitoring notifications and recent events. Alerts help you understand what has changed in the monitored environment and provide a way to follow up on events that may require attention.
In the Alerts view you will be able to find out:
Which alerts were recently generated?
Which monitored object or service triggered the alert?
What is the alert severity or status?
When did the alert occur?
Does the alert relate to an active problem that should be investigated?
If an alert points to a current issue, continue by opening the related object or problem details. If the alert is informational or no longer active, use it as historical context for understanding changes in the monitored environment.
Open details for a Monitored Object
When you need more information about a specific host, service, or monitored component, open the related details page. Detail pages help you move from a general overview to the information available for a specific object.
Use a detail page to answer questions such as:
What is the current status of this monitored object?
Which checks or services are related to it?
Is there a recent problem or alert connected to it?
What monitoring information is available for further analysis?
The available information depends on the monitoring configuration and on the functionality enabled for your NetEye.Cloud account. If a module or detail area is not available, it may not be part of your current NetEye.Cloud service scope.
Filter & Search for your Information
When a view contains many entries, use the available search and filter options to focus on the information that is relevant to your task. Filters help you reduce noise and quickly find the hosts, services, alerts, or problems you want to review.
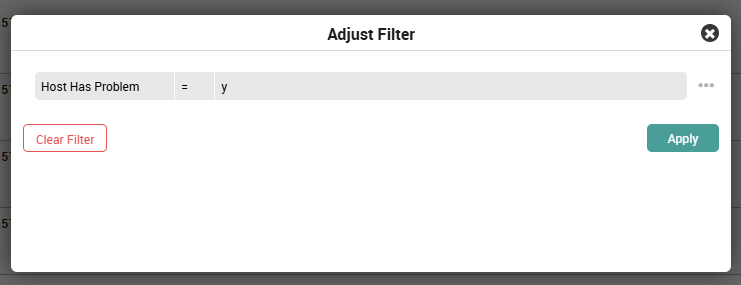
Fig. 192 Tune your filter to find and view the exact problems
Depending on the view, you may be able to filter by information such as:
status or severity
host, service, or monitored object
time range
monitoring area or module
problem or alert state
Use filters when you want to focus on a specific customer service, a specific time period, or only the entries that require immediate attention.
Access Monitoring Modules
Your NetEye.Cloud account may provide access to additional monitoring modules, depending on the services enabled for your organization. These modules can extend the information available beyond the basic status, problem, and alert views.
For example, you may find areas dedicated to reporting, analytics, or other monitoring-related functions.
The exact modules and actions available depend on your NetEye.Cloud configuration. This chapter only describes modules that are visible and usable for NetEye.Cloud customers.
Customizing your session
NetEye.Cloud is a fully managed monitoring environment, so most monitoring configuration is handled for you. However, you can still adjust a few personal preferences to make day-to-day navigation more comfortable.
To review these options, select the gear icon in the bottom-left part of the main menu. Depending on your permissions and enabled services, you can tune basic settings such as:
language and time zone
main menu color
number of elements displayed per page
automatic refresh of web pages
saved searches or filters for frequently used views (if available)
display of additional debug information (if enabled for your account)
These settings do not change the monitored environment itself. They only customize how information is displayed during your session, helping you review dashboards, problems, alerts, and other monitoring views in a way that better fits your workflow.

