


 Monitoring
Viewing Host and Service Details
Clicking on a host from within any view will take you to that host’s Details panel. There you will find a lot of information and action items in a single place:
A recap of the host’s status and its services similar to the quick view
Some quick commands you can immediately run on this host such as launching a check immediately instead of waiting for the next scheduled interval
The output of the most recent hostalive command
A graph showing host metrics
Controls for handling most common diagnosis operations
Performance data and the warning and critical ranges
An action to send an immediate notification about this host
Details about the current check command such as when it will launch next and how often it launches regularly
Tags or fields that have been added to help individuate this host
Controls for enabling or disabling monitoring for the host shown
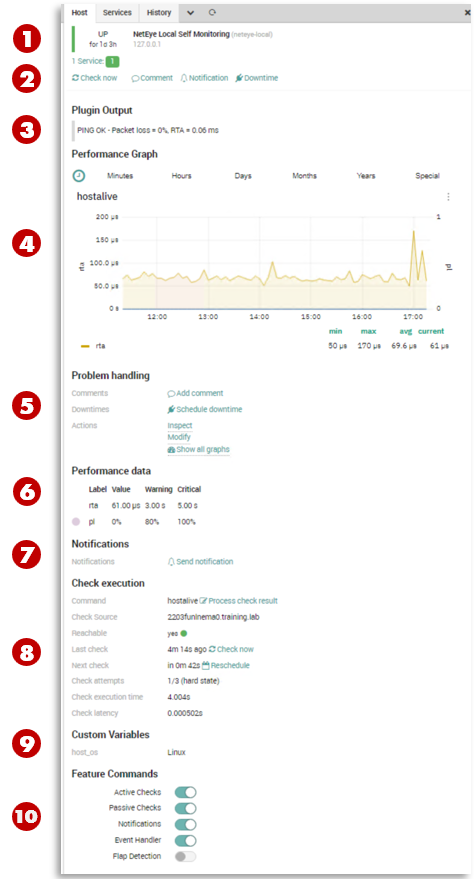
Fig. 197 The complete details panel for a host showing data and actions
Clicking on a service from within any view will produce a similar Details panel for that service.

