


 Cyber Threat Intelligence - SATAYO
Dashboard
The SATAYO Dashboard is your starting point for understanding the current security posture of your organization in NetEye.Cloud. Use it to check exposure indices, identify new findings, follow remediation progress, and decide which areas require your attention first.
The Dashboard consolidates information that would otherwise be spread across separate views. You can review scan results, findings, tickets, remediation progress, and attack surface indicators from a single page, then open the related detailed view when you need to investigate a specific item.
Dashboard data is always shown in the context of the organization you select. If you have access to more than one organization, use the selector in the top-right corner to switch between a single organization and All Organizations. Select a single organization when you want to focus on one monitored perimeter. Select All Organizations when you want an aggregated overview across all organizations available to you.
Thus, in general, the Dashboard gives you a quick understanding of what has changed in your monitored perimeter and where you should look first. Start from the overall exposure index, then check new findings and related tickets to see which issues need investigation, remediation, or follow-up. When you need more context, open the detailed Findings or Tickets views directly from the Dashboard and continue your analysis there.
The Dashboard is composed of panels. Each panel summarizes one aspect of the monitored perimeter and gives you a starting point for further investigation.
Exposure Index
The Exposure Assessment Index Value (EAIV) panel shows the external exposure level of the selected organization over the last 12 months.
The large number at the top of the panel is the current EAIV, that is, the overall exposure score of the organization at the most recent scan, obtained as the sum of the three exposure categories described below. The score ranges from 0, meaning that no external exposure was detected, to 100, meaning maximum exposure: the higher the value, the greater the potential impact of the information that an attacker could exploit.
Hint
Hover over the information icon next to the panel title to see how the index is calculated and what the thresholds mean.
The graph below the counter shows how exposure evolved over the same period, with one line for each of the three exposure categories tracked by SATAYO:
Infrastructure — exposure related to your network and systems configuration.
Data Files & People — exposure related to leaked data, files, and personal information.
Deep & Dark Web — exposure related to mentions and activity found on the deep and dark web.
Use the legend under the graph to identify each line and to understand which category is driving the overall score. A line that grows over time points to the area where new exposure is accumulating and where remediation effort is most needed.
Each line shows one point for each of the past 12 months, based on the most recent scan
completed in each month. If no scan was performed in a given month, its point repeats the
previous month’s value so that the trend line stays continuous. The labels on the
horizontal axis use the MM/YY format, from the oldest month on the left to the most
recent one on the right.
Hint
Hover over any point of the graph to open a tooltip with the details of that month: the reference Date, the value of each of the three categories, and their Total, that is, the EAIV of that month. Use it to compare a past month with the current value shown by the counter.
The graph is drawn on a fixed 0–100 scale, and the horizontal dashed lines mark the risk thresholds:
the yellow line is the Medium Threshold, set at 30;
the orange line is the High Threshold, set at 60.
Hover over a dashed line to display its label and value. Values below the Medium Threshold indicate a contained exposure, values between the two thresholds require attention, and values above the High Threshold indicate an exposure level that should be remediated as a priority.
Interpret the EAIV together with the size and digital footprint of the organization. A larger organization with more domains, services, and publicly accessible infrastructure can naturally have a higher value because its external presence is broader.
Note
When you select All Organizations, the value shown is the average across your organizations’ domains, not a sum, so viewing several organizations together does not inflate the index.
Exposure by Group
The Exposure by group panel breaks down findings into groups and shows, for each group, how many findings are still waiting on remediation and how many are already closed. Use it to see at a glance which types of exposure are open, which are backed up in the remediation process, and which have already been handled.
Findings are grouped along one of the following dimensions, selectable from the dropdown at the top of the panel:
Risk Domain — the kind of risk a finding represents, such as attack surface, brand abuse, data exposure, identity exposure, or threat signals.
Exposure Lifecycle — where a finding sits in the exposure lifecycle, from discovery through preparation, exposure, compromise, and operational impact.
Surface Distribution — the layer of the web where a finding was observed: surface, deep, or dark web.
Macro Area — the high-level area of the organization’s footprint a finding belongs to, such as infrastructure, data/files and people, or the deep and dark web.
For the selected dimension, each row shows one group together with three counts:
WFC (Waiting for customer): findings whose ticket is waiting for your organization to act.
WFS (Waiting for support): findings whose ticket is waiting on the SATAYO Intelligence Team.
Closed: findings whose ticket has reached a final state (canceled, false positive, resolved, risk accepted, or published).
A group always appears in the table, even when it currently has no findings in any of the three states, so you can see the full breakdown of the selected dimension at a glance. Findings with no ticket, or whose ticket is still open or in progress, are not counted in any of the three columns: this panel focuses on remediation workload, not on overall findings volume, which the Findings panel already covers.
Hint
Select a count to drill down into exactly the findings behind it. You are taken to the dedicated Findings page, already filtered by the selected group and ticket state, so you can start investigating without having to rebuild the filter yourself.
Attack Surface Composition
The Attack Surface Composition panel shows the distribution of findings by source.
The platform scans publicly accessible sources across the Surface, Deep, and Dark Web for evidence linked to your organization. Each of these layers is shown as a section of the iceberg visualization, together with the number of findings detected in that layer and its percentage of the total number of findings:
Surface Web – the publicly indexed part of the internet, reachable through standard search engines and browsers. It covers assets and services directly exposed by the monitored perimeter, for example domains and exposed services.
Deep Web – content not indexed by standard search engines, typically sitting behind authentication or surfacing in leaked data collections. It covers findings such as data breaches and stealer logs.
Dark Web – content only reachable through specialized, anonymized networks and tools, such as onion sites and illegal marketplaces. SATAYO reports this evidence as Deep & Dark Web findings.
Hint
Select the arrow next to a layer to drill down into the findings detected in that specific source.
New Findings
The Findings panel summarizes findings detected during recent scan activities. Use it as the main entry point for understanding what changed in the monitored perimeter and which newly identified exposures require your attention first.
Findings are grouped into categories or exposure groups so you can quickly understand which types of exposure are most common. Each tile shows the number of findings in that group and helps you compare areas such as exposed services, leaked information, vulnerable assets, suspicious references, or other configured exposure categories. Use the domain filter when you need to focus on a specific part of the monitored perimeter.
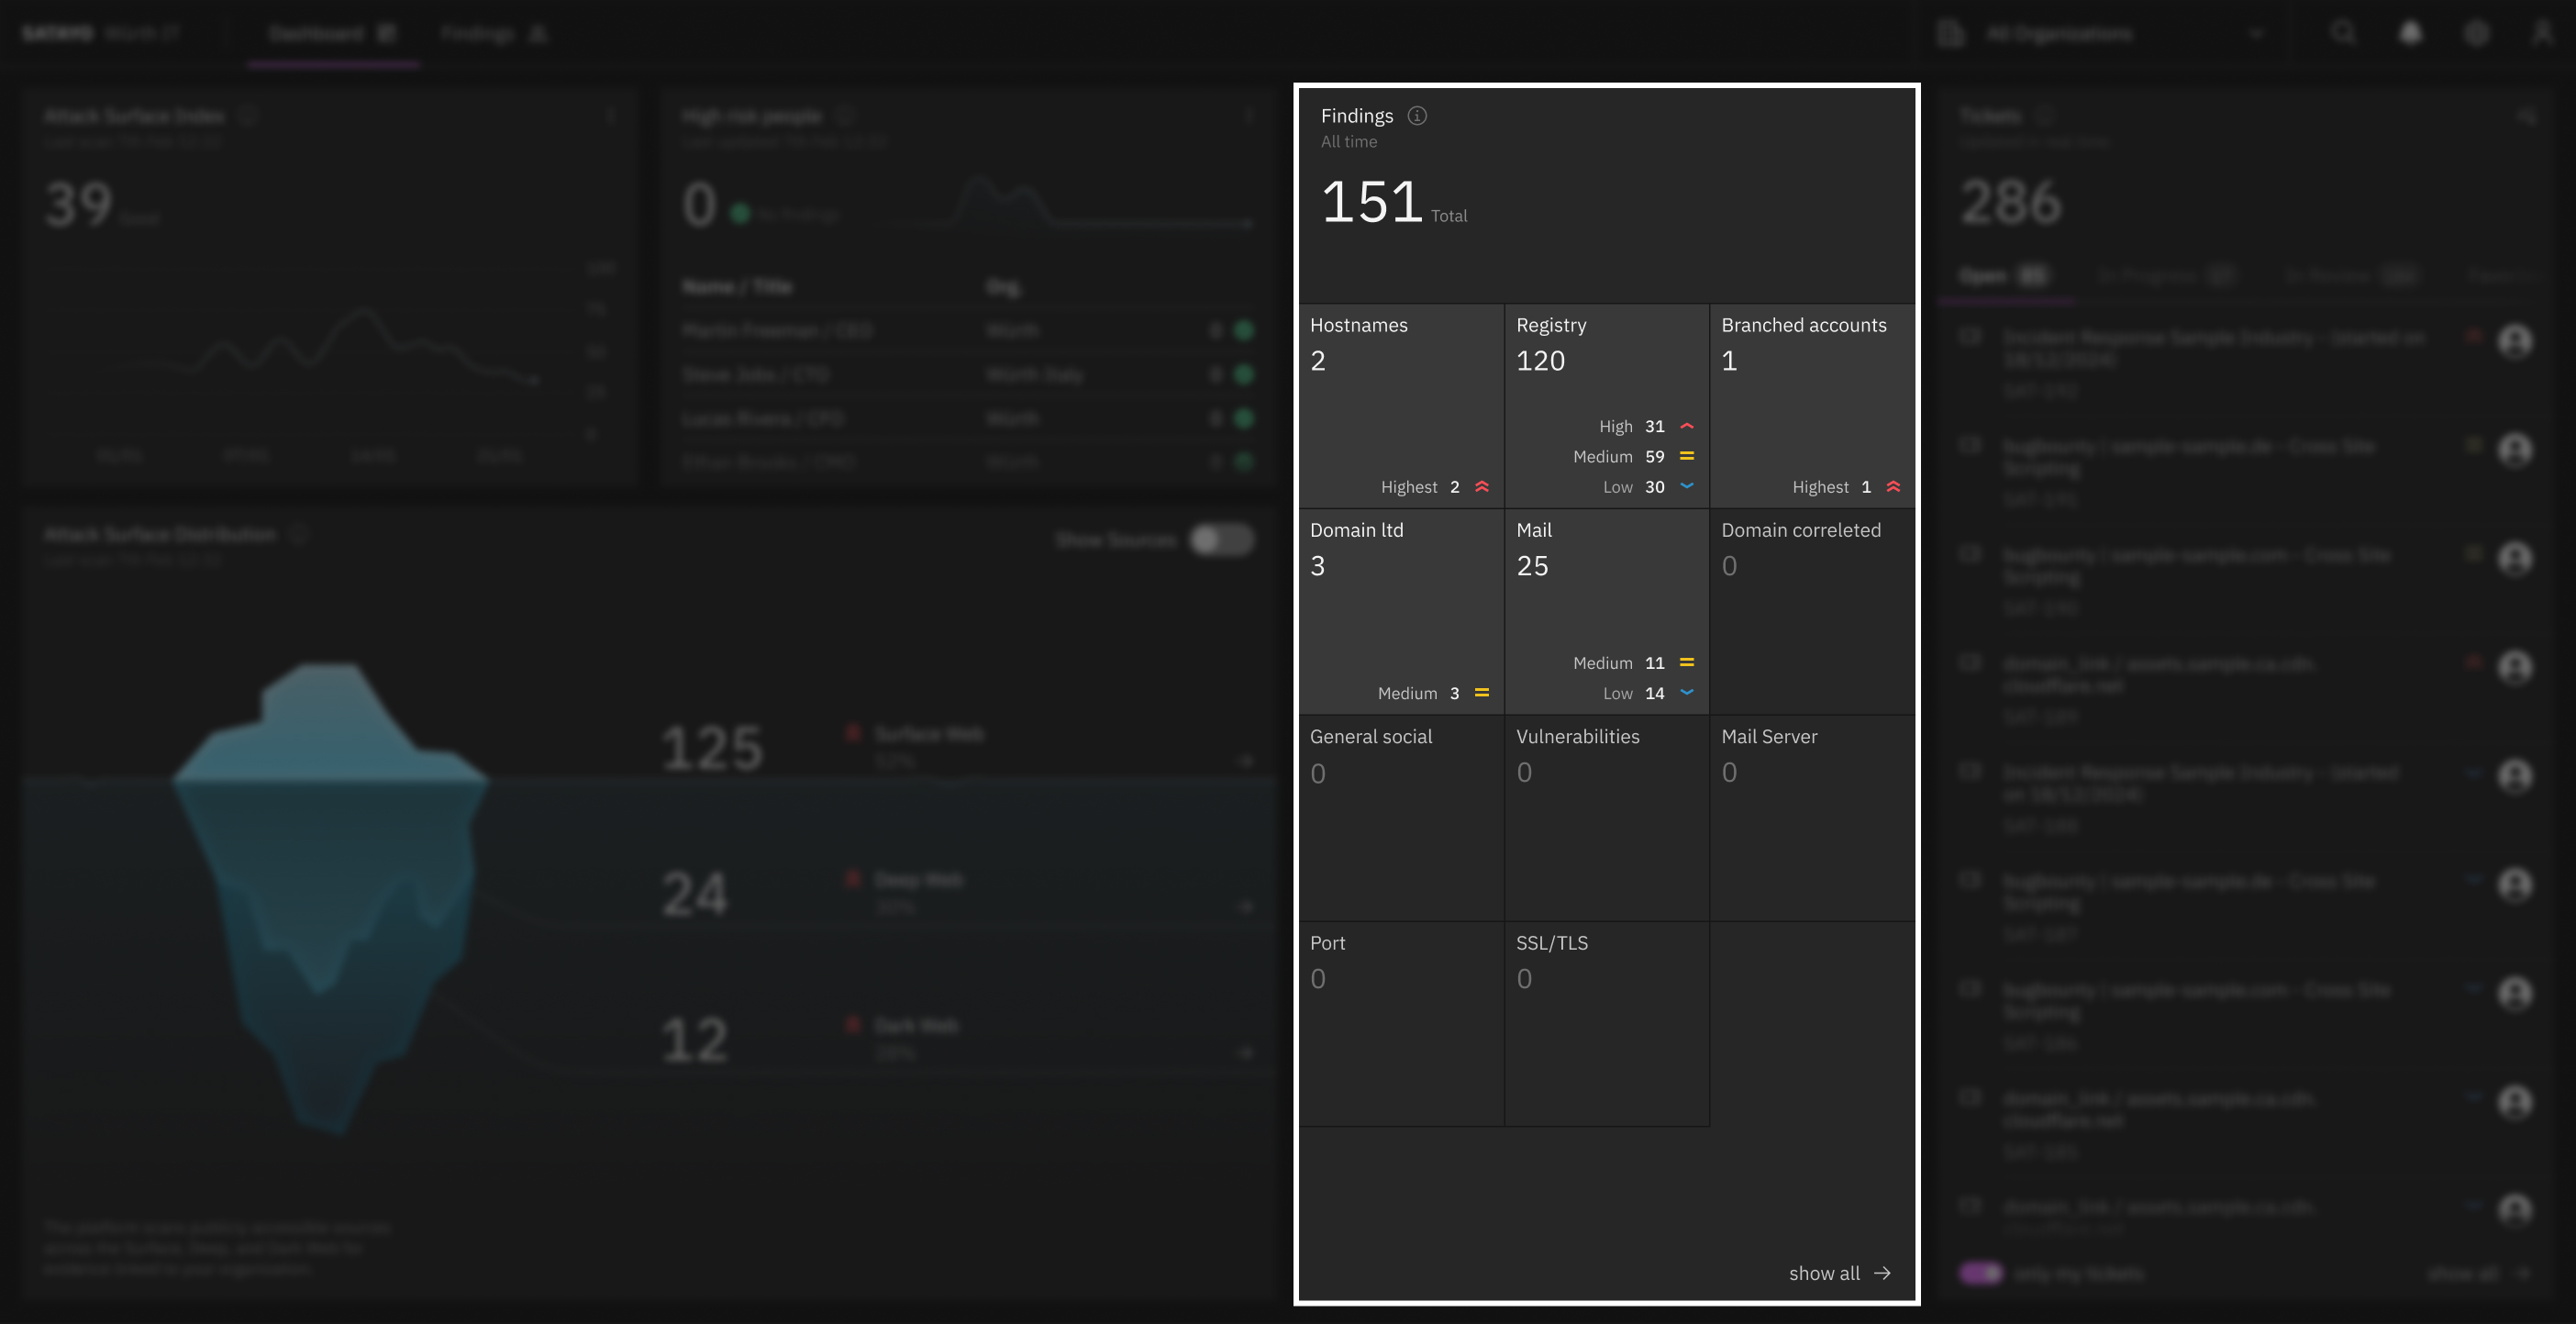
Fig. 235 Findings panel of the Dashboard
The panel helps you distinguish between general exposure and findings that already require operational handling. When a finding has been acknowledged and a ticket has been created, the Dashboard can show the related severity level and make it easier to understand which findings are already part of the remediation workflow.
Hint
Use this panel during your daily review to detect new exposure early. Start from groups with the highest number of findings, then check whether any of them have critical severity, linked tickets, or a recent increase compared to previous scans. Open the dedicated Findings page when you need evidence, affected domains, source information, timestamps, and the full investigation context.
Tickets
Use Tickets panel to monitor operational workload, understand which findings are already being handled, and track how remediation activities are progressing.
Each ticket represents an operational follow-up for a finding that requires attention. The panel helps you move from detection to action: instead of only seeing that an exposure exists, you can check whether it has already been assigned, prioritized, reviewed, or resolved.
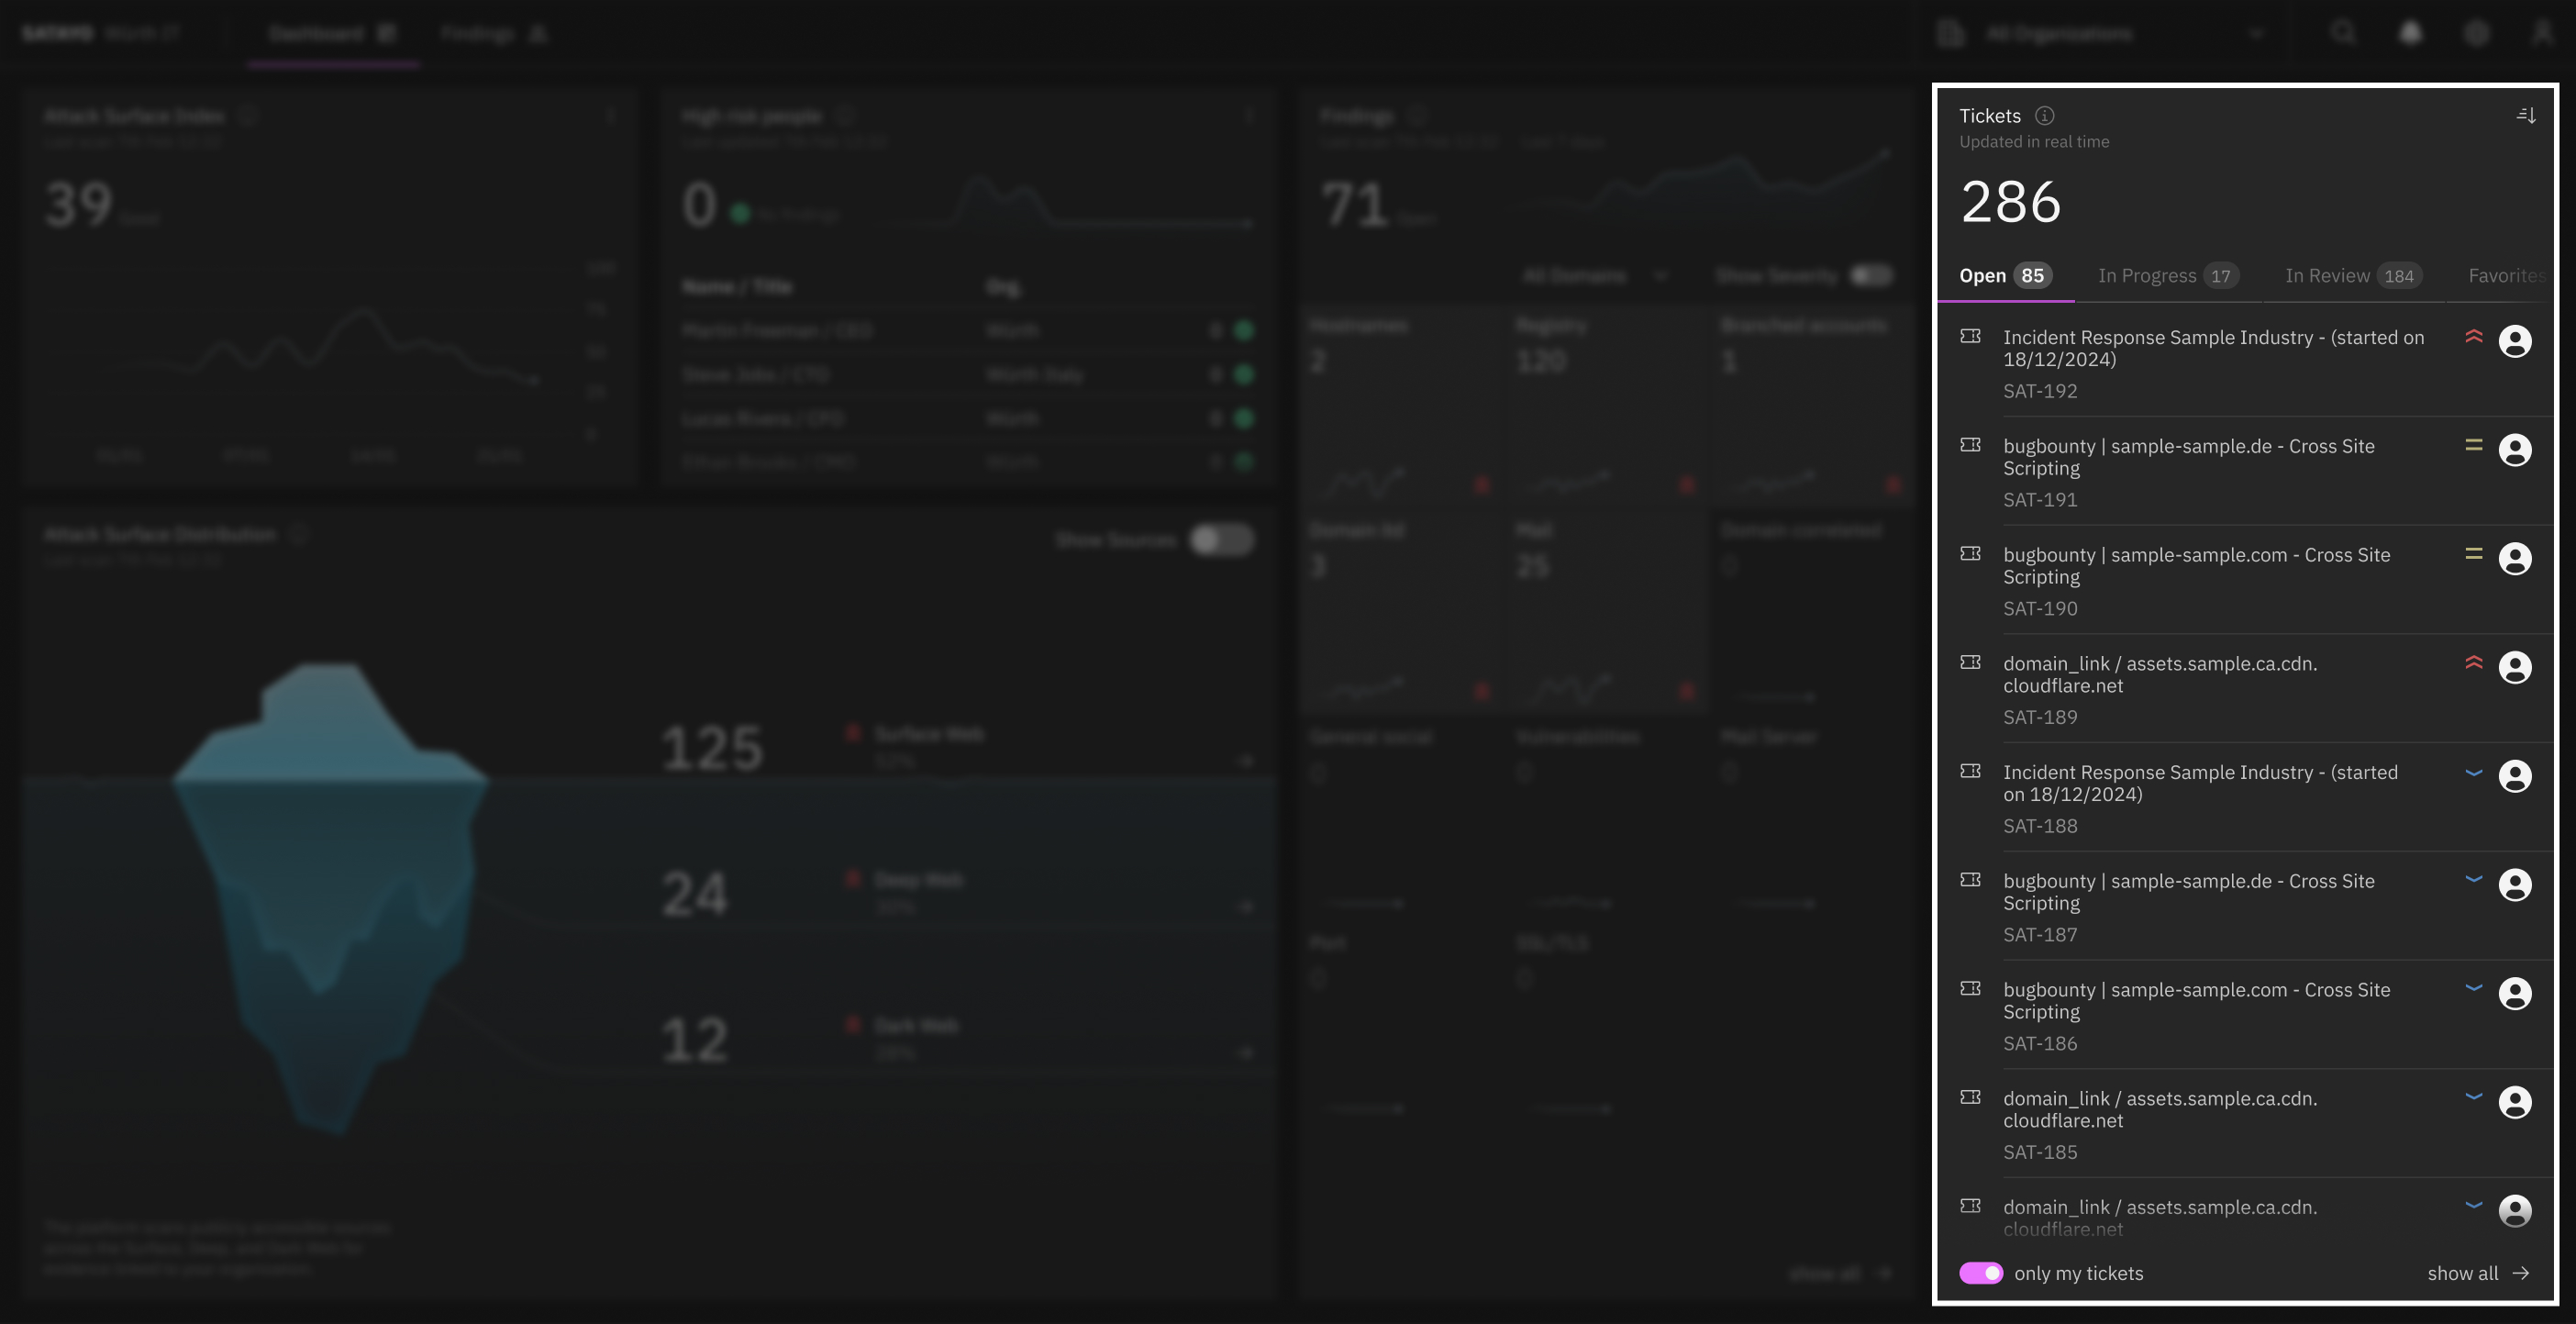
Fig. 236 Tickets panel of the Dashboard
Tickets are managed by the SATAYO Intelligence Team. You can filter tickets by status, including:
Open
In Progress
Waiting for support
Done
Use the panel for quick monitoring and prioritization. Group tickets by status to understand how many items are still waiting for action, already being worked on, waiting for review, or completed. Sort tickets when you need to focus on the most urgent or most relevant items first.
If no tickets are displayed, it can mean that no tickets were created for the selected organization and period, or that your account does not have permission to view them. In this case, the panel shows an empty state instead of ticket data.
Hint
Open the dedicated Tickets page when you need full ticket management capabilities, complete ticket details, comments, ownership information, or the full remediation history.
Hint
Use the Findings panel first when you want to understand what SATAYO detected and how exposure is distributed across categories or domains. Then use the Tickets panel to understand which of those findings are already acknowledged, prioritized, assigned, reviewed, or resolved. Together, the two panels help you move from detection to remediation without losing the original evidence.

