
User Guide Functional Overview Requirements Architecture System Installation NetEye Additional Components Installation Setup The neteye Command Director NetEye Self Monitoring Tornado Business Service Monitoring IT Operation Analytics - Telemetry Geo Maps NagVis Audit Log Shutdown Manager Reporting ntopng Visual Monitoring with Alyvix Elastic Stack IT Operations (Command Orchestrator) Asset Management Service Level Management Cyber Threat Intelligence - SATAYO NetEye.Cloud Solution Monitoring Asset Management SOC System Administrator SOC Attacker Centric Cyber Threat Intelligence - SATAYO NetEye Update & Upgrade Backup and Restore How To NetEye Extension Packs Troubleshooting Security Policy Glossary
module icon Monitoring
Monitoring with NetEye.Cloud Monitored Objects Finding and Filtering Hosts Exporting Monitoring Data Viewing Host and Service Details Organizing with Groups Tactical Overview Problems View Dashboard Scheduled Downtime Business Service Monitoring VMD
NetEye.Cloud Solution Monitoring Asset Management SOC System Administrator SOC Attacker Centric Cyber Threat Intelligence - SATAYO Introduction to NetEye Monitoring Business Service Monitoring IT Operation Analytics Visualization Network Visibility Log Management & Security Orchestrated Datacenter Shutdown Application Performance Monitoring User Experience Service Management Service Level Management & Reporting Requirements for a Node Cluster Requirements and Best Practices NetEye Satellite Requirements TCP and UDP Ports Requirements Additional Software Installation Introduction Single Node Cluster Kubernetes NetEye Master Master-Satellite Architecture Underlying Operating System Acquiring NetEye ISO Image Installing ISO Image Single Nodes and Satellites Cluster Nodes Configuration of Tenants Satellite Nodes Only Nodes behind a Proxy Additional NetEye Components Satellites Nodes only Verify if a module is running correctly Accessing the New Module Cluster Satellite Security Backup and Restore Identity and Access Management External Identity Providers Configure federated LDAP/AD Emergency Reset of Keycloak Configuration Keycloak Hostname Configuration Advanced Configuration Roles Single Page Application in NetEye Module Permissions and Single Sign On Within NetEye Importing User Federation Groups inside another Group Importing OIDC IdP Groups inside another Group Resource Tuning Advanced Topics Basic Concepts & Usage Advanced Topics Monitoring Environment Templates Monitored Objects Import Monitored Objects Data Fields Deployment Icinga 2 Agents Configuration Baskets Dashboard Monitoring Status Integration with Elasticsearch VMD Permissions Notifications Jobs API Configuring Icinga Monitoring Retention Policy NetEye Self Monitoring Concepts Collecting Events Add a Filter Node WHERE Conditions Iterating over Event fields Retrieving Payload of an Event Extract Variables Create a Rule Tornado Actions Test your Configuration Export and Import Configuration Example Under the hood Development Retry Strategy Configuration Thread Pool Configuration API Reference Configure a new Business Process Create your first Business Process Node Importing Processes Operators The ITOA Module Configuring User Permissions Telegraf Metrics in NetEye Telegraf Configuration Telegraf on Monitored Hosts Visualizing Dashboards Customizing Grafana The NetEye Geo Map Visualizer Map Viewer Configuring Geo Maps NagVis Audit Log Overview Shutdown Manager user Shutdown Manager GUI Shutdown Commands Advanced Topics Overview User Role Management Cube Use Cases ntopng and NetEye Integration Permissions Retention Advanced Topics Overview User Roles Nodes RDP Client Building Tools Editor: Interface Overview Editor: Script Building Editor: Managing Scripts Designer: Interface Overview Designer: Interface Options Designer: Component Tree Selector: Interface Overview Test Case Management Dashboard Use Cases Overview Architecture Authorization Kibana Elasticsearch Cluster Elasticsearch Configuration Replicas on a Single Node Elasticsearch Performance tuning Overview Enabling El Proxy Sending custom logs to El Proxy Configuration files Commands Elasticsearch Templates and Retentions El Proxy DLQ Blockchain Verification Handling Blockchain Corruptions El Proxy Metrics El Proxy Security El Proxy REST Endpoints Agents Logstash Rsyslog Elastic APM Elastic RUM Multitenant OpenTelemetry Collector Elastic XDR Overview Authorization in the Command Orchestrator Module Configuring CLI Commands Executing Commands Overview Permissions Installation Single Tenancy Multitenancy Communication through a Satellite Asset collection methods Display asset information in monitoring host page Overview Customers Availability Event Adjustment Outages Resource Advanced Topics Introduction The Intelligence We Produce Mitre Attack Coverage Getting Started Settings SATAYO Items Intelligence Requirements Managed Service Request Form FAQ Changelog SATAYO Community NetEye.Cloud as a SaaS solution NetEye.Cloud Subscription Base Concepts Authentication Options Authentication via IdP Group Claims for Authorization Management Authentication via Microsoft Entra ID Authorization Navigating the UI Monitoring with NetEye.Cloud Monitored Objects Finding and Filtering Hosts Exporting Monitoring Data Viewing Host and Service Details Organizing with Groups Tactical Overview Problems View Dashboard Scheduled Downtime Business Service Monitoring VMD Asset Management in NetEye.Cloud Automatic Inventory Collection Software & License Management Contract & Supplier Management Change & Lifecycle Management SOC System Administrator (AdS) Access to NetEye and Elastic Elastic Dashboards Elastic Discover Elastic Alerts Elastic Rules Introduction to SOC Attacker Centric Service Description NetEye SIEM About SATAYO Threat Intelligence and Security Operations How SATAYO works MITRE ATT&CK Coverage SATAYO Findings SaaS & Managed Mode Before you start Update Procedure Single Node Upgrade from 4.49 to 4.50 Cluster Upgrade from 4.49 to 4.50 Satellite Upgrade from 4.49 to 4.50 DPO machine Upgrade from 4.49 to 4.50 Create a mirror of the RPM repository Sprint Releases Feature Troubleshooting Backup and Restore Tornado Networking Service Management - Incident Response IT Operation Analytics - Telemetry Identity Provider (IdP) Configuration NetEye Cluster on Microsoft Azure NetEye Cluster on AWS Introduction to NEP Getting Started with NEPs Online Resources Obtaining NEP Insights Available Packages Advanced Topics NEP Updates & Upgrades Setup Configure swappiness Restarting Stopped Services Enable stack traces in web UI How to access standard logs Director does not deploy when services assigned to a host have the same name How to enable/disable debug logging Activate Debug Logging for Tornado Modules/Services do not start Sync Rule fails when trying to recreate Icinga object How to disable InfluxDB query logging Managing an Elasticsearch Cluster with a Full Disk Some logs are not indexed in Elasticsearch Elasticsearch is not functioning properly Reporting: Error when opening a report Debugging Logstash file input filter Bugfix Policy Reporting Vulnerabilities Glossary

With the NetEye.Cloud Monitoring service you can monitor the availability of your hosts and services using check commands.

Monitored Objects

There are two main types of objects that monitoring works with:

  • Hosts: Physical or virtual devices that correspond to a “computer”. They have a CPU, memory and storage (which can be measured), and run processes launched by the user or the system itself. Hosts can be “Up”, “Down” or Unreachable, depending on whether they’re functioning or not. Examples include:

    • Computers (servers, laptops and tablets)

    • Virtual machines

    • Network devices (switches, routers)

    • IT infrastructure (security alarms, smart locks)

    • IoT devices (temperature sensors, water detector)

    Host objects provide a mechanism to group services that are running on the same physical device.

  • Services: The software programs and processes that run on hosts, like Active Directory, or network services (HTTP/S, SNMP, SSH). They run faster or slower depending on the current performance of their host (as long as their host is “Up”), and even crash and need to be restarted.

    The service states are:

    • OK: The service is working correctly

    • WARNING: The service is working, but its performance has degraded past a certain, definable point

    • CRITICAL: The service’s performance is highly degraded, for instance it responds slowly to user input

    • UNKNOWN: The service’s state can’t be determined (for example, it doesn’t respond)

Modern host operating systems will typically include one or more services that are dedicated to monitoring, such as reporting CPU load, memory or storage capacity used, and network throughput. These are called check commands, and they return the service state and other result values. User-provided check commands called plugins can also be installed.

We can check the status and performance of a service at any given moment by looking at the check results using:

  • Views, which show the most recent return values

  • Dashboards, which show multiple views as panels in a larger screen

  • Interactive Dashboards, which continually store those check results and let you compare them with previously recorded values

Host and Service Templates

Because there can be many different types of hosts that need different check commands and other parameters, it’s more efficient to implement an inheritance system of templates than repeatedly re-enter the same information for each host.

Templates allows you to quickly define a new host by choosing the most relevant template and then only making the few necessary changes to differentiate that host from others, such as host name and IP address.

The same logic also applies to services (service templates) and commands (command templates). You can find more details about all three templates in the On-Premise version of the NetEye Guide.

Within NetEye.Cloud there are already many pre-defined templates to use, so it’s more important to learn what they are and how they are used rather than how to create new ones.

How to Add a Host or Service

If you need to add a specific host, command or service, that information can also be found in the On-Premise NetEye guide:

How to See Your Hosts and Services

In NetEye.Cloud you can view all the hosts in your monitored environment by following Overview > Hosts in the left side panel. Each host is displayed with a brief summary including:

  • Its name

  • Its status

  • How long the current state has been that way

  • Additional check or plugin output beyond the state

If a host is down it will be highlighted in red so it is quickly noticed.

When you have a large number of hosts they cannot all be displayed on one page, NetEye.Cloud provides page controls that let you determine how many hosts to show on one page, how to navigate from one page to another, sort the hosts in the list, and quickly search for hosts by name.

You can see the list of your services just like the host list by following Overview > Services.

Check Commands and Plugins

A plugin is the monitoring code that exists on the monitored object that actually computes the result and returns the desired value. The check command runs when directed on the NetEye.Cloud side and calls the plugin via a network connection to request the check and to collect the returned value(s). A check command and plugin working together are typically just called a check.

Although you can write your own commands, most of the time you will just select one that already exists in NetEye.Cloud, either internally derived from Icinga’s library, or from a third party library, called external commands. Both types typically have a large number of arguments you can change (or leave blank) directly in NetEye.Cloud.
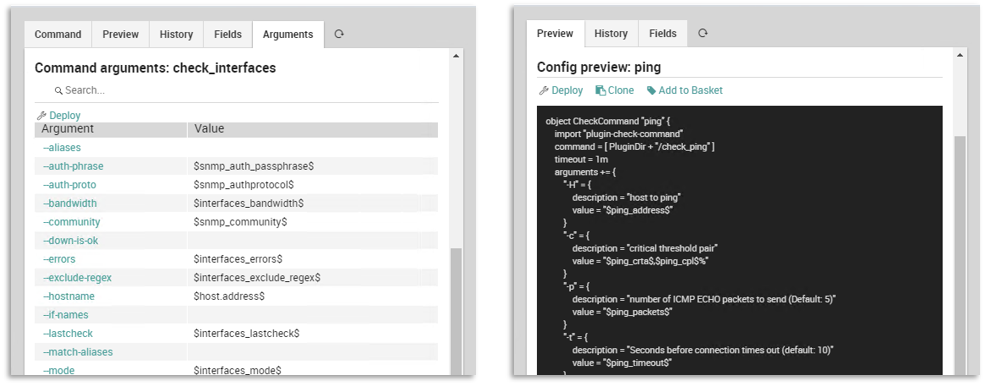
Comparison of commands and external commands

Fig. 188 Commands on the left, External Commands on the right

Each command has a name, and the Arguments tab (or Preview tab for external commands) shows the relationship between the command line arguments and NetEye.Cloud/Icinga variables you can use to populate them.

To select and use an external command, you can search online to find out how to install the associated plugin on the host device and use the arguments to obtain the check values you’re interested in.

Reachability and Dependencies

A reachable host is one that can “answer” if you talk to it, and an unreachable host doesn’t answer. This is determined by using a command called hostalive (ping) that sends a network request to the host. If the request is answered, the host is reachable at that moment.

But a host may not answer either because (1) it’s down or (2) it’s up but the network between the host and the monitor is not working. It’s not always easy to tell the difference. For instance, if other hosts on the same subnet are reachable, then the host is likely down. If they aren’t, it’s more likely a network problem.

When a host is down, any services running on that host will also not be working. And any other hosts that need to access services on the first host will have problems as well. These dependencies can be stated explicitly so that when a “parent” host is marked down in the monitoring interface, any “child” hosts and services that depend on it can be immediately marked as Unreachable.
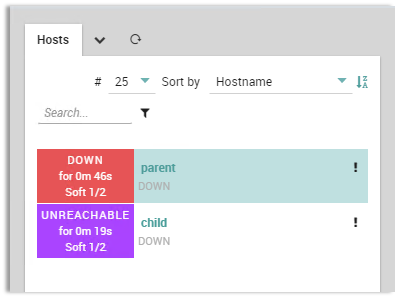
An unreachable host

Fig. 189 A host marked as Unreachable

Services can also be marked as unreachable. In fact, services can serve as both parents and children of either other hosts or other services.

Dependencies can especially help root cause analysis of a problem, because if a large number of hosts or services stop working, you can concentrate first on the “Down” objects before the “Unreachable” ones.

It can also mitigate the chaos when there are many dependent hosts: Child objects can be set to suppress notifications and further checks, so that a single problem doesn’t result in being inundated by tens of thousands of messages.
