User Guide Functional Overview Requirements Architecture System Installation NetEye Additional Components Installation Setup The neteye Command Director NetEye Self Monitoring Tornado Business Service Monitoring IT Operation Analytics - Telemetry Geo Maps NagVis Audit Log Shutdown Manager Reporting ntopng Visual Monitoring with Alyvix Elastic Stack IT Operations (Command Orchestrator) Asset Management Service Level Management Cyber Threat Intelligence - SATAYO NetEye.Cloud Strategy Monitoring Asset Management SOC System Administrator SOC Attacker Centric Cyber Threat Intelligence - SATAYO NetEye Update & Upgrade Backup and Restore How To NetEye Extension Packs Troubleshooting Security Policy Glossary
module icon Asset Management
Asset Management in Neteye.Cloud Automatic Inventory Collection Software & License Management Contract & Supplier Management Change & Lifecycle Management
NetEye.Cloud Strategy Monitoring Asset Management SOC System Administrator SOC Attacker Centric Cyber Threat Intelligence - SATAYO Introduction to NetEye Monitoring Business Service Monitoring IT Operation Analytics Visualization Network Visibility Log Management & Security Orchestrated Datacenter Shutdown Application Performance Monitoring User Experience Service Management Service Level Management & Reporting Requirements for a Node Cluster Requirements and Best Practices NetEye Satellite Requirements TCP and UDP Ports Requirements Additional Software Installation Introduction Single Node Cluster NetEye Master Master-Satellite Architecture Underlying Operating System Acquiring NetEye ISO Image Installing ISO Image Single Nodes and Satellites Cluster Nodes Configuration of Tenants Satellite Nodes Only Nodes behind a Proxy Additional NetEye Components Satellites Nodes only Verify if a module is running correctly Accessing the New Module Cluster Satellite Security Backup and Restore Identity and Access Management External Identity Providers Configure federated LDAP/AD Emergency Reset of Keycloak Configuration Advanced Configuration Roles Single Page Application in NetEye Module Permissions and Single Sign On Within NetEye Importing User Federation Groups inside another Group Importing OIDC IdP Groups inside another Group Resources Tuning Advanced Topics Basic Concepts & Usage Advanced Topics Monitoring Environment Templates Monitored Objects Import Monitored Objects Data Fields Deployment Icinga 2 Agents Configuration Baskets Dashboard Monitoring Status Integration with Elasticsearch VMD Permissions Notifications Jobs API Configuring Icinga Monitoring Retention Policy NetEye Self Monitoring Concepts Collecting Events Add a Filter Node WHERE Conditions Iterating over Event fields Retrieving Payload of an Event Extract Variables Create a Rule Tornado Actions Test your Configuration Export and Import Configuration Example Under the hood Development Retry Strategy Configuration Thread Pool Configuration API Reference Configure a new Business Process Create your first Business Process Node Importing Processes Operators The ITOA Module Configuring User Permissions Telegraf Metrics in NetEye Telegraf Configuration Telegraf on Monitored Hosts Visualizing Dashboards Customizing Grafana The NetEye Geo Map Visualizer Map Viewer Configuring Geo Maps NagVis Audit Log Overview Shutdown Manager user Shutdown Manager GUI Shutdown Commands Advanced Topics Overview User Role Management Cube Use Cases ntopng and NetEye Integration Permissions Retention Advanced Topics Overview User Roles Nodes RDP Client Building Tools Editor: Interface Overview Editor: Script Building Editor: Managing Scripts Designer: Interface Overview Designer: Interface Options Designer: Component Tree Selector: Interface Overview Test Case Management Dashboard Use Cases Overview Architecture Authorization Kibana Elasticsearch Cluster Elasticsearch Configuration Replicas on a Single Node Elasticsearch Performance tuning Overview Enabling El Proxy Sending custom logs to El Proxy Configuration files Commands Elasticsearch Templates and Retentions El Proxy DLQ Blockchain Verification Handling Blockchain Corruptions El Proxy Metrics El Proxy Security El Proxy REST Endpoints Agents Logstash Rsyslog Elastic APM Elastic RUM Elastic XDR Overview Authorization in the Command Orchestrator Module Configuring CLI Commands Executing Commands Overview Permissions Installation Single Tenancy Multitenancy Communication through a Satellite Asset collection methods Display asset information in monitoring host page Overview Customers Availability Event Adjustment Outages Resource Advanced Topics Introduction The Intelligence We Produce Mitre Attack Coverage Getting Started Settings SATAYO Items Intelligence Requirements Managed Service Request Form FAQ Changelog SATAYO Community NetEye.Cloud as a SaaS solution Accessing NetEye.Cloud Monitoring with NetEye.Cloud Monitoring Environment Business Service Monitoring VMD Asset Management in Neteye.Cloud Automatic Inventory Collection Software & License Management Contract & Supplier Management Change & Lifecycle Management SOC System Administrator (AdS) Access to NetEye and Elastic Elastic Dashboards Elastic Discover Elastic Alerts Elastic Rules Introduction to SOC Attacker Centric Service Description NetEye SIEM About SATAYO Threat Intelligence and Security Operations How SATAYO works MITRE ATT&CK Coverage SATAYO Findings SaaS & Managed Mode Before you start Update Procedure Single Node Upgrade from 4.48 to 4.49 Cluster Upgrade from 4.48 to 4.49 Satellite Upgrade from 4.48 to 4.49 DPO machine Upgrade from 4.48 to 4.49 Create a mirror of the RPM repository Sprint Releases Feature Troubleshooting Backup and Restore Tornado Networking Service Management - Incident Response IT Operation Analytics - Telemetry Identity Provider (IdP) Configuration NetEye Cluster on Microsoft Azure NetEye Cluster on AWS Introduction to NEP Getting Started with NEPs Online Resources Obtaining NEP Insights Available Packages Advanced Topics Upgrade to NetEye 4.31 Setup Configure swappiness Restarting Stopped Services Enable stack traces in web UI How to access standard logs Director does not deploy when services assigned to a host have the same name How to enable/disable debug logging Activate Debug Logging for Tornado Modules/Services do not start Sync Rule fails when trying to recreate Icinga object How to disable InfluxDB query logging Managing an Elasticsearch Cluster with a Full Disk Some logs are not indexed in Elasticsearch Elasticsearch is not functioning properly Reporting: Error when opening a report Debugging Logstash file input filter Bugfix Policy Reporting Vulnerabilities Glossary

Change & Lifecycle Management

A lifecycle is essentially a combination of a few core actions performed over time, kept together on the asset record. It is a built-in functionality of GLPI, which gives you full visibility and control over every stage of your IT assets’ lifecycle - from purchase to retirement.

Using Change & Lifecycle basics, you can achieve a number of important goals, such as:

  • knowing the current state and history of any asset,

  • quickly identifying assets due for maintenance, warranty renewal, or decommissioning,

  • fast troubleshooting and decision-making by linking assets to users, locations, contracts.

Below you can find main functionalities of the GLPI’s Asset Management Lifecycle.

Status as the Lifecycle Driver

Each asset has a Status (labels depend on configuration, typically In stock, In use, Under maintenance, Retired/Disposed). This is the simplest and most important way to represent “where the asset is” in its lifecycle.

You can open the asset (for example under Assets → Computers / Assets → Network equipment) and update Status in the asset form.
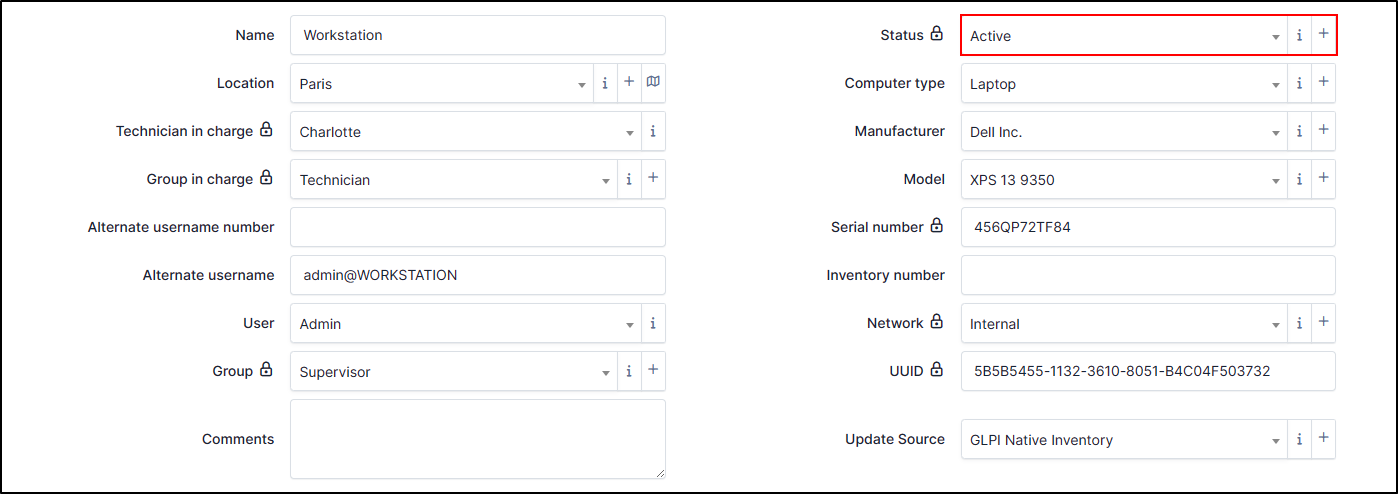
../../_images/status.png

Fig. 194 Asset Status

Typical flow:

  • In stock → available equipment (warehouse/spares)

  • In use → deployed and assigned

  • Under maintenance → temporarily unavailable (repair/diagnostics)

  • Retired/Disposed → end-of-life, kept for history/audit

Assignment and placement

As soon as an asset is deployed, you keep it aligned by linking it to:

  • a User (and optionally a responsible Group/Technician in charge, depending on your process)

  • a Location (physical site / office / rack / room)

This makes lifecycle information operational: status + user + location describe the real situation.

Procurement, stock, and delivery tracking

Lifecycle management also covers the “before production” steps:

  • registering assets coming from procurement,

  • keeping them in stock/warehouse until delivery,

  • recording the delivery/assignment moment when the asset becomes “in use”.

Change documentation on the asset

During its life, an asset changes (upgrades, repairs, replacements, configuration adjustments). In GLPI you capture this directly on the asset record by:

  • updating relevant fields (for example, key attributes that describe the item),

  • adding notes for context (what changed and why),

  • attaching documents (delivery notes, maintenance reports, manuals).

Financial, warranty, and contract context

To support lifecycle decisions (renew, repair, replace, retire), you keep:

  • financial information (where applicable),

  • warranty/coverage and/or links to Contracts.

Built-in history (traceability)

GLPI keeps an automatic history/audit trail of updates on the asset, so you can review how the asset evolved over time (status changes, assignment changes, field updates).