User Guide Functional Overview Requirements Architecture System Installation NetEye Additional Components Installation Setup The neteye Command Director NetEye Self Monitoring Tornado Business Service Monitoring IT Operation Analytics - Telemetry Geo Maps NagVis Audit Log Shutdown Manager Reporting ntopng Visual Monitoring with Alyvix Elastic Stack IT Operations (Command Orchestrator) Asset Management Service Level Management Cyber Threat Intelligence - SATAYO NetEye.Cloud Strategy Monitoring SOC System Administrator SOC Attacker Centric Cyber Threat Intelligence - SATAYO NetEye Update & Upgrade Backup and Restore How To NetEye Extension Packs Troubleshooting Security Policy Glossary
module icon Cyber Threat Intelligence - SATAYO
About SATAYO Threat Intelligence and Security Operations How SATAYO works SATAYO Items SaaS & Managed Mode
NetEye.Cloud Strategy Monitoring SOC System Administrator SOC Attacker Centric Cyber Threat Intelligence - SATAYO Introduction to NetEye Monitoring Business Service Monitoring IT Operation Analytics Visualization Network Visibility Log Management & Security Orchestrated Datacenter Shutdown Application Performance Monitoring User Experience Service Management Service Level Management & Reporting Requirements for a Node Cluster Requirements and Best Practices NetEye Satellite Requirements TCP and UDP Ports Requirements Additional Software Installation Introduction Single Node Cluster NetEye Master Master-Satellite Architecture Underlying Operating System Acquiring NetEye ISO Image Installing ISO Image Single Nodes and Satellites Cluster Nodes Configuration of Tenants Satellite Nodes Only Nodes behind a Proxy Additional NetEye Components Single Node Cluster Node Satellites Nodes only Verify if a module is running correctly Accessing the New Module Cluster Satellite Security Backup and Restore Identity and Access Management External Identity Providers Configure federated LDAP/AD Emergency Reset of Keycloak Configuration Advanced Configuration Roles Single Page Application in NetEye Module Permissions and Single Sign On Within NetEye Importing User Federation Groups inside another Group Importing OIDC IdP Groups inside another Group Resources Tuning Advanced Topics Basic Concepts & Usage Advanced Topics Monitoring Environment Templates Monitored Objects Import Monitored Objects Data Fields Deployment Icinga 2 Agents Configuration Baskets Dashboard Monitoring Status Icinga2 Features VMD Permissions Notifications Jobs API Configuring Icinga Monitoring Retention Policy NetEye Self Monitoring Concepts Collecting Events Add a Filter Node WHERE Conditions Iterating over Event fields Retrieving Payload of an Event Extract Variables Create a Rule Tornado Actions Test your Configuration Export and Import Configuration Example Under the hood Development Retry Strategy Configuration Thread Pool Configuration API Reference Configure a new Business Process Create your first Business Process Node Importing Processes Operators The ITOA Module Configuring User Permissions Telegraf Metrics in NetEye Telegraf Configuration Telegraf on Monitored Hosts Visualizing Dashboards Customizing Grafana The NetEye Geo Map Visualizer Map Viewer Configuring Geo Maps NagVis Audit Log Overview Shutdown Manager user Shutdown Manager GUI Shutdown Commands Advanced Topics Overview User Role Management Cube Use Cases ntopng and NetEye Integration Permissions Retention Advanced Topics Overview User Roles Nodes RDP Client Building Tools Editor: Interface Overview Editor: Script Building Editor: Managing Scripts Designer: Interface Overview Designer: Interface Options Designer: Component Tree Selector: Interface Overview Test Case Management Dashboard Use Cases Overview Architecture Authorization Kibana Elasticsearch Cluster Elasticsearch Configuration Replicas on a Single Node Elasticsearch Performance tuning Overview Enabling El Proxy Sending custom logs to El Proxy Configuration files Commands Elasticsearch Templates and Retentions El Proxy DLQ Blockchain Verification Handling Blockchain Corruptions El Proxy Metrics El Proxy Security El Proxy REST Endpoints Agents Logstash Elastic APM Elastic RUM Elastic XDR Log Manager - Deprecated Overview Authorization in the Command Orchestrator Module Configuring CLI Commands Executing Commands Overview Permissions Installation Single Tenancy Multitenancy Communication through a Satellite Asset collection methods Display asset information in monitoring host page Overview Customers Availability Event Adjustment Outages Resource Advanced Topics Introduction The Intelligence We Produce Mitre Attack Coverage Getting Started Settings SATAYO Items Intelligence Requirements Managed Service Request Form FAQ Changelog SATAYO Community NetEye.Cloud as a SaaS solution Accessing NetEye.Cloud Monitoring with NetEye.Cloud Monitoring Environment Business Service Monitoring VMD SOC System Administrator (AdS) Access to NetEye and Elastic Elastic Dashboards Elastic Discover Elastic Alerts Elastic Rules Introduction to SOC Attacker Centric Service Description NetEye SIEM About SATAYO Threat Intelligence and Security Operations How SATAYO works SATAYO Items SaaS & Managed Mode Before you start Update Procedure Single Node Upgrade from 4.46 to 4.47 Cluster Upgrade from 4.46 to 4.47 Satellite Upgrade from 4.46 to 4.47 DPO machine Upgrade from 4.46 to 4.47 Create a mirror of the RPM repository Sprint Releases Feature Troubleshooting Backup and Restore Tornado Networking Service Management - Incident Response IT Operation Analytics - Telemetry Identity Provider (IdP) Configuration NetEye Cluster on Microsoft Azure Introduction to NEP Getting Started with NEPs Online Resources Obtaining NEP Insights Available Packages Advanced Topics Upgrade to NetEye 4.31 Setup Configure swappiness Restarting Stopped Services Enable stack traces in web UI How to access standard logs Director does not deploy when services assigned to a host have the same name How to enable/disable debug logging Activate Debug Logging for Tornado Modules/Services do not start Sync Rule fails when trying to recreate Icinga object How to disable InfluxDB query logging Managing an Elasticsearch Cluster with a Full Disk Some logs are not indexed in Elasticsearch Elasticsearch is not functioning properly Reporting: Error when opening a report Debugging Logstash file input filter Bugfix Policy Reporting Vulnerabilities Glossary

SATAYO Items

SATAYO items are evidence entities collected from OSINT scans and correlated to represent your external attack surface.

All items are shown in the dedicated table page, which includes filters to narrow down the displayed items.

Clicking an entry opens a preview panel on the right with its details and, if present, related items. From the preview panel, clicking the icon near the Related title opens another tab with the list filtered to show its related items. Clicking the link icon on a related finding opens the same view, with the corresponding item’s preview panel automatically displayed.

List of items with the preview panel open of a selected item

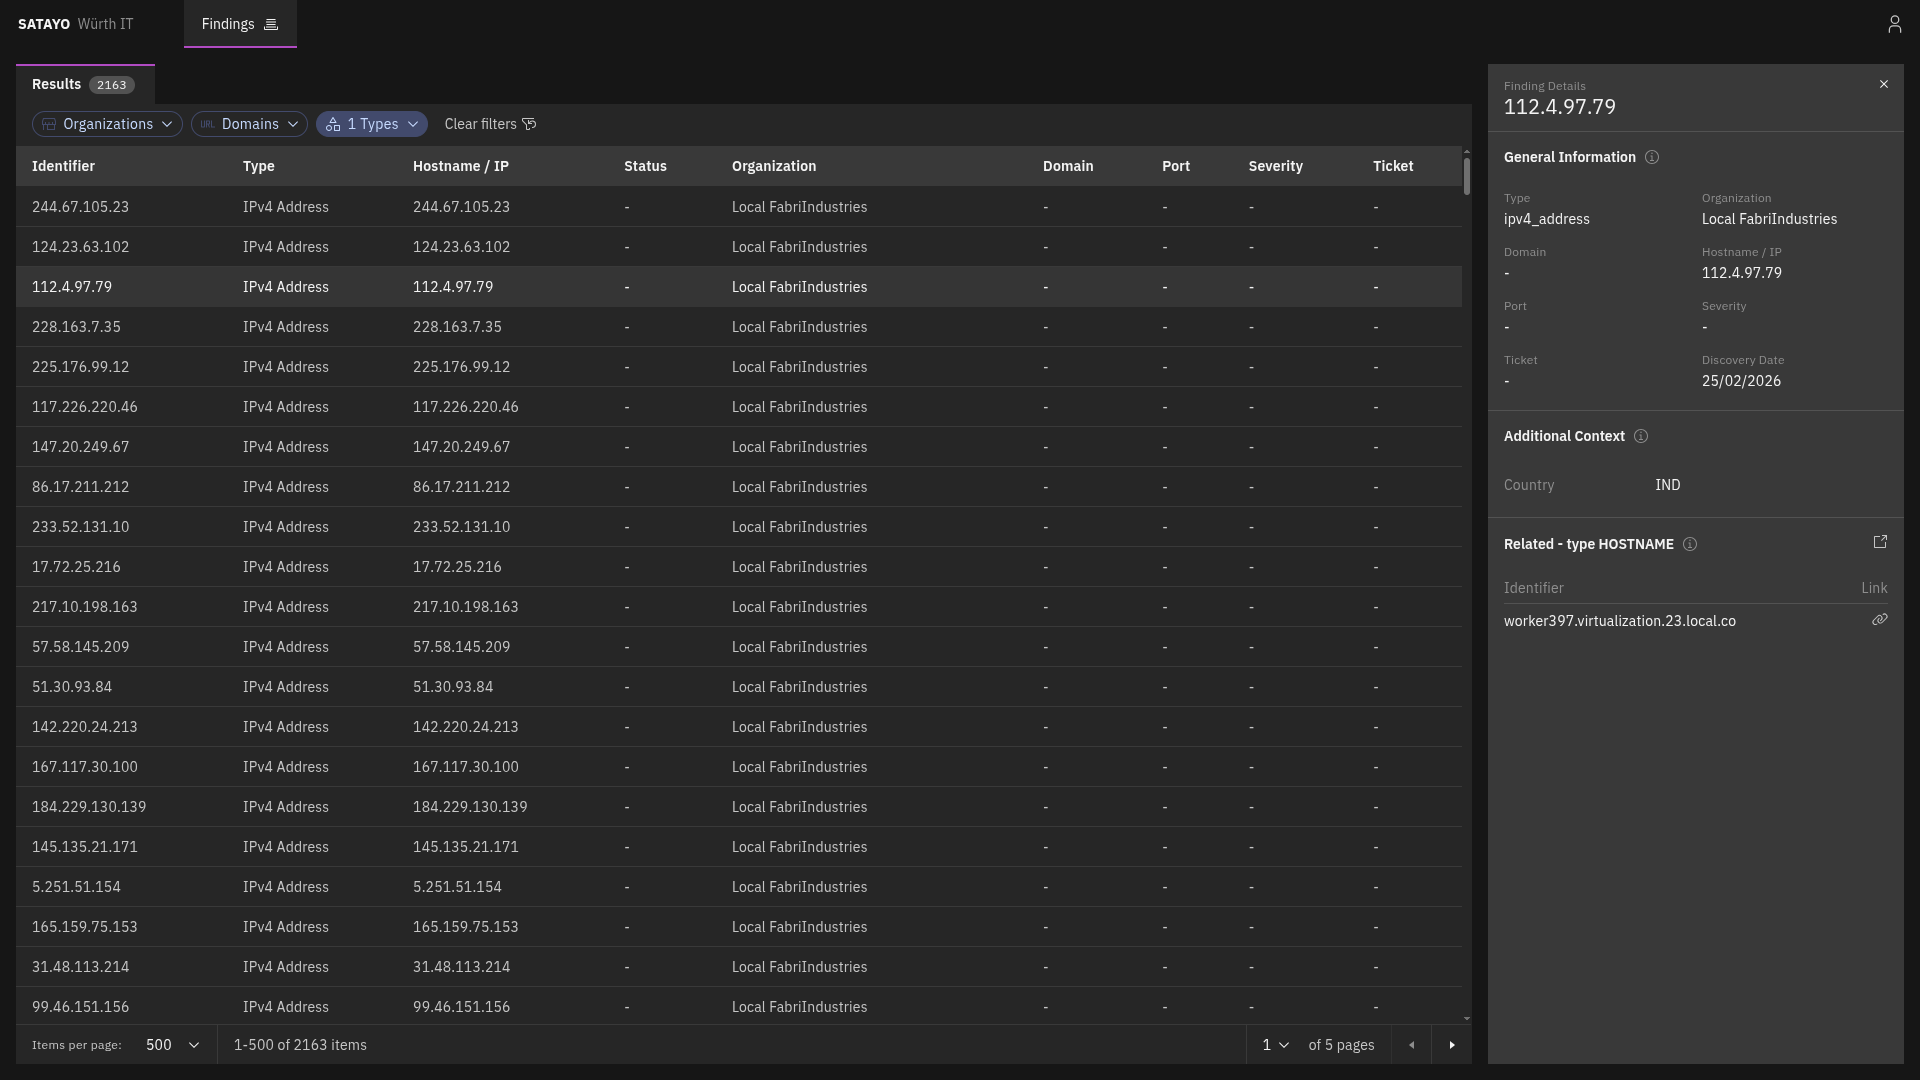
Fig. 228 List of items with the preview panel open of a selected item

List of related items with the preview panel open of a selected item

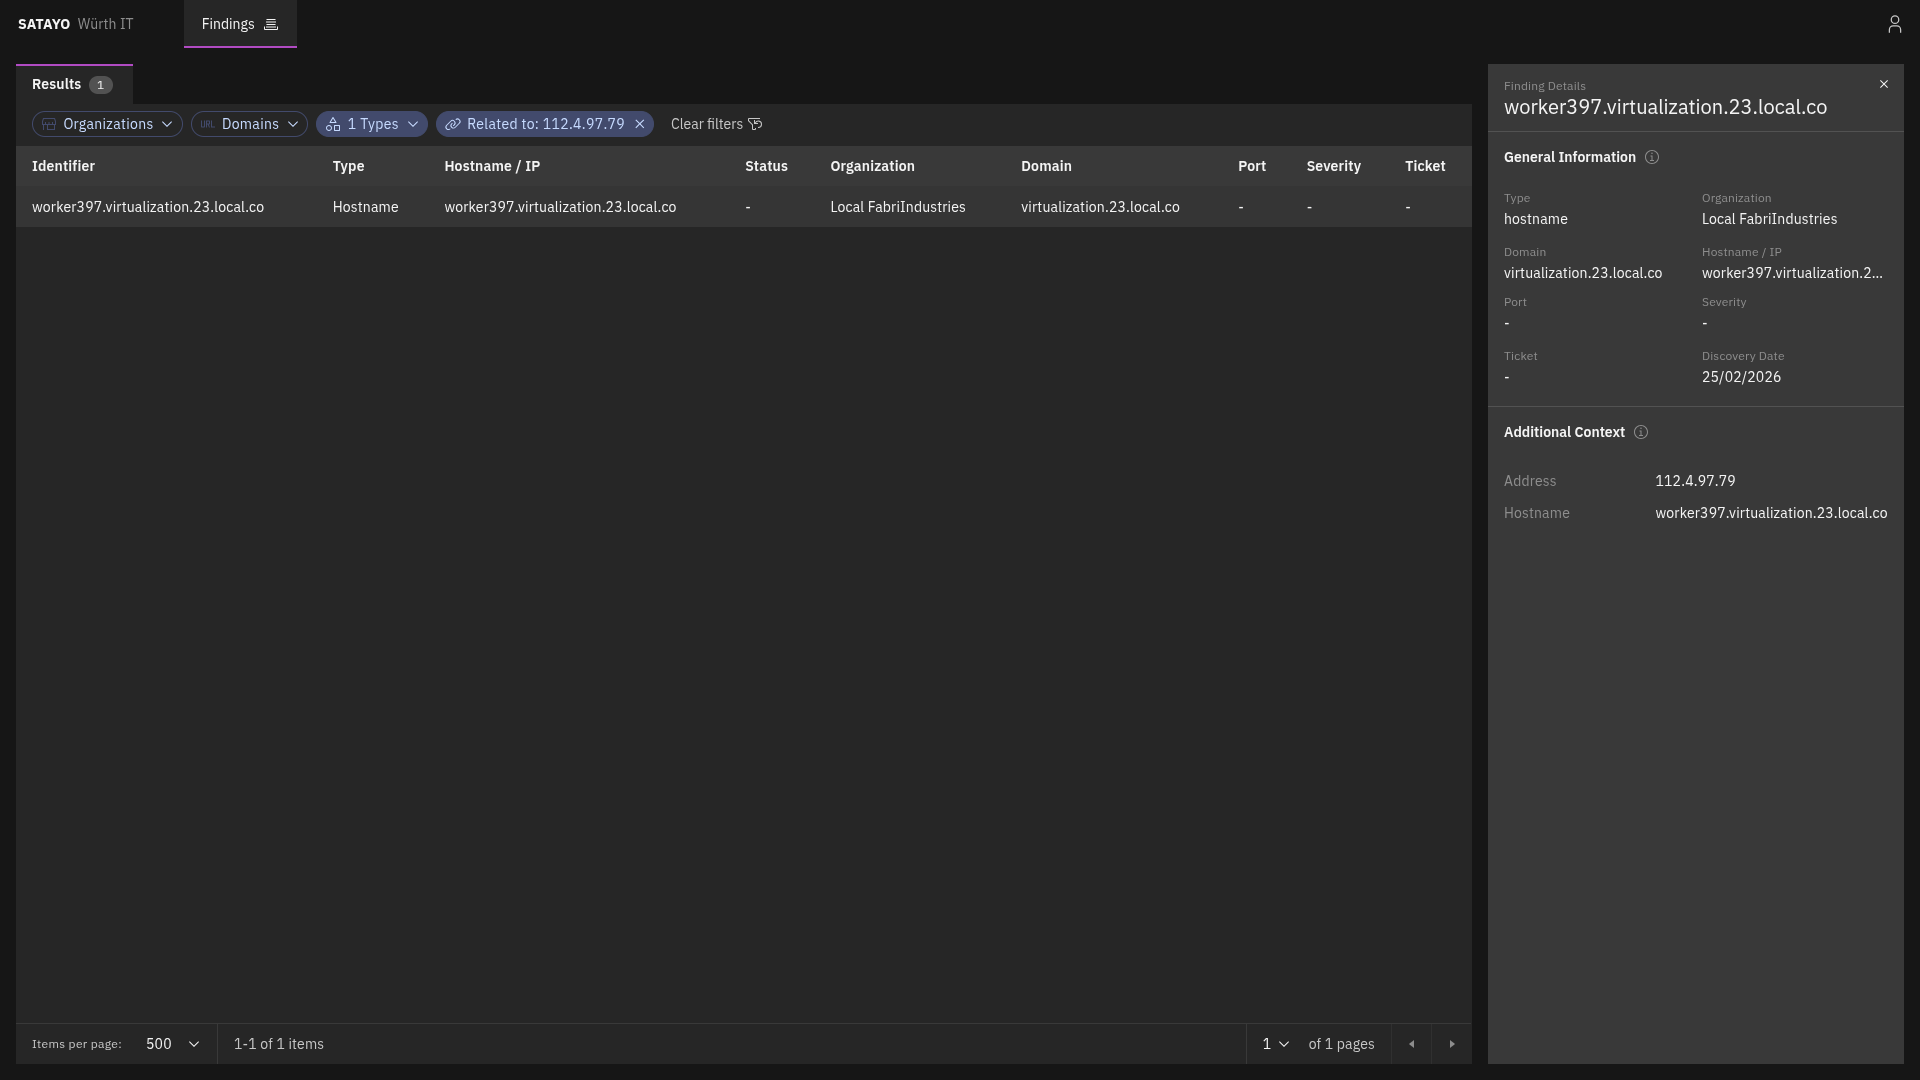
Fig. 229 List of related items with the preview panel open of a selected item


Hostname

Hostname, like IP addresses, is one of the items that SATAYO finds during its analysis. It is a human-readable name that corresponds to an IP address, making it easier to identify and remember. They are one of the starting points for SATAYO’s exposure assessment analysis, and they can provide valuable information about the services and applications running on a network.

They also work as aggregators for other items, such as Services, Mail servers, Mail, SSL/TLS certificates, and more.

They do not contribute directly to the EAIV score, as their mere existence doesn’t pose a risk.


IPv4 Address

The IPv4 address item represents a publicly reachable IP address discovered by SATAYO. It can be correlated to other items, such as Ports and Hostnames.


Port

Each port item complements an IPv4 address item and represents an exposed port on which a service or application at the IP address is listening.


Registry

The registry item consists of the subnet blocks where the retrieved found IP address resides. The addresses inside are scanned to see if there are other resolvable hostnames that, if found, are added to the list of hostnames and constitute an additional base for future scans and analysis.


CVE

The CVE item represents a publicly known vulnerability identified on a specific host during SATAYO analysis. Each item corresponds to a single CVE identifier detected on a particular host. If multiple vulnerabilities are discovered on the same host, a separate CVE item is created for each vulnerability.

For each vulnerability, SATAYO provides a link to the U.S. National Vulnerability Database (NVD), maintained by the National Institute of Standards and Technology (NIST), where detailed technical information about the CVE can be found.

When available, SATAYO also provides links to publicly known exploits or Proof-of-Concept (PoC) implementations associated with the vulnerability.

Additional contextual indicators are included to help prioritize remediation:

  • KEV (Known Exploited Vulnerabilities) — Indicates whether the vulnerability is listed in the catalog maintained by the Cybersecurity and Infrastructure Security Agency (CISA), which tracks vulnerabilities that are known to be actively exploited in the wild.

  • EPSS (Exploit Prediction Scoring System) — A data-driven model that estimates the probability that a vulnerability will be exploited in real-world attacks. The EPSS model produces a probability score expressed as a percentage (0–100%). The higher the score, the greater the likelihood that the vulnerability will be exploited.

EPSS is managed by Forum of Incident Response and Security Teams (FIRST), and SATAYO is included in the official list of EPSS-supported vendors.


Service

A service item represents a specific service or application exposed over HTTP on a particular port of an IP address and identified by a hostname.

It is always associated with a hostname, because the hostname is a determining factor in request routing. The HTTP server may use the hostname to route requests to the appropriate virtual host or service.

It provides information about the exposed HTTP service and web server, including:

  • Open ports with SSL/TLS enabled

  • Open ports without SSL/TLS enabled

Also service metadata, such as:

  • HTML title

  • meta-generator

  • maintainer email addresses

  • exposed server headers

  • unencrypted protocols in use

  • detected technologies