User Guide Functional Overview Requirements Architecture System Installation NetEye Additional Components Installation Setup The neteye Command Director NetEye Self Monitoring Tornado Business Service Monitoring IT Operation Analytics - Telemetry Geo Maps NagVis Audit Log Shutdown Manager Reporting ntopng Visual Monitoring with Alyvix Elastic Stack IT Operations (Command Orchestrator) Asset Management Service Level Management Cyber Threat Intelligence - SATAYO NetEye Update & Upgrade How To NetEye Extension Packs Troubleshooting Security Policy Glossary
module icon Visual Monitoring with Alyvix
Overview User Roles Nodes RDP Client Building Tools Editor: Interface Overview Editor: Script Building Editor: Managing Scripts Designer: Interface Overview Designer: Interface Options Designer: Component Tree Selector: Interface Overview Test Case Management Dashboard Use Cases
ntopng Visual Monitoring with Alyvix Elastic Stack IT Operations (Command Orchestrator) Asset Management Service Level Management Cyber Threat Intelligence - SATAYO Introduction to NetEye Monitoring Business Service Monitoring IT Operation Analytics Visualization Network Visibility Log Management & Security Orchestrated Datacenter Shutdown Application Performance Monitoring User Experience Service Management Service Level Management & Reporting Requirements for a Node Cluster Requirements and Best Practices NetEye Satellite Requirements TCP and UDP Ports Requirements Additional Software Installation Introduction Single Node Cluster NetEye Master Master-Satellite Architecture Underlying Operating System Acquiring NetEye ISO Image Installing ISO Image Single Nodes and Satellites Cluster Nodes Configuration of Tenants Satellite Nodes Only Nodes behind a Proxy Additional NetEye Components Single Node Cluster Node Satellites Nodes only Verify if a module is running correctly Accessing the New Module Cluster Satellite Security Identity and Access Management External Identity Providers Configure federated LDAP/AD Emergency Reset of Keycloak Configuration Advanced Configuration Roles Single Page Application in NetEye Module Permissions and Single Sign On Within NetEye Importing User Federation Groups inside another Group Importing OIDC IdP Groups inside another Group Resources Tuning Advanced Topics Basic Concepts & Usage Advanced Topics Monitoring Environment Templates Monitored Objects Import Monitored Objects Data Fields Deployment Icinga 2 Agents Configuration Baskets Dashboard Monitoring Status Icinga2 Features VMD Permissions Notifications Jobs API Configuring Icinga Monitoring Retention Policy NetEye Self Monitoring Concepts Collecting Events Add a Filter Node WHERE Conditions Iterating over Event fields Retrieving Payload of an Event Extract Variables Create a Rule Tornado Actions Test your Configuration Export and Import Configuration Example Under the hood Development Retry Strategy Configuration Thread Pool Configuration API Reference Configure a new Business Process Create your first Business Process Node Importing Processes Operators The ITOA Module Configuring User Permissions Telegraf Metrics in NetEye Telegraf Configuration Telegraf on Monitored Hosts Visualizing Dashboards Customizing Performance Graph The NetEye Geo Map Visualizer Map Viewer Configuring Geo Maps NagVis Audit Log Overview Shutdown Manager user Shutdown Manager GUI Shutdown Commands Advanced Topics Overview User Role Management Cube Use Cases ntopng and NetEye Integration Permissions Retention Advanced Topics Overview User Roles Nodes RDP Client Building Tools Editor: Interface Overview Editor: Script Building Editor: Managing Scripts Designer: Interface Overview Designer: Interface Options Designer: Component Tree Selector: Interface Overview Test Case Management Dashboard Use Cases Overview Architecture Authorization Kibana Elasticsearch Cluster Elasticsearch Configuration Replicas on a Single Node Elasticsearch Performance tuning Overview Enabling El Proxy Sending custom logs to El Proxy Configuration files Commands Elasticsearch Templates and Retentions El Proxy DLQ Blockchain Verification Handling Blockchain Corruptions El Proxy Metrics El Proxy Security El Proxy REST Endpoints Agents Logstash Elastic APM Elastic RUM Elastic XDR Log Manager - Deprecated Overview Authorization in the Command Orchestrator Module Configuring CLI Commands Executing Commands Overview Permissions Installation Single Tenancy Multitenancy Communication through a Satellite Asset collection methods Display asset information in monitoring host page Overview Customers Availability Event Adjustment Outages Resource Advanced Topics Introduction Getting Started SATAYO Items Settings Managed Service Mitre Attack Coverage Changelog Before you start Update Procedure Single Node Upgrade from 4.44 to 4.45 Cluster Upgrade from 4.44 to 4.45 Satellite Upgrade from 4.44 to 4.45 DPO machine Upgrade from 4.44 to 4.45 Create a mirror of the RPM repository Sprint Releases Feature Troubleshooting Tornado Networking Service Management - Incident Response IT Operation Analytics - Telemetry Identity Provider (IdP) Configuration NetEye Cluster on Microsoft Azure Introduction to NEP Getting Started with NEPs Online Resources Obtaining NEP Insights Available Packages Advanced Topics Upgrade to NetEye 4.31 Setup Configure swappiness Restarting Stopped Services Enable stack traces in web UI How to access standard logs Director does not deploy when services assigned to a host have the same name How to enable/disable debug logging Activate Debug Logging for Tornado Modules/Services do not start Sync Rule fails when trying to recreate Icinga object How to disable InfluxDB query logging Managing an Elasticsearch Cluster with a Full Disk Some logs are not indexed in Elasticsearch Elasticsearch is not functioning properly Reporting: Error when opening a report Debugging Logstash file input filter Bugfix Policy Reporting Vulnerabilities Glossary

Editor: Script Building

The scripting panel allows you to compose scripts using test case objects drawn from the Selector panel, specifying the ordering as well as the mode of use, whether sequential, conditional or loop. The scripting panel uses the blocks-based approach to scripting, letting you drag and drop test case objects, sections and maps, and then reorder and edit them.

When Alyvix Robot executes a script, it will interact with the web browser, other app, or even Windows itself, by following your script step by step, executing each test case object in the order indicated by the script.

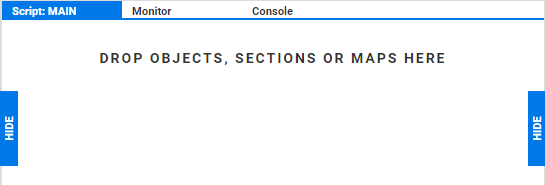
When Editor is first started with a new test case, there are no scripting nodes (elements that can appear in a script) yet, and thus the scripting panel is empty (the Monitor tab appears once a test case object has been created):

The scripting panel when empty.

Adding Scripting Nodes

There are several methods you can use to create a new scripting node in the scripting panel:

  • Immediately insert a node at the bottom of the currently displayed script in the scripting panel with the lineadd-icon action:

    • In Selector, lineadd-icon adds the associated test case object as a new RUN scripting node.

    • Clicking on lineadd-icon of a section will add it as a RUN expresion, while a map will appear as a FOR scripting node.

  • Drag and Drop to any location in the scripting panel with the action:

    • Drag a test case object from Selector to create a new scripting node (see below) that appears as a RUN expression in light green, indicating this test case object will be executed when its script is invoked.

    • Drag a section or map into the script management panel. As above, a section or map will show up as a RUN or FOR expression respectively.

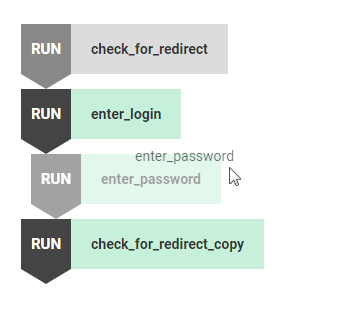
    When you drag a test case object, section or map and hover over an available position, the mouse pointer will switch from the   icon to showing the name of the test case object, moving other scripting nodes out of the way if necessary:

    Inserting a new scripting node in Alyvix Editor

Multiple test case objects can be added with the above methods to create scripts as large as necessary for the task.

You can replace an existing test case object by dragging a new one directly above it. You can also select multiple scripting nodes as usual in Windows with the usual Ctrl and Shift key combinations.

Two adjacent scripting nodes will be executed in sequence, with the lower node inheriting the state of the GUI that was modified by the node preceding it. So for instance in the script above, the RUNenter_login node would be executed before RUNcheck_login_success. The other types of scripting nodes are explained in the following section.

Script Expression Modes

There are four modes for scripting nodes that can be used in the scripting panel:

  1. Sequential Run — Simply run the test case object corresponding to that scripting node, then continue to the next one. If there are no more nodes left, the execution phase stops.

    RUN + Object/Section

  2. Conditionally true — Run the test case object in the first (antecedent) node as normal (including any actions). If it had at least one group where all of the subcomponents in that group matched, then also run the second (consequent) node.

    IF TRUE + Object + RUN + Object/Section

  3. Conditionally false — Run the test case object in the first (antecedent) node as normal (including any actions). If none of the groups matched, then also run the second (consequent) node.

    IF FALSE + Object + RUN + Object/Section

    Note that you should clear the Break flag on the antecedent, or else Alyvix will stop test case execution since that test case object failed, rather than continuing on to process the consequent.

  4. Loop — For each item contained in a map, execute the specified scripting node once for each row in the map’s table. When run in CLI output mode, the measures for each iteration will appear in the output.

    FOR + Map Name + RUN + Object/Section

Double-clicking on a scripting node’s mode will cycle it through the other modes in this order:

RUN > IF TRUE > IF FALSE > RUN

Note that double-clicking on the FOR mode won’t change it since it’s based on a map rather than a test case object.

Scripting Node Colors

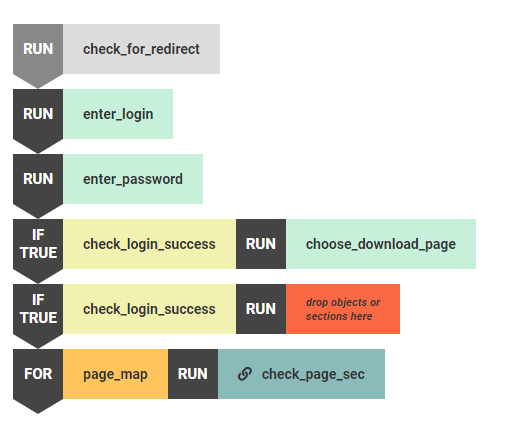
Each color used for the scripting nodes has a particular meaning. The following screenshot illustrates an example script, where each color is explained in the table below.

The various modes of script elements.

Color

Description

Gray

A disabled test case object of any mode

Light Green

An enabled test case object pulled from Selector

Yellow

An enabled test case object from Selector serving as an antecedent

Red

An unspecified scripting element serving as a consequent

Orange

An enabled map element within a FOR scripting node

Dark green

An enabled Section script (subroutine) — Clicking on the “link” icon will switch to the scripting panel for that Section

Scripting Node Actions

The two buttons at the bottom of the scripting panel work as follows:

  • DISABLE/ENABLE : Toggle whether a scripting node is enabled or disabled. Disabling allows you to temporarily switch off a given node without having to delete it and later re-add it, which may be useful for example when debugging scripts.

  • RUN SELECTION : Immediately execute the set of scripting nodes selected with the mouse, which again can be useful when debugging scripts.

  • REMOVE : Delete a scripting node.