Visualizing Dashboards
We have fully integrated Grafana dashboards into NetEye, accessible by selecting ITOA in the left sidebar menu.
Adding a Dashlet
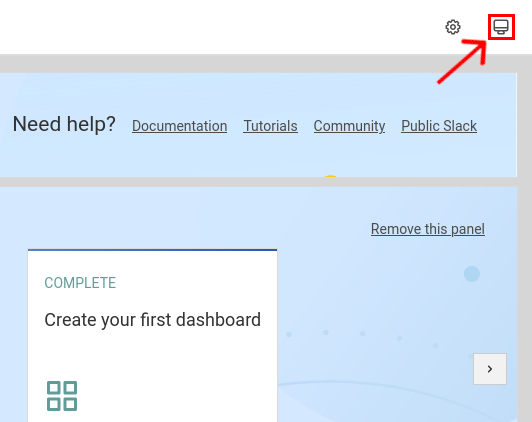
You can create a widget containing your ITOA Dashboard and add it to the NetEye home page by following the user guide in Using NetEye’s dashlets. Before copying the Grafana URL from the browser you can switch to your preferred Grafana visualization mode by clicking on the cycle-view icon

One click will remove the left menu
The second click will remove also the top bar
Global search integration
You can search within your dashboards simply by using Lampo search, or the NetEye global search box at the top of the screen.
The search results will be shown in a table in the main NetEye dashboard. You can open the resulting dashboard in a new tab.

