User Guide Functional Overview Requirements Architecture System Installation NetEye Additional Components Installation Setup The neteye Command Director NetEye Self Monitoring Tornado Business Service Monitoring IT Operation Analytics - Telemetry Geo Maps NagVis Audit Log Shutdown Manager Reporting ntopng Visual Monitoring with Alyvix Elastic Stack IT Operations (Command Orchestrator) Asset Management Service Level Management Cyber Threat Intelligence - SATAYO NetEye Update & Upgrade How To NetEye Extension Packs Troubleshooting Security Policy Glossary
module icon Director
Monitoring Environment Templates Monitored Objects Import Monitored Objects Data Fields Deployment Icinga 2 Agents Configuration Baskets Dashboard Monitoring Status VMD Permissions Notifications Jobs API Configuring Icinga Monitoring Retention Policy
Director NetEye Self Monitoring Tornado Business Service Monitoring IT Operation Analytics - Telemetry Geo Maps NagVis Audit Log Shutdown Manager Reporting Introduction to NetEye Monitoring Business Service Monitoring IT Operation Analytics Visualization Network Visibility Log Management & Security Orchestrated Datacenter Shutdown Application Performance Monitoring User Experience Service Management Service Level Management & Reporting Requirements for a Node Cluster Requirements and Best Practices NetEye Satellite Requirements TCP and UDP Ports Requirements Additional Software Installation Introduction Single Node Cluster NetEye Master Master-Satellite Architecture Underlying Operating System Acquiring NetEye ISO Image Installing ISO Image Single Nodes and Satellites Cluster Nodes Configuration of Tenants Satellite Nodes Only Nodes behind a Proxy Additional NetEye Components Single Node Cluster Node Satellites Nodes only Verify if a module is running correctly Accessing the New Module Cluster Satellite Security Identity and Access Management External Identity Providers Configure federated LDAP/AD Emergency Reset of Keycloak Configuration Advanced Configuration Authorization Resources Tuning Advanced Topics Basic Concepts & Usage Advanced Topics Monitoring Environment Templates Monitored Objects Import Monitored Objects Data Fields Deployment Icinga 2 Agents Configuration Baskets Dashboard Monitoring Status VMD Permissions Notifications Jobs API Configuring Icinga Monitoring Retention Policy NetEye Self Monitoring 3b Concepts Collecting Events Add a Filter Node WHERE Conditions Iterating over Event fields Retrieving Payload of an Event Extract Variables Create a Rule Tornado Actions Test your Configuration Export and Import Configuration Example Under the hood Development Retry Strategy Configuration Thread Pool Configuration API Reference Configure a new Business Process Create your first Business Process Node Importing Processes Operators The ITOA Module Configuring User Permissions Telegraf Metrics in NetEye Telegraf Configuration Telegraf on Monitored Hosts Visualizing Dashboards Customizing Performance Graph The NetEye Geo Map Visualizer Map Viewer Configuring Geo Maps NagVis 3b Audit Log 3b Overview Shutdown Manager user Shutdown Manager GUI Shutdown Commands Advanced Topics Overview User Role Management Cube Use Cases ntopng and NetEye Integration Permissions Retention Advanced Topics Overview User Roles Nodes Test Cases Dashboard Use Cases Overview Architecture Authorization Elasticsearch Overview Enabling El Proxy Sending custom logs to El Proxy Configuration files Commands Elasticsearch Templates and Retentions El Proxy DLQ Blockchain Verification Handling Blockchain Corruptions El Proxy Metrics El Proxy Security El Proxy REST Endpoints Agents Logstash Elastic APM Elastic RUM Log Manager - Deprecated Overview Authorization in the Command Orchestrator Module Configuring CLI Commands Executing Commands Overview Permissions Installation Single Tenancy Multitenancy Communication through a Satellite Asset collection methods Display asset information in monitoring host page Overview Customers Availability Event Adjustment Outages Resource Advanced Topics Introduction Getting Started SATAYO Items Settings Managed Service Mitre Attack Coverage Changelog Before you start Update Procedure Single Node Upgrade from 4.41 to 4.42 Cluster Upgrade from 4.41 to 4.42 Satellite Upgrade from 4.41 to 4.42 DPO machine Upgrade from 4.41 to 4.42 Create a mirror of the RPM repository Sprint Releases Feature Troubleshooting Tornado Networking Service Management - Incident Response IT Operation Analytics - Telemetry Identity Provider (IdP) Configuration Introduction to NEP Getting Started with NEPs Online Resources Obtaining NEP Insights Available Packages Advanced Topics Upgrade to NetEye 4.31 Setup Configure swappiness Restarting Stopped Services Enable stack traces in web UI How to access standard logs Director does not deploy when services assigned to a host have the same name How to enable/disable debug logging Activate Debug Logging for Tornado Modules/Services do not start Sync Rule fails when trying to recreate Icinga object How to disable InfluxDB query logging Managing an Elasticsearch Cluster with a Full Disk Some logs are not indexed in Elasticsearch Elasticsearch is not functioning properly Reporting: Error when opening a report Debugging Logstash file input filter Bugfix Policy Reporting Vulnerabilities Glossary 3b

Deployment

In Icinga2, configuration changes are stored in working memory until they are deployed, i.e., the Icinga2 configuration is generated and distributed to all agents in the zone. Initiating a deploy action will check configuration validity, recording the details of the outcome. There are two principal elements, both reachable from the main Director menu:

  • Deployment: Manage the actions around deploying a new configuration.

  • Activity Log: Look at the deployment history, and carry out actions on that history.

Deploying a Configuration

To deploy a modified configuration, go to Director > Deployments. There you will see the Deployments tab (Fig. 84) that shows all recent successful (green check) and failed (red ‘X’) deployment attempts along with the date and time of those actions. Clicking on the link will take you to the “Deployment details” panel that additionally contains any warnings that may have been issued, and a ‘Configuration’ link that will show you which configuration files were modified when the deployment occurred.

The deployments outcome panel

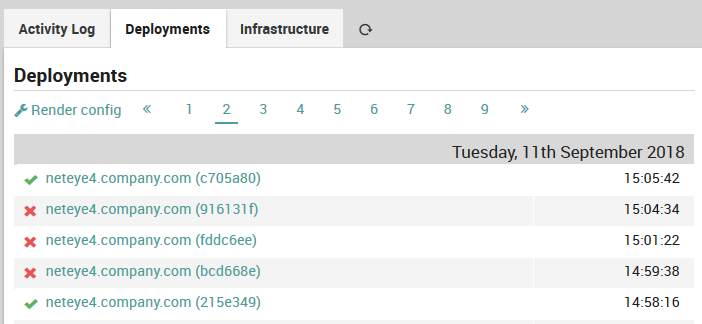
Fig. 84 The deployments outcome panel

Now click on the Render config action, which displays the “Generated config” panel, a summary of the newly generated configuration (Fig. 85). This panel contains a list of the files involved in the configuration changes, including a summary of the number of objects per file by type (objects, templates, or apply rules), and the new size of that file.

Deployment outcome panel

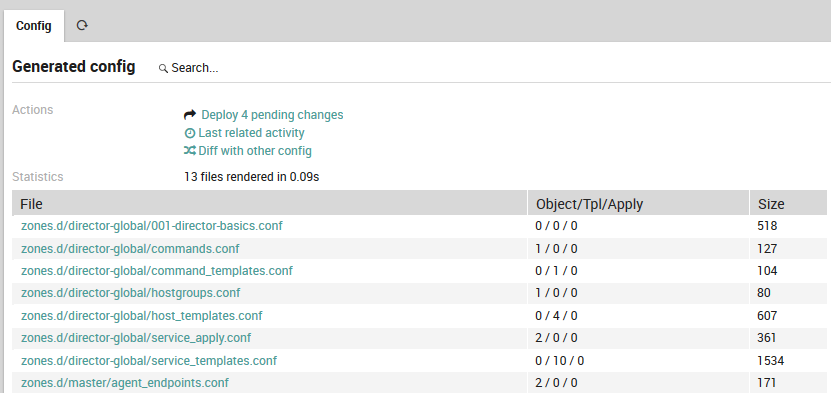
Fig. 85 Deployment outcome panel

You will now see three new actions:

  • Deploy pending changes: Implement the deployment, which distributes the configuration to all Icinga2 agents. You can distribute the deployment even if there are no changes to make.

  • Last related activity: Show differences between the current configuration and the most recent configuration before the current one.

  • Diff with other config: Compare any two configurations using their unique identifiers (the numbers in parentheses in Fig. 84). The current configuration is inserted by default.

Activity Log

The Activity Log Panel (Fig. 86) lets you look at the history of successful deployments, and carry out actions on items in that history.

The My changes action lets you switch from showing the history of all changes to the view showing only those changes you made. You can then click on All changes to return to viewing changes made by all users.

The activity log panel

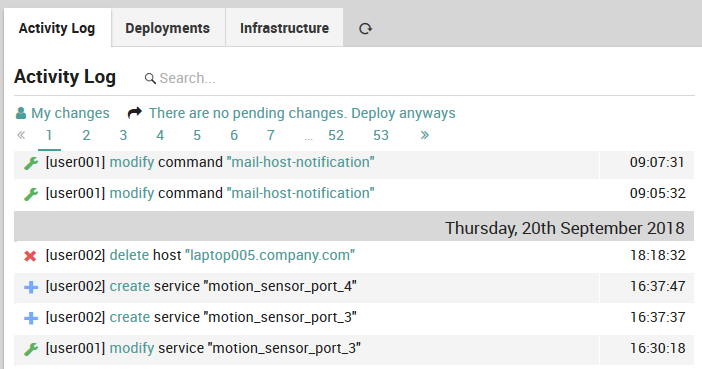
Fig. 86 The activity log panel

Each row represents a successful change to an object, coded for action type, user (“cli” indicates an automated action) and time. The action types are:

  • Create (a blue “+” icon)

  • Modify (a green “wrench” icon)

  • Delete (a red “x” icon)

A duplicate timestamp over consecutive rows indicates those objects were deployed at the same time. Clicking on the modify action type in particular will take you to the Diff panel (Fig. 87) that will detail exactly what changes were made.

Showing the differences between before and after configurations

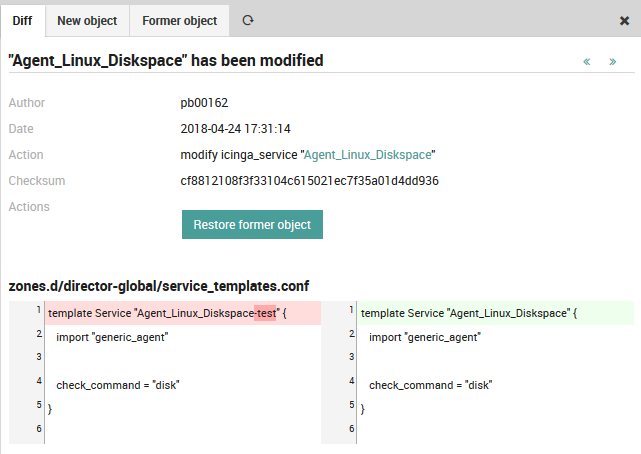
Fig. 87 Showing the differences between before and after configurations

Once you have completed a successful deployment of monitoring objects in Director, you can then go to the host monitoring panel (i.e.,g click on a host under Icinga Director ‣ Hosts ‣ Hosts) to check on the success of the overall monitoring configuration.