Tornado
How To Match on an Event With Dynamic OIDs
This How-To is intended to help you creating and configuring rules that match Events, where part of a key is dynamic. In particular we’re looking at Snmptraps containing OIDs with an increasing counter as a postfix.
This example shows a particular Snmptrapd Collector Event with dynamic OIDs; However, it applies perfectly to any situation where it is required to extract values from dynamically changing keys.
Understanding the Use Case
In some situations, Devices or Network Monitoring Systems emit SNMP Traps, appending a progressive number to the OIDs to render them uniquely identifiable. This leads to the generation of events with this format:
{
   "type":"snmptrapd",
   "created_ms":"1553765890000",
   "payload":{
      "protocol":"UDP",
      "src_ip":"127.0.1.1",
      "src_port":"41543",
      "dest_ip":"127.0.2.2",
      "PDUInfo":{
         "version":"1",
         "notificationtype":"TRAP"
      },
      "oids":{
         "MWRM2-NMS-MIB::netmasterAlarmNeIpv4Address.20146578": {
            "content": "127.0.0.12"
         },
         "MWRM2-NMS-MIB::netmasterAlarmNeStatus.20146578": {
            "content": "Critical"
         }
      }
   }
}
Here, the two entries in the oids section have a dynamic suffix
consisting of a number different for each event; in this specific event,
it is 20146578.
Due to the presence of the dynamic suffix, a simple path expression like
${event.payload.oids."MWRM2-NMS-MIB::netmasterAlarmNeIpv4Address".content}
would be ineffective. Consequently, we need a specific solution to
access the content of that changing key.
As we are going show, the solution consists of two steps: 1. Create a
Rule called my_extractor to extract the desired value from the
dynamic keys 2. Create a matching Rule that uses the extracted value
Step #1: Creation of an extractor Rule
To access the value of the
MWRM2-NMS-MIB::netmasterAlarmNeIpv4Address.?????? key, we will use
the single_key_match Regex extractor in the WITH clause.
The single_key_match extractor allows defining a regular expression
that is applied to the keys of a JSON object. If and only if there is
exactly one key matching it, the value associated with the matched key
is returned.
In our case the first rule is:
{
  "name": "my_extractor",
  "description": "",
  "continue": true,
  "active": true,
  "constraint": {
    "WHERE": null,
    "WITH": {
      "netmasterAlarmNeIpv4Address": {
        "from": "${event.payload.oids}",
        "regex": {
          "single_key_match": "MWRM2-NMS-MIB::netmasterAlarmNeIpv4Address.[0-9]+"
        }
      }
    }
  },
  "actions": []
}
This rule: - has an empty WHERE, so it matches every incoming event
- creates an extracted variable named netmasterAlarmNeIpv4Address;
this variables contains the value of the OID whose key matches the
regular expression:
MWRM2-NMS-MIB::netmasterAlarmNeIpv4Address.[0-9]+
When the previously described event is received, the extracted variable
netmasterAlarmNeIpv4Address will have the following value:
{
    "content": "127.0.0.12"
}
From this point, all the rules in the same Ruleset that follows the
my_extractor Rule can access the extracted value through the path
expression ${_variables.my_extractor.netmasterAlarmNeIpv4Address}.
Step #2: Creation of the matching Rule
We can now create a new rule that matches on the
netmasterAlarmNeIpv4Address extracted value. As we are interested in
matching the IP, our rule definition is:
{
  "name": "match_on_ip4",
  "description": "This rule matches all events whose netmasterAlarmNeIpv4Address is 127.0.0.12",
  "continue": true,
  "active": true,
  "constraint": {
    "WHERE": {
      "type": "equals",
      "first": "${_variables.my_extractor.netmasterAlarmNeIpv4Address.content}",
      "second": "127.0.0.12"
    },
    "WITH": {}
  },
  "actions": []
}
Now we have a rule that matches on the netmasterAlarmNeIpv4Address
using a static path expression even if the source Event contained
dynamically changing OIDs.
How To Use the Monitoring Executor for setting statuses on any object
This How To is intended to help you configure, use, and test the Monitoring Executor, a new Tornado feature that allows to automatically create new hosts, services, or both in case an event received by Tornado refers to objects not yet known to Icinga and the Director. The Monitoring Executor performs a process-check-results on Icinga Objects, creating hosts and services in both Icinga and the Director if they do not exist already.
Requirements for the Monitoring Executor
A setup is needed on both Tornado and Icinga Director / Icinga 2:
Tornado
In a production environment, Tornado can accept events from any collector and even via an HTTP POST request with a JSON payload; we will however show how to manually send an event to Tornado from the GUI to let a suitable rule to fire and create the objects.
To allow for a correct interaction between Tornado and Icinga 2 / Icinga Director, you need to make sure that the corresponding username and password are properly set to your dedicated Tornado user in the files:
/neteye/shared/tornado/conf/icinga2_client_executor.toml
/neteye/shared/tornado/conf/director_client_executor.toml
Note
If one or both passwords are empty, probably you need to execute the neteye install script, that will take care of setting the passwords.
Icinga Director / Icinga 2
In Icinga, create a host template and a service template that we will then use to create the hosts, so make sure to write down the name given to the two templates.
Create a host template called host_template_example with the following properties:
Check command: dummy
Execute active checks: No
Accept passive checks: Yes
Create a service template called service_template_example with the following properties:
Check command: dummy
Execute active checks: No
Accept passive checks: Yes
Deploy this configuration to Icinga 2
Scenario
We will set up a rule that intercepts an event sent by the SNMPtrapd Collector, so let’s suppose that Tornado receives the following event.
{
  "created_ms": 1000,
  "type": "snmptrapd",
  "payload": {
    "src_port": "9999",
    "dest_ip": "192.168.0.1",
    "oids": {
      "SNMPv2-MIB::snmpTrapOID.0": {
        "datatype": "OID",
        "content": "ECI-ALARM-MIB::eciMajorAlarm"
      },
      "ECI-ALARM-MIB::eciLSNExt1": {
        "content": "ALM_UNACKNOWLEDGED",
        "datatype": "STRING"
      },
      "ECI-ALARM-MIB::eciObjectName": {
        "content": "service.example.com",
        "datatype": "STRING"
      }
    },
    "src_ip": "172.16.0.1",
    "protocol": "UDP",
    "PDUInfo": {
      "messageid": 0,
      "notificationtype": "TRAP",
      "version": 1,
      "errorindex": 0,
      "transactionid": 1,
      "errorstatus": 0,
      "receivedfrom": "UDP: [172.16.0.1]:9999->[192.168.0.1]:4444",
      "community": "public",
      "requestid": 1
    }
  }
}
We want to use the payload of this event to carry out two actions:
Set the status of a service
create the host and service if the do not exist already.
To do so, we will build a suitable rule in Tornado, that defines the conditions for triggering the actions and exploits the Monitoring Executor’s ability to interact with Icinga to actually carry them out.
Warning
When you create your own rules, please pay attention to the correct escaping of the SNMP strings, or the rule might not fire correctly!
Step #1: Define the Rule’s Conditions
This first task is fairly simple: Given the event shown in the Scenario
above, we want to set a critical status on the service specified in
payload -> oids -> ECI-ALARM-MIB::eciObjectName -> content, when
both these conditions are met:
payload -> oids -> SNMPv2-MIB::snmpTrapOID.0 -> contentis equal toECI-ALARM-MIB::eciMajorAlarmpayload -> oids -> ECI-ALARM-MIB::eciLSNExt1 -> contentis equal toALM_UNACKNOWLEDGED
We capture all these conditions by creating the following rule in the Tornado GUI (you can set the not mentioned options at your preference):
Name: choose the name you prefer
Description: a string like Set the critical status for snmptrap
Constraint: you can copy and paste it for simplicity:
"WHERE": {
    "type": "AND",
    "operators": [
        {
          "type": "equals",
          "first": "${event.type}",
          "second": "snmptrapd"
        },
        {
          "type": "equals",
          "first": "${event.payload.oids.\"SNMPv2-MIB::snmpTrapOID.0\".content}",
          "second": "ECI-ALARM-MIB::eciMajorAlarm"
        },
        {
          "type": "equals",
          "first": "${event.payload.oids.\"ECI-ALARM-MIB::eciLSNExt1\".content}",
          "second": "ALM_UNACKNOWLEDGED"
        }
    ]
},
Step #2: Define the Actions
Now that we have defined the rule’s conditions, we want the rule to trigger the two actions
a Monitoring action that will set the critical status for the service specified in
payload -> oids -> ECI-ALARM-MIB::eciObjectName -> contentif necessary, create the underlying host and service in Icinga2 and in the Director
To do so we need to configure the payload of the Monitoring action as follows (check the snippet below).
action_name must be set to
create_and_or_process_service_passive_check_resultprocess_check_result_payload must contain:
the service on which to perform the process-check-result, using the
<host_name>!<service_name>notationexit_status for a critical event, which is equal to 2
a human readable plugin_output
The fields contained in this payload correspond to those that are used by the Icinga2 APIs, therefore you can also provide more data in the payload to create more precise rules.
host_creation_payload takes care of creating the underlying host with the following properties:
a (hard-coded) host name (although it can be configured from the payload of the event)
the host template we created in the Requirements section (i.e., host_template_example)
service_creation_payload takes care of creating the underlying service with the following properties:
the name of the service as provided in
payload -> oids -> ECI-ALARM-MIB::eciObjectName -> contentthe service template we created in the Requirements section (i.e., service_template_example)
the host as the one specified in
host_creation_payload
Warning
In process_check_result_payload it is mandatory to specify the object on which to perform the process-check-result with the field “service” (or “host”, in case of check result on a host). This means that for example specifying the object with the field “filter” is not valid
The above actions can be written as the following JSON code, that you can copy and paste within the Actions textfield of the rule. Make sure to maintain the existing square brackets in the textfield!
{
  "id": "monitoring",
  "payload": {
    "action_name": "create_and_or_process_service_passive_check_result",
    "process_check_result_payload": {
      "exit_status": "2",
      "plugin_output": "CRITICAL - Found alarm ${event.payload.oids.\"SNMPv2-MIB::snmpTrapOID.0\".content}",
      "service": "acme-host!${event.payload.oids.\"ECI-ALARM-MIB::eciObjectName\".content}",
      "type": "Service"
    },
    "host_creation_payload": {
      "object_type": "Object",
      "object_name": "acme-host",
      "imports": "host_template_example"
    },
    "service_creation_payload": {
      "object_type": "Object",
      "host": "acme-host",
      "object_name": "${event.payload.oids.\"ECI-ALARM-MIB::eciObjectName\".content}",
      "imports": "service_template_example"
    }
  }
}
Now we can save the rule and then deploy the Rule.
Step #3: Send the Event
With the rule deployed, we can now use the Tornado GUI’s test window to send a payload and test the rule.
In the test window, add snmptrapd as Event Type and paste the following code as Payload. Now, with the Enable execution of actions disabled, click on the Run test button. If everything is correct, you will see a MATCHED string appear on the left-hand side of the rule’s name. Now, enable the execution of actions and click again on the Run test button.
Now, on the NetEye GUI you should see that in both Icinga 2 and in the Director:
a new host unknown-host was created–in Icinga 2 it will have state pending since we did no checks on it
a new service service.example.com was created–in Icinga 2 with state critical (may be SOFT, depending on your configuration)
Conclusions
In this how-to we created a specific rule for setting the critical status of a non-existing service. Of course with more information on the incoming events we may want to add different rules so that Tornado can set the status of the service to ok for example, when another event with different content arrives.
How To Use the Numerical Operators
This How To is intended to help you configure, use and test rules involving the numerical operators, allowing you to compare quantities in a given Event either to each other or to a constant in the rule. One important use case is in IoT, where you may be remotely measuring temperatures, humidities, and other physically measurable quantities in order to decide whether, for example, to gracefully shut down a server.
Step #1: Simulating Rising Temperatures
Because IoT hardware and its reporting software differ significantly from one installation to another, we will simulate a rising series of temperatures (Celsius) resulting in an action to shut down a server.
To do this, we will construct an Event that we can repeat, manually changing the temperature each time:
# curl -H "content-type: application/json" \
       -X POST -vvv \
       -d '{"event":{"type":"iot-temp", "created_ms":111, "payload": {"temperature":55, "ip":"198.51.100.11"}}, "process_type":"Full"}' \
       http://localhost:4748/api/v1_beta/event/current/send | jq .
Step #2: Configuring a Rule with Comparisons
To start, let’s create a rule that checks all incoming IoT temperature events, extracts the temperature and source IP field, and if the temperature is too high, uses the Archive Executor to write a summary message of the event into a log file in a “Temperatures” directory, then a subdirectory named for the source IP (this would allow us to sort temperatures by their source and keep them in different log directories). Given the “high temperature” specification, let’s choose the “greater than” operator:
Operator |
Description |
|---|---|
gt |
Greater than |
ge |
Greater than or equal to |
lt |
Less than |
le |
Less than or equal to |
All these operators can work with values of type Number, String, Bool, null and Array, but we will just use Number for temperatures.
Now it’s time to build our rule. The event needs to be both of type iot-temp and to have its temperature measurement be greater than 57 (Celsius), which we will do by comparing the computed value of ${event.payload.temperature} to the number 57:
{
  "description": "This rule logs when a temperature is above a given value.",
  "continue": true,
  "active": true,
  "constraint": {
    "WHERE": {
      "type": "AND",
      "operators": [
        {
          "type": "equal",
          "first": "${event.type}",
          "second": "iot-temp"
        },
        {
          "type": "gt",
          "first":"${event.payload.temperature}",
          "second": 57
        }
      ]
    },
    "WITH": {}
  },
  "actions": [
    {
      "id": "archive",
      "payload": {
        "id": "archive",
        "payload": {
          "event": "At ${event.created_ms}, device ${event.payload.ip} exceeded the temperature limit at ${event.payload.temperature} degrees.",
          "archive_type": "iot_temp",
          "source": "${event.payload.ip}"
        }
      }
    }
  ]
}
We’d like our rule to output a meaningful message to the archive log, for instance:
At 17:43:22, device 198.51.100.11 exceeded the temperature limit at 59 degrees.
Our log message that implements string interpolation should then have the following template:
${event.created_ms}, device ${event.payload.ip} exceeded the temperature limit at ${event.payload.temperature} degrees.
So our rule needs to check incoming events of type iot-temp, and when one matches, extract the relevant fields from the payload array.
Remember to save our new rule where Tornado will look for active rules, which in the default configuration is /neteye/shared/tornado/conf/rules.d/. Let’s give it a name like 040_hot_temp_archive.json.
Also remember that whenever you create a new rule and save the file in that directory, you will need to restart the Tornado service. And it’s always helpful to run a check first to make sure there are no syntactic errors in your new rule:
# tornado --config-dir=/neteye/shared/tornado/conf check
# systemctl restart tornado.service
Step #3: Configure the Archive Executor
If you look at the file /neteye/shared/tornado/conf/archive_executor.toml, which is the configuration file for the Archive Executor, you will see that the default base archive path is set to /neteye/shared/tornado/data/archive/. Let’s keep the first part, but under “[paths]” let’s add a specific directory (relative to the base directory given for “base_path”). This will use the keyword “iot_temp”, which matches the “archive_type” in the “action” part of our rule from Step #2, and will include our “source” field, which extracted the source IP from the original event’s payload::
base_path =  "/neteye/shared/tornado/data/archive/"
default_path = "/default/default.log"
file_cache_size = 10
file_cache_ttl_secs = 1

[paths]
"iot_temp" = "/temp/${source}/too_hot.log"
Combining the base and specific paths yields the full path where the log file will be saved (automatically creating directories if necessary), with our “source” variable instantiated. So if the source IP was 198.51.100.11, the log file’s name will be:
/neteye/shared/tornado/data/archive/temp/198.51.100.11/too_hot.log
Then whenever an IoT temperature event is received above the declared temperature, our custom message with the values for time, IP and temperature will be written out to the log file.
Step #4: Watch Tornado “in Action”
Let’s observe how our newly configured temperature monitor works using a bash shell. Open a shell and trigger the following events manually:
# curl -H "content-type: application/json" \
       -X POST -vvv \
       -d '{"event":{"type":"iot-temp", "created_ms":111, "payload": {"temperature":55, "ip":"198.51.100.11"}}, "process_type":"Full"}' \
       http://localhost:4748/api/v1_beta/event/current/send | jq .
# curl -H "content-type: application/json" \
       -X POST -vvv \
       -d '{"event":{"type":"iot-temp", "created_ms":111, "payload": {"temperature":57, "ip":"198.51.100.11"}}, "process_type":"Full"}' \
       http://localhost:4748/api/v1_beta/event/current/send | jq .
So far if you look at our new log file, you shouldn’t see anything at all. After all, the two temperature events so far haven’t been greater than 57 degrees, so they haven’t matched our rule:
# cat /neteye/shared/tornado/data/archive/temp/198.51.100.11/too_hot.log
<empty>
And now our server has gotten hot. So let’s simulate the next temperature reading:
# curl -H "content-type: application/json" \
       -X POST -vvv \
       -d '{"event":{"type":"iot-temp", "created_ms":111, "payload": {"temperature":59, "ip":"198.51.100.11"}}, "process_type":"Full"}' \
       http://localhost:4748/api/v1_beta/event/current/send | jq .
There you should see the full event written into the file we specified during Step #2:
   # cat /neteye/shared/tornado/data/archive/temp/198.51.100.11/too_hot.log
   At 17:43:22, device 198.51.100.11 exceeded the temperature limit at 59 degrees.

Wrapping Up
That’s it! You’ve successfully configured Tornado to respond to high temperature events by logging them in a directory specific to temperature sensor readings for each individual network device.
You can also use different executors, such as the Icinga 2 Executor, to send IoT events as monitoring events straight to Icinga 2 where you can see the events in a NetEye dashboard. The Icinga documentation shows you which commands the executor must implement to achieve this.
How To Use the Icinga2 Executor with String Interpolation
This advanced How To is intended to help you configure, use and test the Icinga2 Executor in combination with the String Interpolation feature, creating a passive check-only monitoring service result with dynamic generation of the check’s resulting content. The general approach however can be used to dynamically execute Icinga 2 actions (or any other action) based on the content of the event.
Step #1: Prerequisites
Tornado:
For testing purposes we will manually send an event to Tornado via the shell. In a production environment, Tornado can accept events from any collector and even via an HTTP POST request with a JSON payload.
Make sure that the username and password are properly set to your dedicated Tornado user in Icinga 2:
/neteye/shared/tornado/conf/icinga2_client_executor.toml
Icinga Director / Icinga 2:
Create a host called host.example.com* with no particular requirements
Create a service template with the following properties:
Check command: dummy
Execute active checks: No
Accept passive checks: Yes
Create a service* called my_dummy on the host host.example.com that imports the previously created service template
Deploy this configuration to Icinga 2
Step #2: Service and Rule Configuration
Below is an example of an event that we will use throughout this How To, including sending it to Tornado. For now, keep it handy as you read the next section, since the rules we will configure are based on this specific format:
{
  "type": "dummy_passive_check",
  "created_ms": 1000,
  "payload": {
    "hostname": "host.example.com",
    "service": "my_dummy",
    "exit_status": "2",
    "measured": {
        "result1": "0.1",
        "result2": "98"
    }
  }
}
Now let’s configure a rule with the following WHERE constraints:
It matches events of type dummy_passive_check
It requires the service name to be my_dummy
It contains the critical exit_code 2
We can achieve this by creating the following rule in
/neteye/shared/tornado/conf/rules.d/, in a file called
900_icinga2_my_checkresult_crit.json:
{
  "description": "Set the critical status for my_dummy checks in Icinga 2",
  "continue": true,
  "active": true,
  "constraint": {
    "WHERE": {
      "type": "AND",
      "operators": [
        {
          "type": "equal",
          "first": "${event.type}",
          "second": "dummy_passive_check"
        },
        {
          "type": "equal",
          "first": "${event.payload.service}",
          "second": "my_dummy"
        },
        {
          "type": "equal",
          "first": "${event.payload.exit_status}",
          "second": "2"
        }
      ]
    },
    "WITH": {}
  },
  "actions": []
}
In addition, we want our rule to trigger an Icinga 2 action with a passive check result that:
Applies to the my_dummy service of the host in ${event.payload.hostname}
Sets the exit_status to critical* (=2)
Adds a human readable plugin_output
Adds a machine readable performance_data field with two simple static thresholds:
result1 perfdata: contains imaginary millisecond duration, with 300ms warn and 500ms crit threshold
result2 perfdata: contains imaginary percentages, with 80% warn and 95% crit
Now let’s add these desired actions to the rule above to create this final version:
{
  "description": "Set the critical status for my_dummy checks in Icinga 2",
  "continue": true,
  "active": true,
  "constraint": {
    "WHERE": {
      "type": "AND",
      "operators": [
        {
          "type": "equal",
          "first": "${event.type}",
          "second": "dummy_passive_check"
        },
        {
          "type": "equal",
          "first": "${event.payload.service}",
          "second": "my_dummy"
        },
        {
          "type": "equal",
          "first": "${event.payload.exit_status}",
          "second": "2"
        }
      ]
    },
    "WITH": {}
  },
  "actions": [
    {
      "id": "icinga2",
      "payload": {
        "icinga2_action_name": "process-check-result",
        "icinga2_action_payload": {
          "exit_status": "${event.payload.exit_status}",
          "plugin_output": "CRITICAL - Result1 is ${event.payload.measured.result1}ms Result2 is ${event.payload.measured.result2}%",
          "performance_data": "result_1=${event.payload.measured.result1}ms;300.0;500.0;0.0 result_2=${event.payload.measured.result2}%;80;95;0",
          "filter": "host.name==\"${event.payload.hostname}\" && service.name==\"${event.payload.service}\"",
          "type": "Service"
        }
      }
    }
  ]
}
Remember that whenever you create a new rule or edit an existing one, you will need to restart the Tornado service. It is also helpful to run a check to make sure there are no syntactic errors in your new rule:
# tornado --config-dir=/neteye/shared/tornado/conf check
# systemctl restart tornado.service
If you performed all the above steps correctly, you should notice that whenever an event matches the rule, the body of the generated action will no longer contain any of the original placeholders ${event.payload.*}. In fact, they are replaced by the actual values extracted from the event. If one or more placeholders cannot be resolved, the entire action will fail.
Step #3: Send the Event and Set the Status
Open a browser and verify that you have deployed the required configuration to Icinga 2. This can be done by navigating to the Overview > Services > host.example.com: my_dummy service (note that this link will not work if you have not followed all the steps above). You should see that it is still in the Pending state as no active checks have been executed.
We can now use the tornado-send-event helper command to send the JSON content of a file to the Tornado API. So now create a file called payload.json with the following content in your home directory:
{
  "type": "dummy_passive_check",
  "created_ms": 1000,
  "payload": {
    "hostname": "host.example.com",
    "service": "my_dummy",
    "exit_status": "2",
    "measured": {
        "result1": "0.1",
        "result2": "98"
    }
  }
}
Send it to Tornado using the following command:
# tornado-send-event ~/payload.json
This should trigger our rule and produce a response similar to the following:
{
    "event": {
        "type": "dummy_passive_check",
        "created_ms": 1000,
        "payload": {
            "service": "my_dummy",
            "measured": {
                "result1": "0.1",
                "result2": "98"
            },
            "exit_status": "2",
            "hostname": "host.example.com"
        }
    },
    "result": {
        "type": "Rules",
            "rules": {
                "rules": {
                    [...omitted...]
                    "icinga2_my_checkresult_crit": {
                        "rule_name": "icinga2_my_checkresult_crit",
                        "status": "Matched",
                        "actions": [
                        {
                            "id": "icinga2",
                            "payload": {
                                "icinga2_action_name": "process-check-result",
                                "icinga2_action_payload": {
                                "exit_status": "2",
                                "filter": "host.name==\"host.example.com\" && service.name==\"my_dummy\"",
                                "performance_data": "result_1=0.1ms;300.0;500.0;0.0 result_2=98%;80;95;0",
                                "plugin_output": "CRITICAL - Result1 is 0.1ms Result2 is 98%",
                                "type": "Service"
                            }
                        }
                    }
                },
                "message": null
            ],
               [...omitted...]
               "extracted_vars": {}
        }
    }
}
Now open your browser and check the service in Icinga 2 again. You’ll see that it has NOT changed yet. This behavior is intentional: in order to avoid triggering actions accidentally, the tornado-send-event command executes no actions by default. We can tell Tornado to actually execute the actions by passing the -f flag to the script as follows:
tornado-send-event ~/payload.json -f
Checking the Service once again should now show that it has turned red and its state has become soft critical. Depending on your configuration, after a few additional executions it will end up in the hard critical state.
As you may notice, if we change the exit_code in the event payload to anything other than 2, the rule will no longer match since we filter out everything that is not a critical event. Adding another rule that filters only on OK states (exit_code == 0), and then sets the service state to an OK state, is left as an exercise to the reader.
How To Send vSphereDB Events or Alarms to Tornado
This How To is intended to explain you the workflow to send all events and alarms of vSphereDB - VMWare to Tornado, such that you can use the monitoring executor to send passive check results.
You can see a sketch of the workflow in the following diagram.
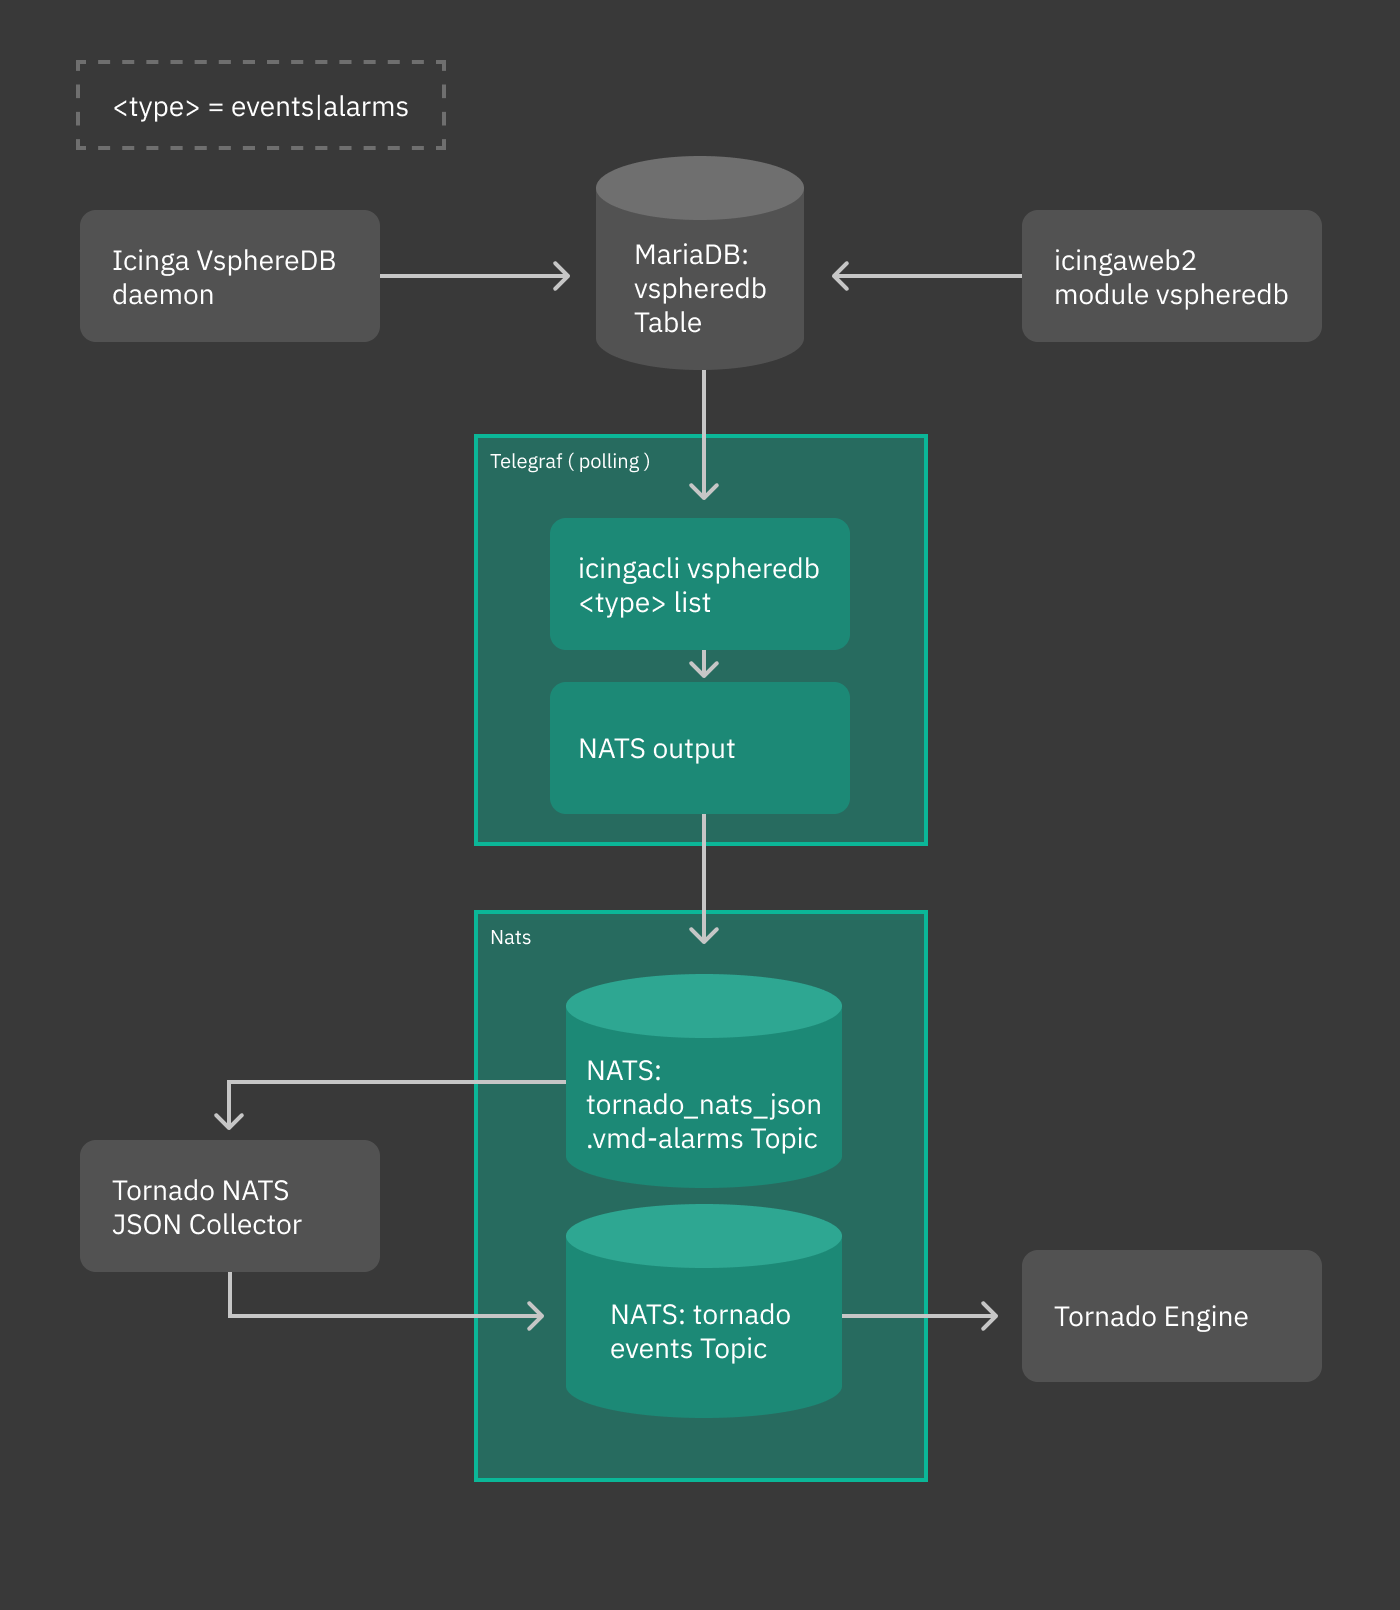
Fig. 243 vsphere workflow
In our scenario, we receive an alarm about a virtual machine whose memory usage surpasses a given threshold. We want that a new host be created, with a service in CRITICAL status. To do so, we also exploit the abilities of the recently introduced Monitoring Executor.
Overview
Events and alarms collected by vSphere/VMD are sent to telegraf, then converted to JSON and fed to the Tornado NATS JSON Collector. All this part of the process is automatic. When installed, suitable configuration files are written in order to simplify the whole process of intercommunication across these services.
Once the event or the alarm reaches Tornado, it can be processed by writing appropriate rules to react to that event or alarm. This is the only part of the whole process that requires some effort.
In the remainder of this how to we give some high level description of the various involved parts and conclude with the design of a rule that matches the event output by vSphere.
Telegraf plugin
The telegraf plugin is used to collect the metrics from the vSphereDB
i.e. events or alarms via the exec input plugin. This input plugin
executes the icingacli command
icingacli vspheredb <events/alarms> list --mark-as-read to fetch
them in JSON format from the vSphereDB and send it to NATS as output
using the nats output plugin.
To keep track of the events and alarms sent, a database table is created, which stores the last fetched IDs of the events and alarms.
Warning
When updating Tornado in existing installations, the latest event and alarm will be marked. Only more recent events and alarms will then be sent to tornado, to avoid flooding the Tornado engine.
NATS JSON Collector
The newly introduced NATS JSON Collector will receive the vSphere events and alarms in JSON format from the NATS communication channel and then convert them into the internal Tornado Event structure, and forward them to the Tornado Engine.
Tornado Event Rule
Now, suppose you receive the following alarm from vSphere:
{
  "type": "tornado_nats_json.vmd-alarms",
  "created_ms": 1596023834321,
  "payload": {
    "data": {
      "fields": {
        "alarm_name": "Virtual machine memory usage",
        "event_type": "AlarmStatusChangedEvent",
        "full_message": "Alarm Virtual machine memory usage on pulp2-repo-vm changed from Gray to Red",
        "moref": "vm-165825",
        "object_name": "pulp2-repo-vm",
        "object_type": "VirtualMachine",
        "overall_status": "red",
        "status_from": "gray",
        "status_to": "red"
      },
      "name": "exec_vmd_alarm",
      "tags": {
        "host": "0f0892f9a8cf"
      },
      "timestamp": 1596023830
    }
  }
}
This alarm notifies that a virtual machine changed its memory usage from Gray to Red, along with other information. We want that for incoming alarms like these, Tornado emits a notification. We need therefore to define a Constraint that matches the abovementioned alarm:
{
  "WHERE": {
    "type": "AND",
    "operators": [
      {
        "type": "equals",
        "first": "${event.type}",
        "second": "tornado_nats_json.vmd-alarms"
      },
      {
        "type": "equals",
        "first": "${event.payload.data.fields.event_type}",
        "second": "AlarmStatusChangedEvent"
      },
      {
        "type": "equals",
        "first": "${event.payload.data.fields.status_to}",
        "second": "red"
      }
    ]
  },
  "WITH": {}
}
The corresponding Actions can be defined like in the following sample snippet:
[
  {
    "id": "monitoring",
    "payload": {
      "action_name": "create_and_or_process_service_passive_check_result",
      "host_creation_payload": {
        "object_type": "Object",
        "imports": "vm_template",
        "object_name": "${event.payload.data.fields.object_name}"
      },
      "service_creation_payload": {
        "object_type": "Object",
        "host": "${event.payload.data.fields.object_name}",
        "imports": "vm_alarm_service_template",
        "object_name": "${event.payload.data.fields.event_type}"
      },
      "process_check_result_payload": {
        "type": "Service",
        "service": "${event.payload.data.fields.object_name}!${event.payload.data.fields.event_type}",
        "exit_status": "2",
        "plugin_output": "CRITICAL - Found alarm '${event.payload.data.fields.alarm_name}' ${event.payload.data.fields.full_message}"
      }
    }
  }
]
This action creates a new host with the following characteristics, retrieved from the JSON sent from vSphere:
the name of the host will be extracted from the
event.payload.data.fields.object namefield, therefore it will be pulp2-repo-vmthe associated service will be defined from the
event.payload.data.fields.event_typefield, hence AlarmStatusChangedEvent
How To Create Independent Pipelines with a Filter
We can use Filters to organize coherent set of Rules into isolated pipelines.
In this example we will see how to create two independent pipelines, one that receives only events with type ‘email’, and the other that receives only those with type ‘trapd’.
Our configuration directory will look like this::
rules.d
  |- email
  |    |- ruleset
  |    |     |- ... (all rules about emails here)
  |    \- only_email_filter.json
  |- trapd
  |    |- ruleset
  |    |     |- ... (all rules about trapds here)
  |    \- only_trapd_filter.json
  \- filter_all.json
This Processing Tree has a root Filter filter_all that matches all events. We have also defined two inner Filters; the first, only_email_filter, only matches events of type ‘email’. The other, only_trapd_filter, matches just events of type ‘trap’.
Therefore, with this configuration, the rules defined in email/ruleset receive only email events, while those in trapd/ruleset receive only trapd events.
This configuration can be further simplified by removing the filter_all.json file:
rules.d
  |- email
  |    |- ruleset
  |    |     |- ... (all rules about emails here)
  |    \- only_email_filter.json
  \- trapd
       |- ruleset
       |     |- ... (all rules about trapds here)
       \- only_trapd_filter.json
In this case, in fact, Tornado will generate an implicit Filter for the root node and the runtime behavior will not change.
Below is the content of our JSON Filter files.
Content of filter_all.json (if provided):
{
  "description": "This filter allows every event",
  "active": true
}
Content of only_email_filter.json:
{
  "description": "This filter allows events of type 'email'",
  "active": true,
  "filter": {
    "type": "equals",
    "first": "${event.type}",
    "second": "email"
  }
}
Content of only_trapd_filter.json:
{
  "description": "This filter allows events of type 'trapd'",
  "active": true,
  "filter": {
    "type": "equals",
    "first": "${event.type}",
    "second": "trapd"
  }
}