AXTrace
Overview
AXTrace is a Windows service designed and engineered to monitor two core components of Microsoft Dynamics AX 2012: Application Object Servers (AOS) and Microsoft Dynamics AX client (AX client). It extends NetEye’s ITOA module gathering and processing data on these two components of Microsoft Dynamics AX, allowing to recognise patterns and behaviours.
Microsoft Dynamics AX natively provides a couple of Windows Performance Counters metrics that can be collected with Telegraf agent.
AXTrace as a strong point provides metrics with a context: instance, user, session and control/form in use.
Usage Scenarios
Infrastructure monitoring
IT managers primarily want to prevent bottlenecks, optimize and plan for improvements. They need real-time visibility into the state of the environment when collecting requests, users’ complaints and feedback and must necessarily identify as quickly and safely as possible, for example, the source of an error encountered by a user.
The aggregate metrics of AXTrace permit to understand the workload generated by Microsoft Dynamics AX: this is essential to understand resource utilization, to understand resource utilization and whether the resources are well-sized or changes are required.
It is easy to see, for example:
SQL business database: source, number and duration of queries actually generated
AOSService: instances overloaded
Users: number of transactions opened, duration of actual activities, presence of zombie processes
It is common having the need to understand if a slowdown and generally unsatisfactory performances are due to hardware resources, virtualization, operating system settings, software design, etc: AXTrace provides objective measures on which to base decisions that often involve demanding costs in terms of time and money, and which therefore cannot be taken on the basis of mere suppositions.
Software customization validation and bug research
An AX developer needs to check whether the performance meets the design guidelines and to spot potential bugs.
Developers can analyze performances in a wide range of areas, for example:
Batch jobs: duration of a batch job and of the single job, workload of each task and so on
SQL queries: duration of queries, number of queries generated by a task, number of lines retrieved, lines fetch duration and so on
Users requests: number of request generated during an operation on AX client, size of data retrieved and so on
Reports: duration of report, workload generated and so on
Workflows analysis: duration of a picking list, of a sales order, on hand inventory and so on
A developer has at first the need to verify the impact of his customizations in a production environment: a production Microsoft Dynamics AX installation is by far more complex then a development environment, with the obvious consequence that some performances and/or issues are not reproducible or even unpredictable during the design phase.
AXTrace aggregate metrics allow to identify the instance, the user, the session and the workspace of a specific task. Therefore, it becomes possible to isolate a pattern or a workflow: once this isolation/individuation process has been successfully performed a developer doing an analysis can focus on details, similarly to what happens in a development environment.
A further and well appreciated extension is the possibility of having a deep detailed trace per user in an importable format with dinamic AX Trace Parser.
Note
Every possibility of making visible metrics that could in some way violate the privacy of AX users has been carefully avoided: the final result allows us to confirm that the only information relating to users is those visible natively from the SysUsersOnline form in AX client.
Monitoring of Application Object Servers
The Application Object Server component (AOS/AOSService more commonly) is the core of the entire AX environment and the activities are organized in a session-based strategy: we have various types of session with different roles, i.e. rpc-user-sessions, worker-sessions and web-sessions.
The metrics built have been chosen to continue to reflect this internal structure of the component with appropriate light tagging. Tagging allows you to do filtering and grouping operations on metrics: the richer the tagging, the higher the level of coverage reachable with the analysis.
Exposed metrics
The example shows an ETW metric, one of the two Application Object Servers’ metrics, along with EWT_stats, exposed by AXTrace.
ETW,AxInstance=01@axprodaos01,AxUser=axuser2,AxSession=17 RPC_nestlevel0_count=79i,RPC_nestlevel0_duration=54i,RPC_all_count=4321i,RPC_server_duration=54i,RPC_client_duration=0i,
RPC_whole_duration=11i,RPC_bytes_recd=11i,RPC_bytes_sent=34287i,SQL_stmt_count=1i,SQL_stmtType_call=0i,SQL_stmtType_delete=0i,SQL_stmtType_insert=0i,SQL_stmtType_none=0i,SQL_stmtType_other=0i,
SQL_stmtType_select=1i,SQL_stmtType_update=0i,SQL_stmt_duration=21i,SQL_stmt_preparation_duration=0i,SQL_modelstoredproc_count=1i,SQL_modelstoredproc_duration=2i,SQL_modelstoredproc_preparation_duration=0i,
FETCH_fetches_count=2i,FETCH_duration=78i,FETCH_rows_count=2i,FETCH_fetchcumu_count=1i,FETCH_cumu_duration=213i 1655482050123583100
ETW
ETW is an ensemble of aggregate metrics describing main AOSService functions: the name ETW is the abbreviation for *Event Tracing for Windows*, the tracing facility on which the agent is based.
Name |
Description |
|---|---|
AxInstance |
Instances of AOSService |
AxUser |
AX UserID (unique AX internal User ID for each domain user having access to the environment) |
AxSession |
Session id (useful for quickly identifying a batchjob or a single user problem) |
If a field has value equal to 0 it is not sent.
Name |
Description |
|---|---|
RPC_nestlevel0_count |
Integer, number of RPC call from AX client (level 0 means that child subcalls aren’t considered) |
RPC_nestlevel0_duration |
Integer, milliseconds duration of RPC call from AX client (level 0 means that child subcalls aren’t considered) |
RPC_all_count |
Integer, number of RPC call at any level of nested structure |
RPC_server_duration |
Integer, milliseconds duration of RPC call from AX client to AOSService (even levels of nested structure) |
RPC_client_duration |
Integer, milliseconds duration of RPC call from AOSService to AX client (odd levels of nested structure) |
RPC_whole_duration |
Integer, nanoseconds elapsed since last RPC call from AX client at level 0 |
RPC_bytes_recd |
Integer, bytes received by AOSService as payload of RPC protocol |
RPC_bytes_sent |
Integer, bytes sent by AOSService as payload of RPC protocol |
RPC_<label> |
Integer, histogram of rpc calls duration at level 0. Default labels are 50ms,100ms,200ms,500ms,1sec,2sec,5sec,10sec,over10sec: each label excepting the last one represents the max value of histogram interval, i.e. 500ms is for min: 200ms - max: 500ms. The last interval are all rpc calls of duration over 10 seconds. |
SQL_stmt_count |
Integer, number of total SQL queries on AX business database |
SQL_stmtType_call |
Integer, number of total SQL queries on AX business database of type “store procedure execute” |
SQL_stmtType_delete |
Integer, number of total SQL queries on AX business database of type “delete” |
SQL_stmtType_insert |
Integer, number of total SQL queries on AX business database of type “insert” |
SQL_stmtType_other |
Integer, number of total SQL queries on AX business database of type “unknown” |
SQL_stmtType_none |
Integer, number of total SQL queries on AX business database where type detection has failed |
SQL_stmtType_select |
Integer, number of total SQL queries on AX business database of type “select” |
SQL_stmtType_update |
Integer, number of total SQL queries on AX business database of type “update” |
SQL_stmt_duration |
Integer, milliseconds duration of all SQL queries on AX business database |
SQL_stmt_preparation_duration |
Integer, milliseconds preparation duration of all SQL queries on AX business database |
SQL_stmt_<label> |
Integer, histogram of SQL queries duration on AX business database. Default labels are 50ms,100ms,200ms,500ms,1sec,2sec,over2sec: each label excepting the last one represents the max value of histogram interval, i.e. 500ms is for min: 200ms - max: 500ms. The last interval are all queries of duration over 2 seconds. |
SQL_modelstoredproc_count |
Integer, number of total SQL queries on AX modelstore database |
SQL_modelstoredproc_duration |
Integer, milliseconds duration of all SQL queries on AX modelstore database |
SQL_modelstoredproc_preparation_duration |
Integer, milliseconds preparation duration of all SQL queries on AX modelstore database |
SQL_modelstoredproc_<label> |
Integer, histogram of SQL queries duration on AX modelstore database. Default labels are 50ms,100ms,200ms,500ms,1sec,2sec,over2sec: each label excepting the last one represents the max value of histogram interval, i.e. 500ms is for min: 200ms - max: 500ms. The last interval are all queries of duration over 2 seconds. |
FETCH_fetches_count |
Integer, number of total SQL fetches |
FETCH_duration |
Integer, milliseconds duration of all SQL fetches |
FETCH_rows_count |
Integer, number of total rows fetched by SQL fetches |
FETCH_fetchcumu_count |
Integer, number of total SQL fetches, sum over all opened cursors |
FETCH_cumu_duration |
Integer, milliseconds duration of all SQL fetches, sum over all opened cursors (the number of cursors is not retrievable) |
FETCH_<label> |
Integer, histogram of SQL fetches. Default labels are 50ms,100ms,200ms,500ms,1sec,2sec,over2sec: each label excepting the last one represents the max value of histogram interval, i.e. 500ms is for min: 200ms - max: 500ms. The last interval are all fetches of duration over 2 seconds. |
ETW_stats
ETW_stats is an ensemble of aggregate metrics describing main AOSService functions.
It has been evident in our experience that long-term analysis do not benefit from the AxSession: on the contrary, this high level of detail makes the analysis steps slow and cumbersome with useless and redundant information. So in parallel it was created a downsampling mechanism that creates further metrics and eliminates AxSession.
Name |
Description |
|---|---|
AxInstance |
Instances of AOSService |
AxUser |
AX UserID (unique AX internal User ID for each domain user having access to the environment) |
Name |
Description |
|---|---|
RPC_nestlevel0_count_{min|max|sum} |
Integer, aggregates min,max and sum grouping by AxSession field ETW.RPC_nestlevel0_count |
RPC_nestlevel0_duration_{min|max|sum} |
Integer, aggregates min,max and sum grouping by AxSession field ETW.RPC_nestlevel0_duration |
RPC_all_count_{min|max|sum} |
Integer, aggregates min,max and sum grouping by AxSession field ETW.RPC_all_count |
RPC_client_duration_{min|max|sum} |
Integer, aggregates min,max and sum grouping by AxSession field ETW.RPC_client_duration |
RPC_whole_duration_{max|count} |
Integer, aggregates max and count grouping by AxSession field ETW.RPC_whole_duration |
RPC_bytes_recd_{min|max|sum} |
Integer, aggregates min,max and sum grouping by AxSession field ETW.RPC_bytes_recd |
RPC_bytes_sent_{min|max|sum} |
Integer, aggregates min,max and sum grouping by AxSession field ETW.RPC_bytes_sent |
RPC_<label>_{min|max|sum} |
Integer, aggregates min,max and sum grouping by AxSession for each field ETW.RPC_<label> |
SQL_stmt_count_{min|max|sum} |
Integer, aggregates min,max and sum grouping by AxSession field ETW.SQL_stmt_count |
SQL_stmt_duration_{min|max|sum} |
Integer, aggregates min,max and sum grouping by AxSession field ETW.SQL_stmt_duration |
SQL_stmt_preparation_duration_{min|max|sum} |
Integer, aggregates min,max and sum grouping by AxSession field ETW.SQL_stmt_preparation_duration |
SQL_stmt_<label>_{min|max|sum} |
Integer, aggregates min,max and sum grouping by AxSession for each field ETW.SQL_stmt_<label> |
SQL_modelstoredproc_count_{min|max|sum} |
Integer, aggregates min,max and sum grouping by AxSession field ETW.SQL_modelstoredproc_count |
SQL_modelstoredproc_duration_{min|max|sum} |
Integer, aggregates min,max and sum grouping by AxSession field ETW.SQL_modelstoredproc_duration |
SQL_modelstoredproc_preparation_duration_{min|max|sum} |
Integer, aggregates min,max and sum grouping by AxSession field ETW.SQL_modelstoredproc_preparation_duration |
SQL_modelstoredproc_<label> |
Integer, aggregates min,max and sum grouping by AxSession for each field ETW.SQL_modelstoredproc_<label> |
FETCH_fetches_count_{min|max|sum} |
Integer, aggregates min,max and sum grouping by AxSession field ETW.FETCH_fetches_count |
FETCH_duration_{min|max|sum} |
Integer, aggregates min,max and sum grouping by AxSession field ETW.FETCH_duration |
FETCH_rows_count_{min|max|sum} |
Integer, aggregates min,max and sum grouping by AxSession field ETW.FETCH_rows_count |
FETCH_fetchcumu_count_{min|max|sum} |
Integer, aggregates min,max and sum grouping by AxSession field ETW.FETCH_fetchcumu_count |
FETCH_cumu_duration_{min|max|sum} |
Integer, aggregates min,max and sum grouping by AxSession field ETW.FETCH_cumu_duration |
FETCH_<label> |
Integer, aggregates min,max and sum grouping by AxSession for each field ETW.FETCH_<label> |
Dashboard
There are two dashboards, with metrics ETW and ETW_stats and a parallel design that facilitates the simultaneous use of both: it is thus possible to combine the speed of a more general view and the completeness of the detailed one.
The dashboards provided have following controls:
Name |
Description |
|---|---|
AXT |
Filter server hosting AOSService instances |
USER |
Filter ax user_id |
SESSION |
Filter ax session_id (on detailed dashboard only) |
Name |
Description |
|---|---|
AGGR_INTERVAL |
Time interval for aggregate view in bar charts: helps increase the responsiveness of the dashboard |

Fig. 161 RPC/SQL general stats dashboard

Fig. 162 RPC/SQL detailed stats dashboard
Remote procedure calls metrics
Components like Microsoft Dynamics AX client and .NET Business Connector communicate with AOS service via RPC protocol: in charts (RPC/SQL general stats: Rpc calls durations and counts charts by instance and user) and (RPC/SQL detailed stats: Rpc calls durations and counts charts by instance, user and session) it is possible to view the number and duration of these calls.
Notice how the nested schema of the rpc calls remains visible in the metric structure: counts and durations are splitted among nestlevel0,server and client groups.
Whole duration allows you to view active long calls.
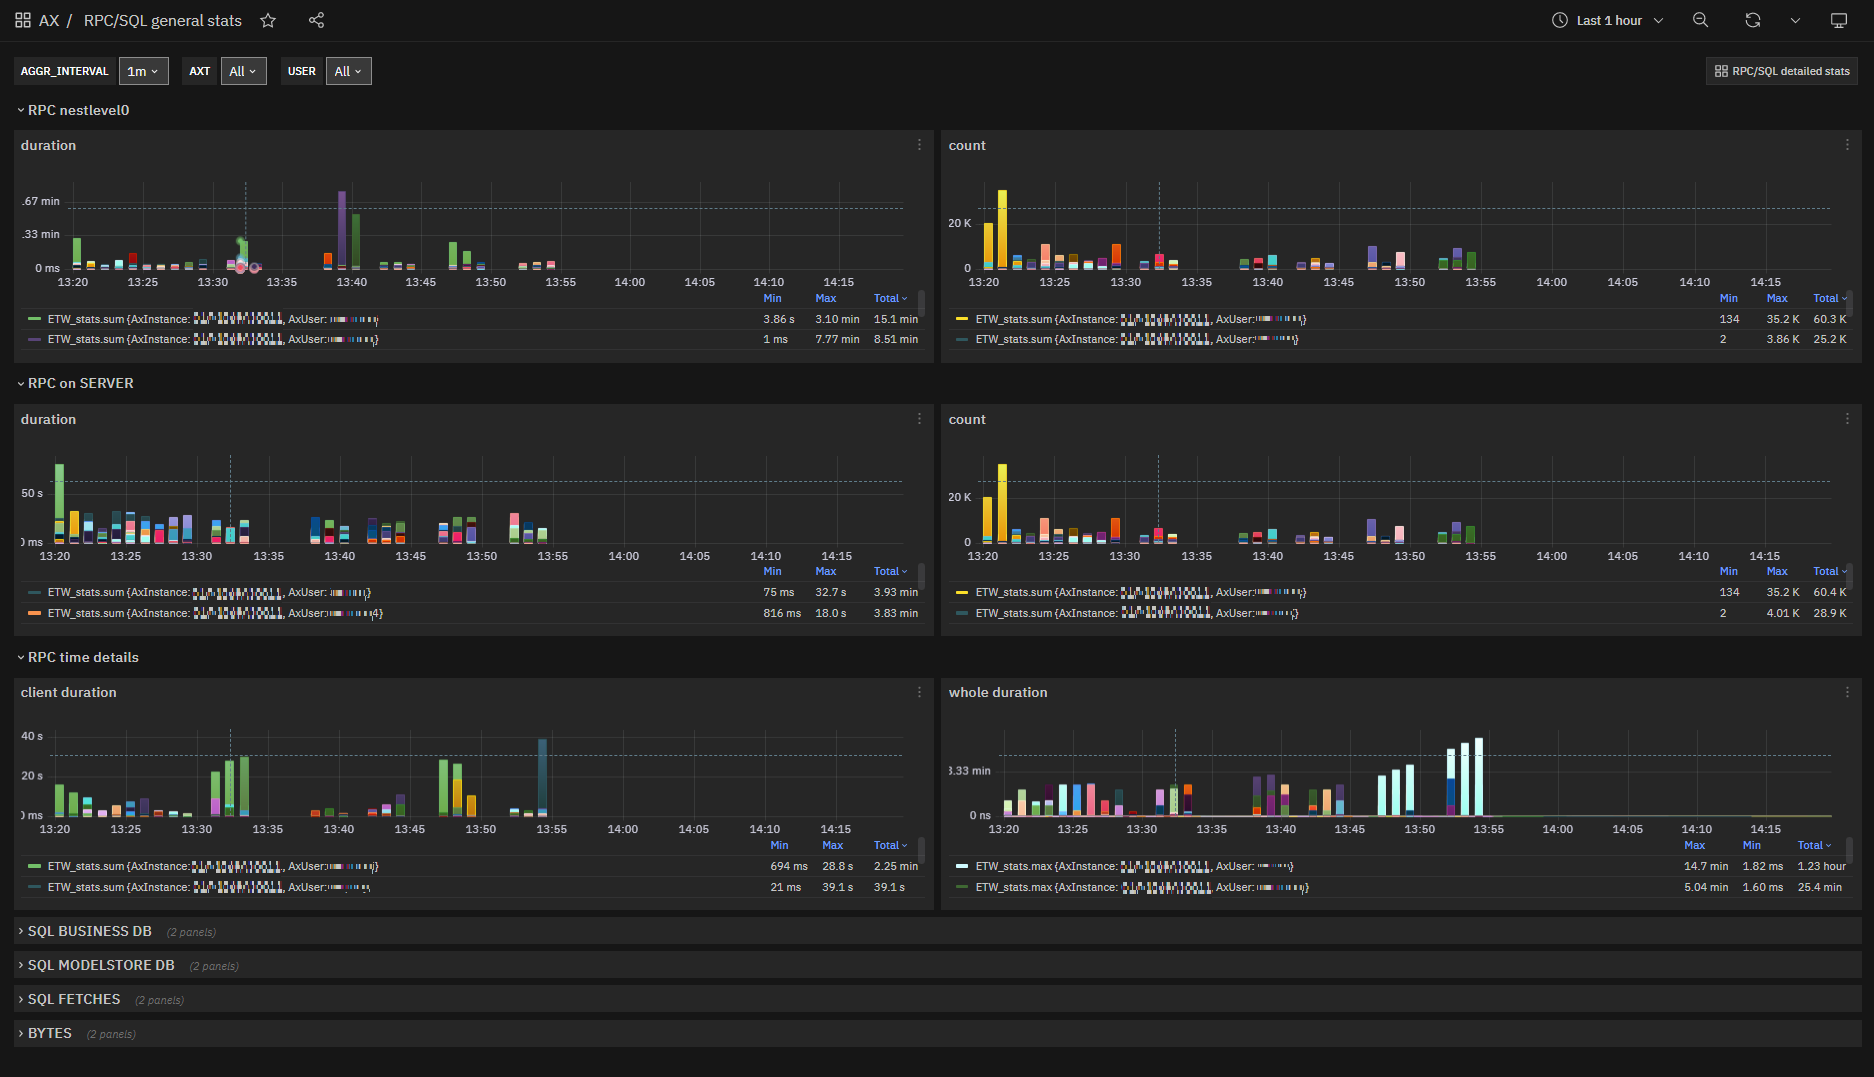
Fig. 163 RPC/SQL general stats: Rpc calls durations and counts charts by instance and user
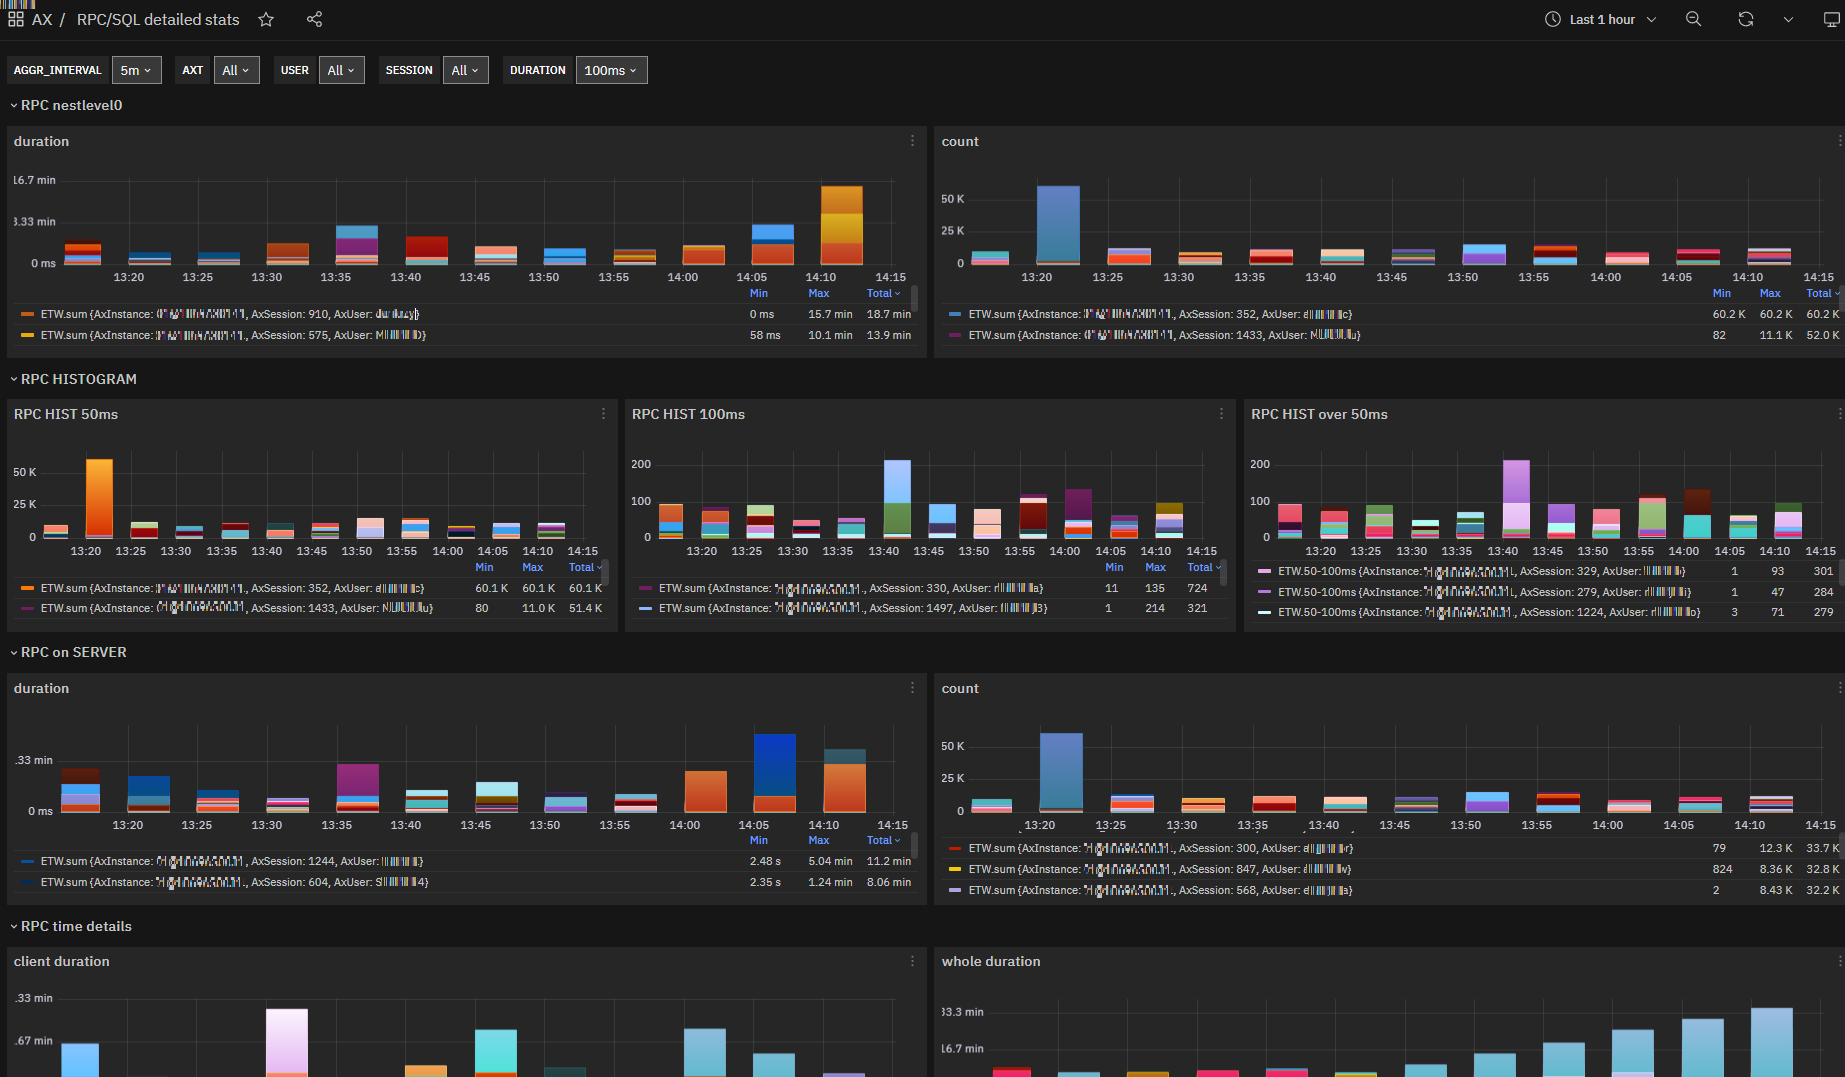
Fig. 164 RPC/SQL detailed stats: Rpc calls durations and counts charts by instance, user and session
See also
Please check Microsoft Dynamics AX client and .NET Business Connector for more information.
SQL business database metrics
Crucial element of the performances in AX are the database queries: we can visualize the number and duration of queries as well as appreciate their distribution with the histogram data.

Fig. 165 RPC/SQL general stats: SQL business database queries durations and counts charts by instance and user
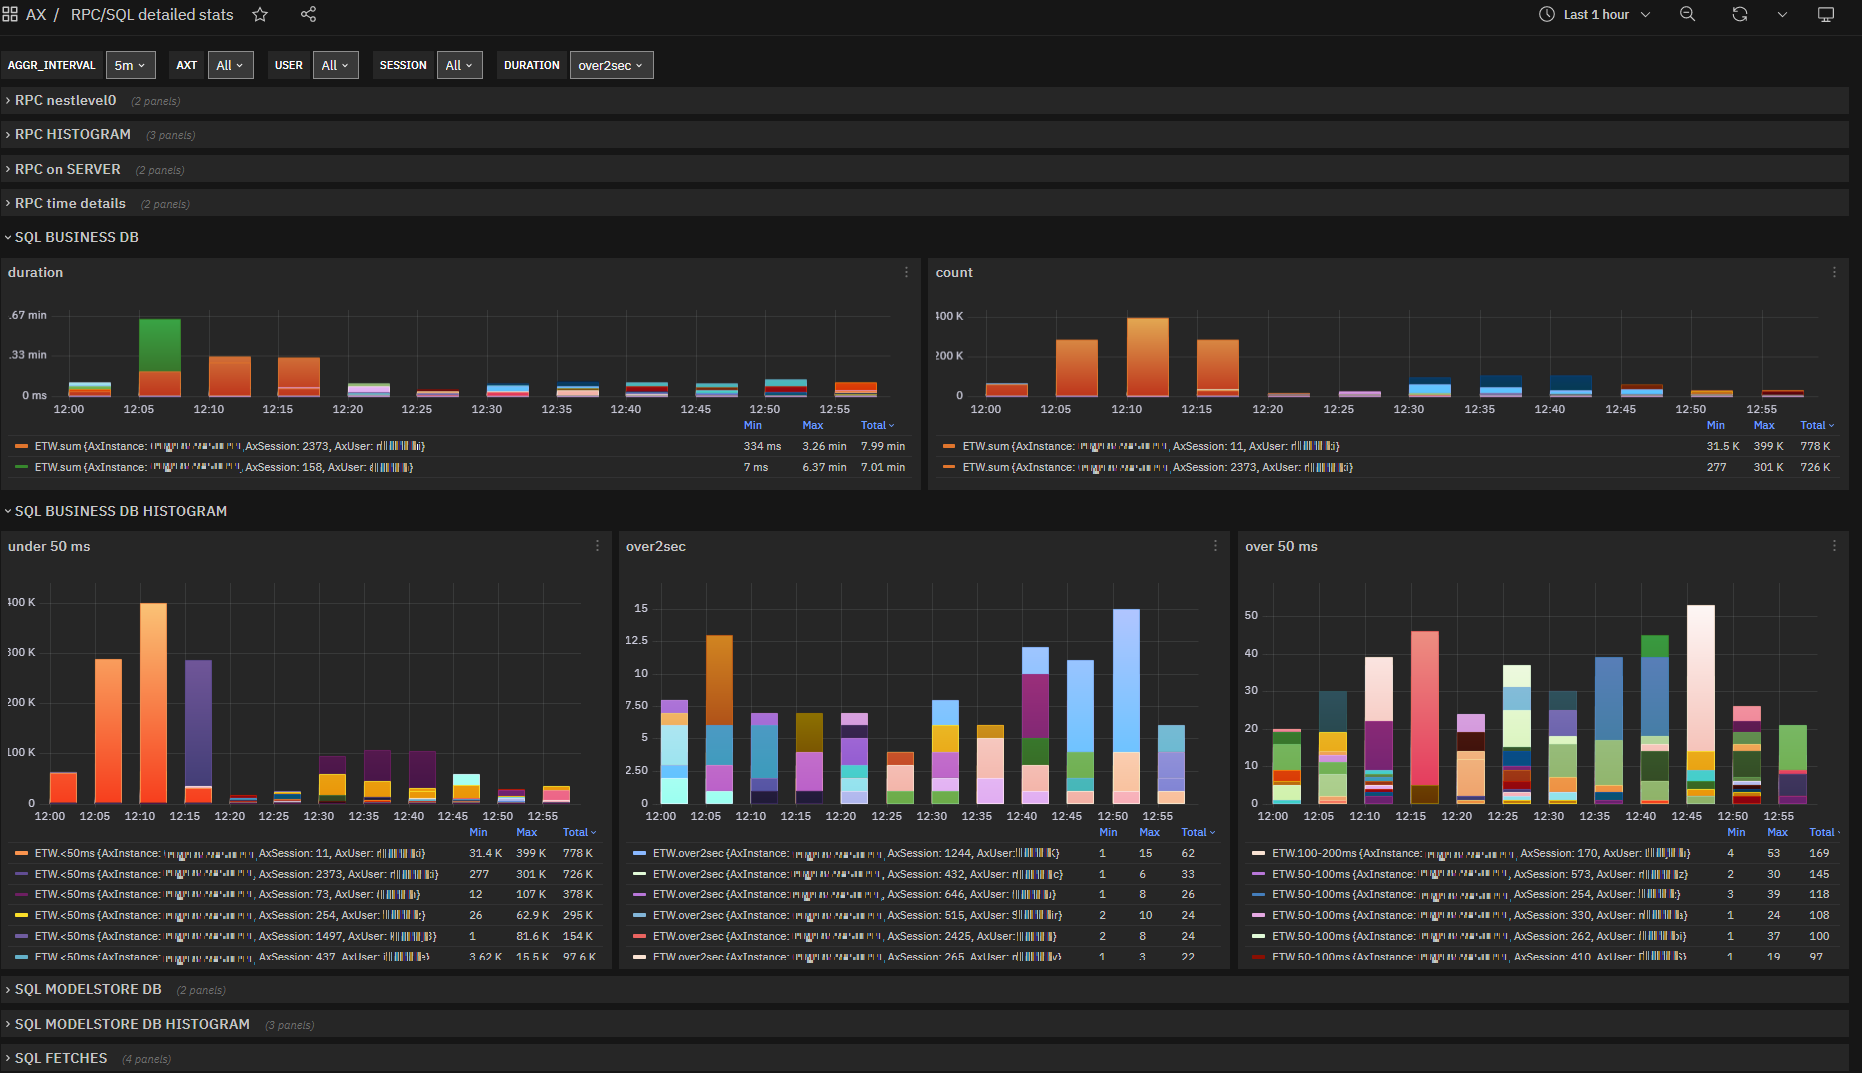
Fig. 166 RPC/SQL detailed stats: SQL business database queries durations and counts charts by instance, user and session
See also
Please check Microsoft Dynamics AX Database for more information.
SQL modelstore database metrics
Calls to the modelstore database are definitely lower than the others, but we manage to isolate them by highlighting critical phenomena during components’ starts and maintenance/deployment operations.
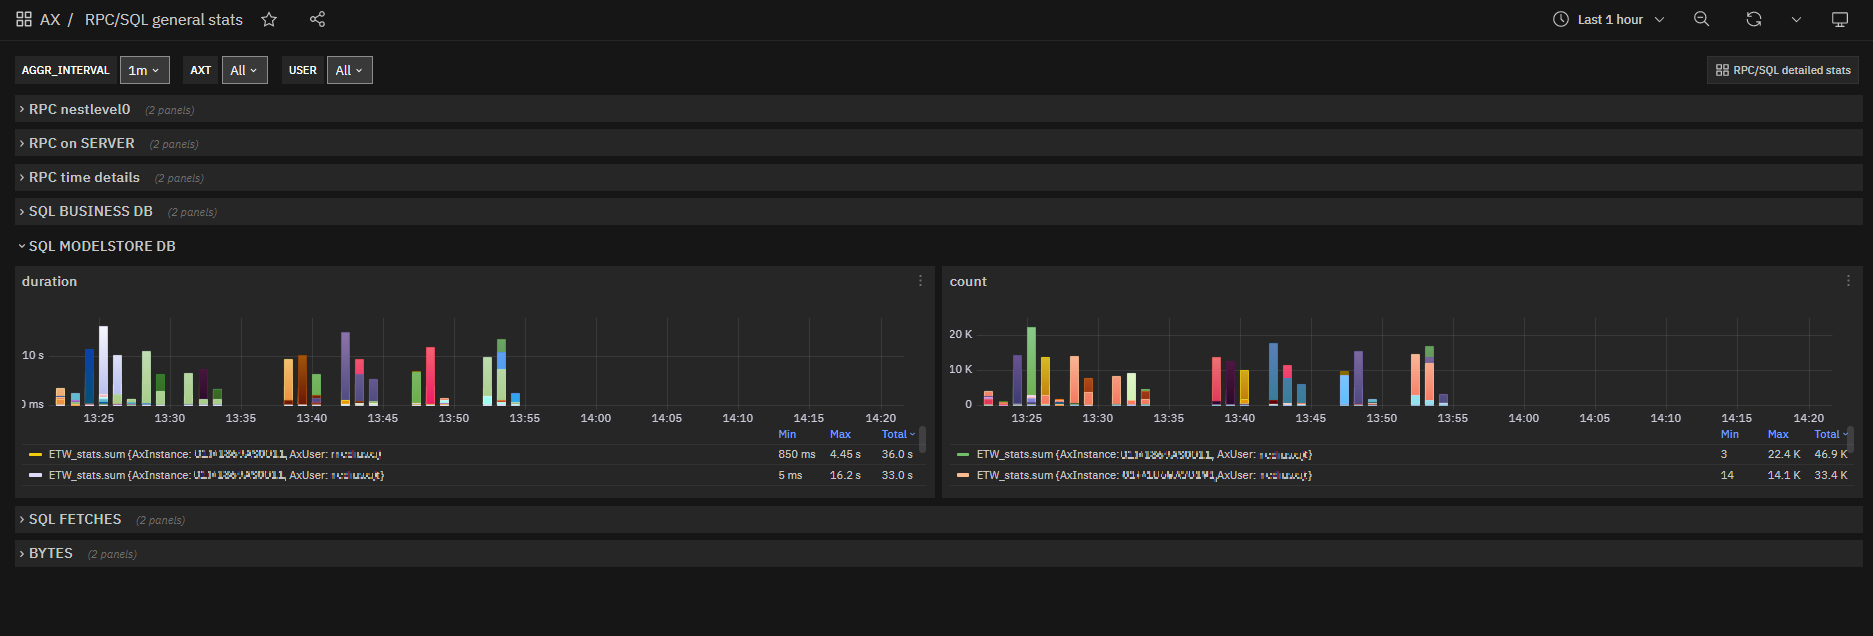
Fig. 167 RPC/SQL general stats: SQL modelstore database queries durations and counts charts by instance and user
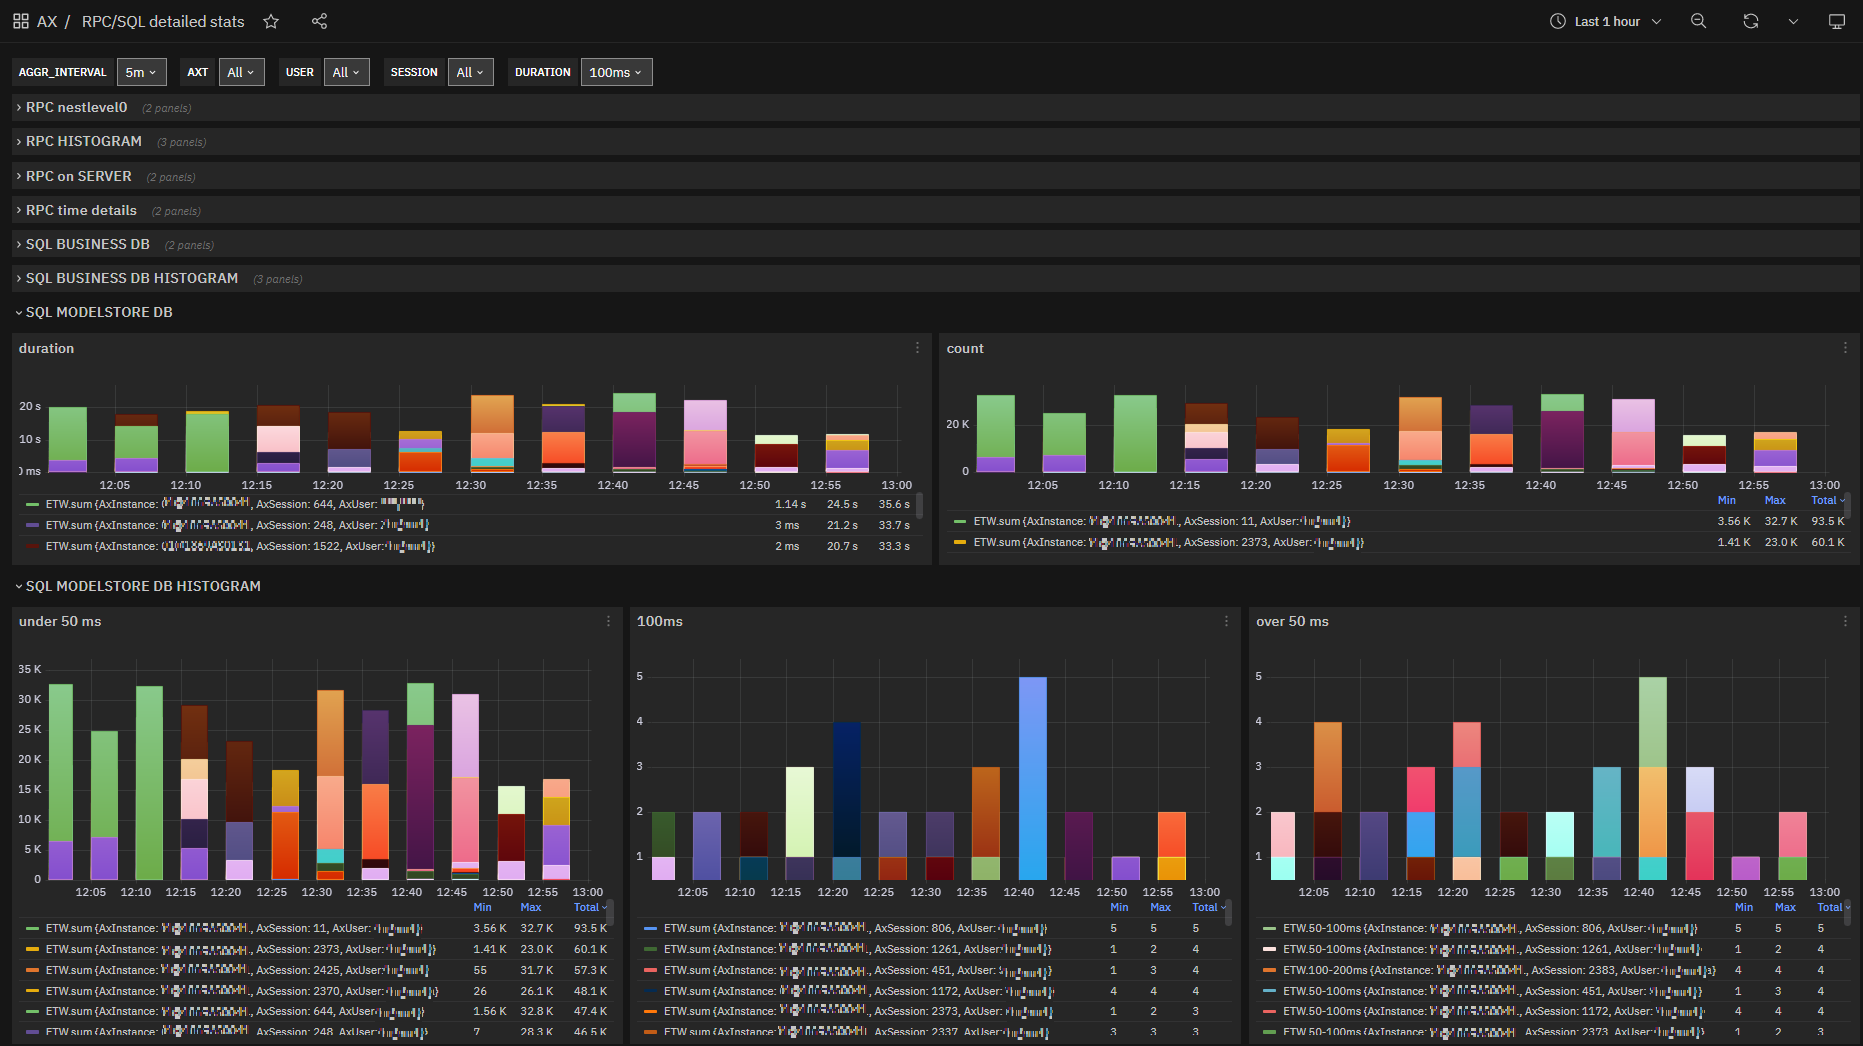
Fig. 168 RPC/SQL detailed stats: SQL modelstore database queries durations and counts charts by instance, user and session
See also
Please check Model store architecture for more information.
SQL data fetches metrics
Again with regard to the database component, it is interesting to be able to view the number and duration of data fetches. As with the other metrics, histograms are used to visualize the data.
Data fetched are measured both in number of fetch events and number of lines: this has proved to be a useful feedback on AOSservice tuning.
The metric cumulative duration deserves a special mention: it must be interpreted as the cumulative duration of all cursors opened by a query.

Fig. 169 RPC/SQL general stats: SQL fetches durations and counts charts by instance and user
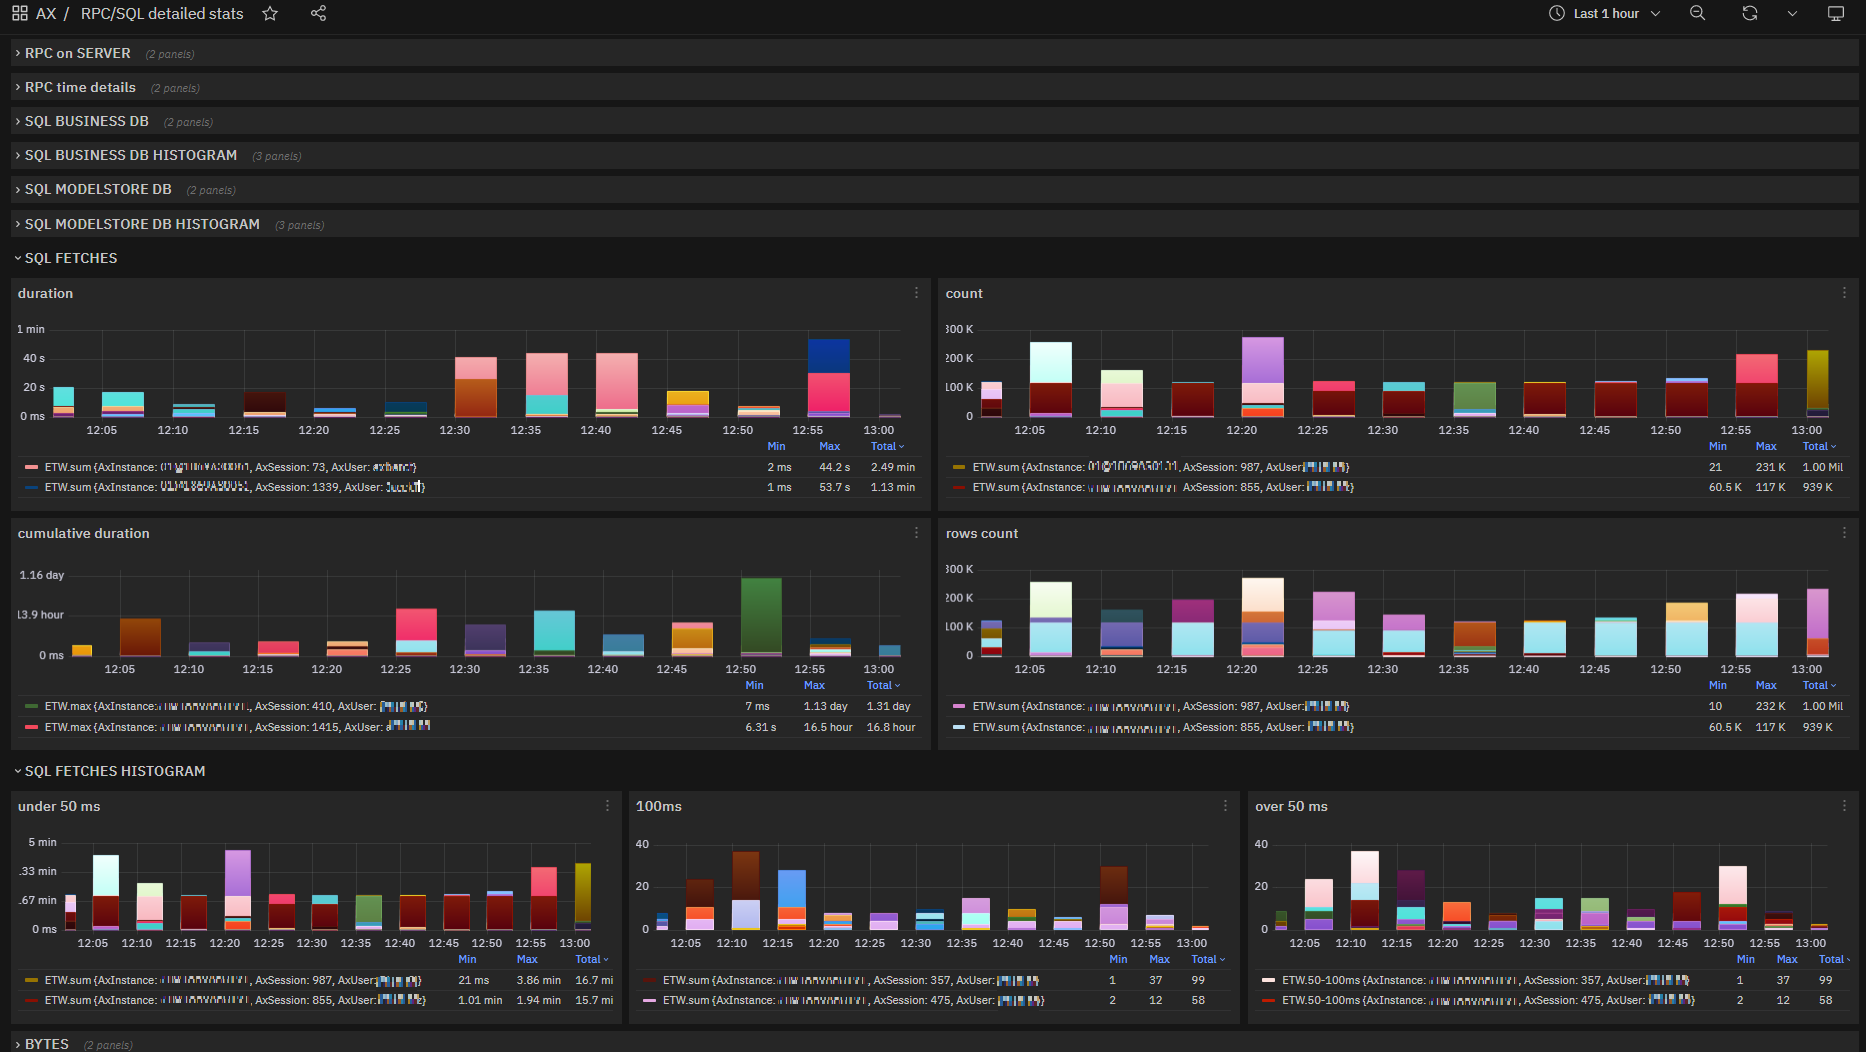
Fig. 170 RPC/SQL detailed stats: SQL fetches durations and counts charts by instance, user and session
Bytes sent/received metrics
As final information we have the data sent by the aos service to the AX clients and those received, peaks in these metrics signal anomalies and bottlenecks.
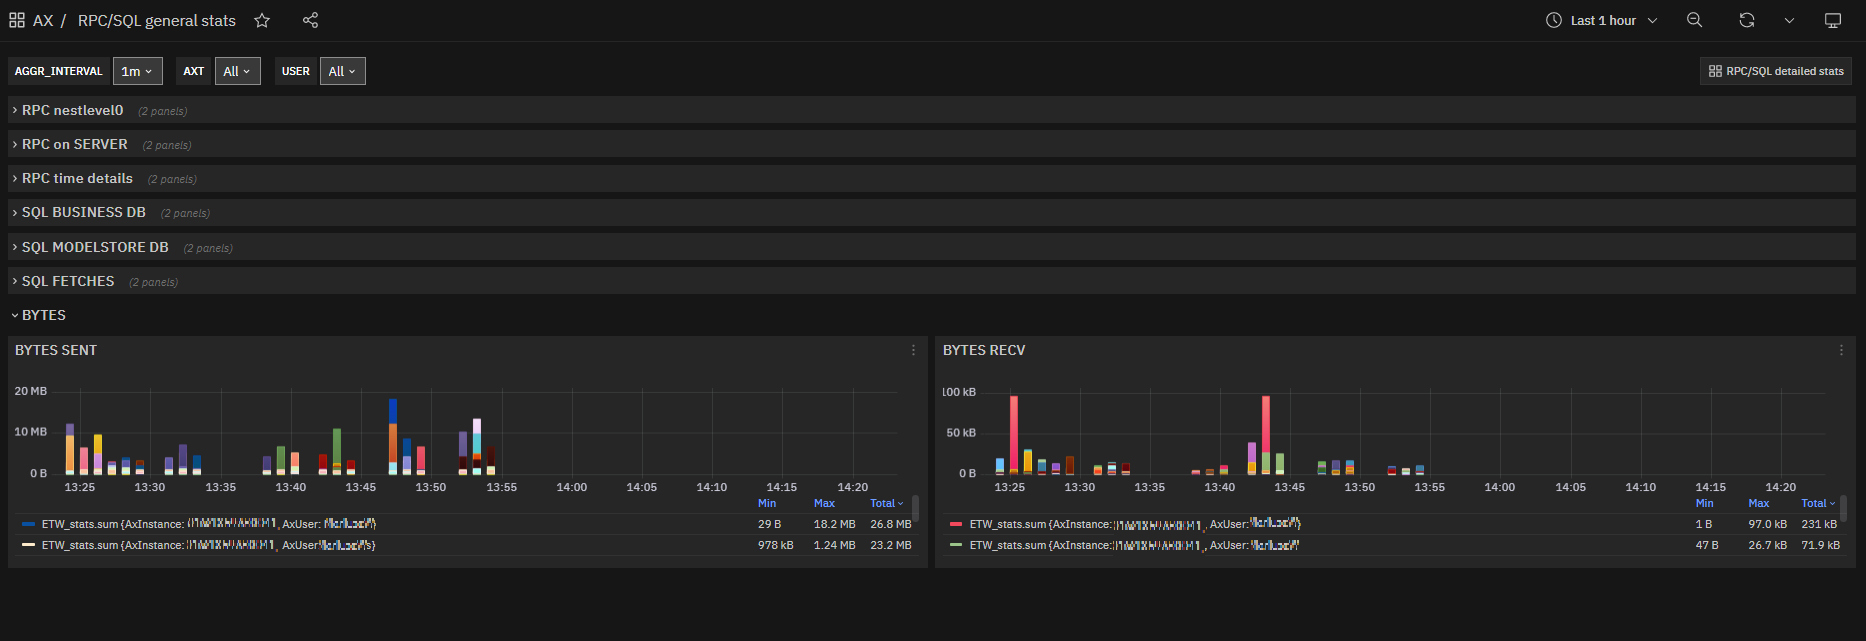
Fig. 171 RPC/SQL general stats: Bytes sent/received charts by instance and user
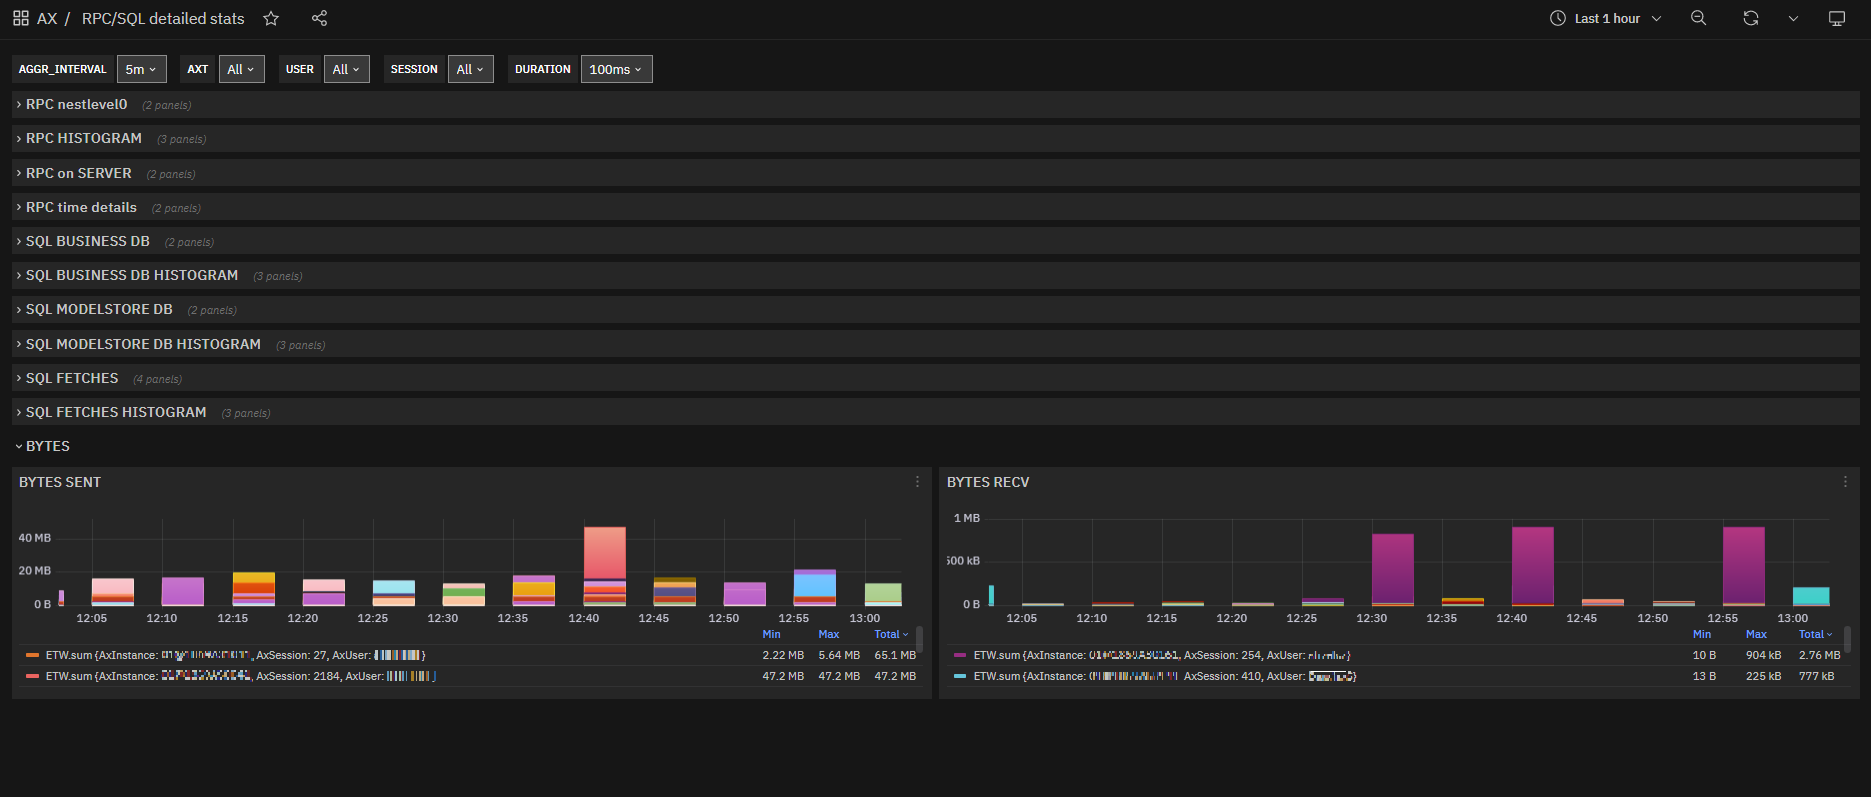
Fig. 172 RPC/SQL detailed stats: Bytes sent/received charts by instance, user and session
Monitoring of Microsoft Dynamics AX client
The main purpose in monitoring AX clients active on a terminal server is to understand the users’ working area: the AXTrace metric for AX client allows you to monitor the used Controls and opened/closed forms.
We avoided building a duplicate of AOS metrics with the duration of RPC calls: the metrics registered on AOSService already give an exact and complete description/measure of the whole process.
This visibility detail is typically of interest during post-incident analysis and therefore a detail was kept at the event-level.
It is possible to trace back when a user has had problems of responsiveness, identifying the form where he encountered the problem and the exact moment.
Exposed metrics
The example shows some CLIENT_EVENTS2 metric, the Microsoft Dynamics AX client’s metric exposed by AXTrace.
CLIENT_EVENTS2,AxUser=axuser1,Control=SysUserLog FormOpen=1i,FormClose=0i,ControlClicked=0i,AxComputer="AXTermSrv09",AxServer="AXAOSSrv04",AxSession=31i 1655482050123074100
CLIENT_EVENTS2,AxUser=axuser2,Control=SysUsersOnline FormOpen=1i,FormClose=0i,ControlClicked=0i,AxComputer="AXTermSrv09",AxServer="AXAOSSrv05",AxSession=221i 1655482050123092720
CLIENT_EVENTS2,AxUser=axuser7,Control=InventSite FormOpen=0i,FormClose=1i,ControlClicked=0i,AxComputer="AXTermSrv09",AxServer="AXAOSSrv05",AxSession=4i 1655482050123175000
CLIENT_EVENTS2,AxUser=axuser4,Control=LedgerJournal FormOpen=1i,FormClose=0i,ControlClicked=0i,AxComputer="AXTermSrv09",AxServer="AXAOSSrv04",AxSession=70i 1655482050123360100
CLIENT_EVENTS2,AxUser=axuser9,Control=Currency FormOpen=1i,FormClose=0i,ControlClicked=0i,AxComputer="AXTermSrv09",AxServer="AXAOSSrv01",AxSession=23i 1655482050123583100
Name |
Description |
|---|---|
CLIENT_EVENTS2 |
Collection of user action events, timestamp indicates the exact moment |
Name |
Description |
|---|---|
AxUser |
AX user_id of a user |
Control |
Control clicked name or form opened/closed name |
Name |
Description |
|---|---|
FormOpen |
Integer, value 1 if form was opened 0 otherwise |
FormClose |
Integer, value 1 if form was closed 0 otherwise |
ControlClicked |
Integer, value 1 if control was clicked 0 otherwise |
AxComputer |
Server hosting AX client |
AxServer |
Server hosting AOSService instance, AOSService id cannot be determined |
AxSession |
Integer, ax session_id of user session running on AOSService which is linked to monitored process of AX client |
Dashboard
The dashboard provided has following controls:
Name |
Description |
|---|---|
USER |
Filter ax user_id |
CONTROLNAME |
Filter control clicked or form opened(closed) |
AxClientHost |
Filter server hosting AX client |
AxAosHost |
Filter server hosting AOSService instances |
Name |
Description |
|---|---|
AggregationInterval |
Time interval for aggregate view in bar charts: helps increase the responsiveness of the dashboard |
Bar charts
Metric data is aggregated for Control(Form) and AxUser and shown in bar charts:
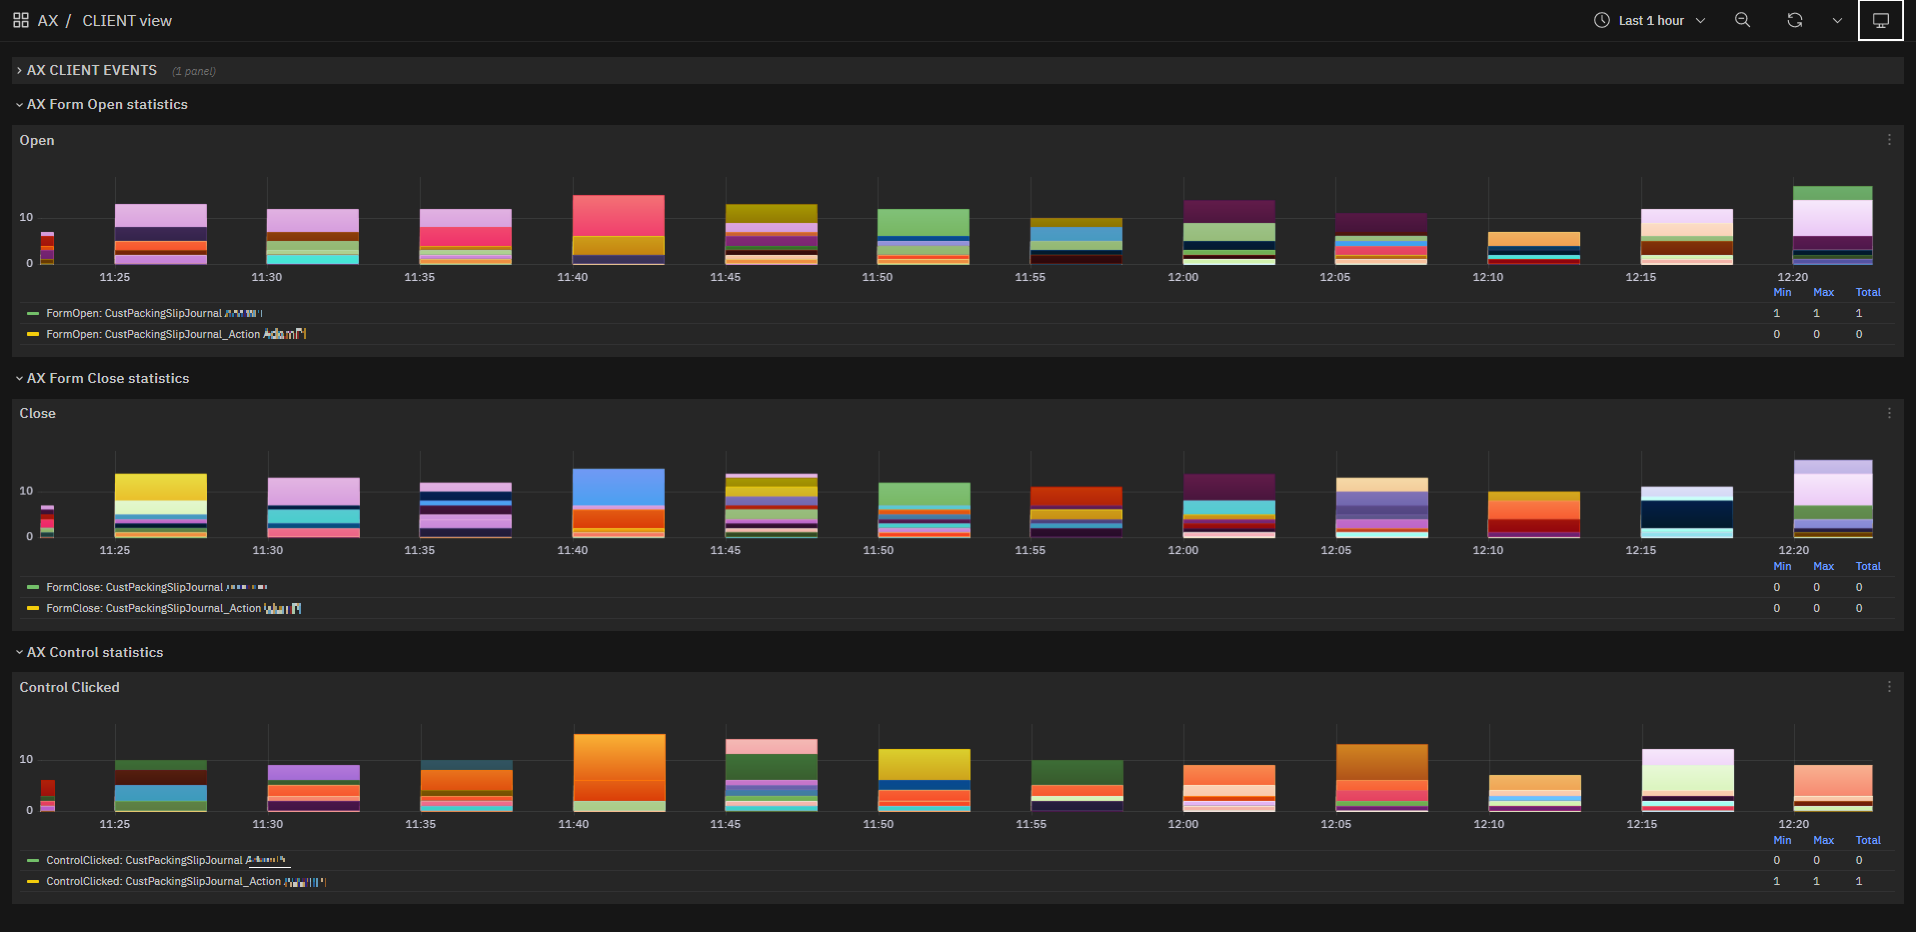
Fig. 173 CLIENT_EVENTS2 charts for FormOpen,FormClose,ControlClicked fields grouped by AxUser
The full details are shown in the table below, which has its built-in sorting and filtering options applied to the data loaded by InfluxDB:
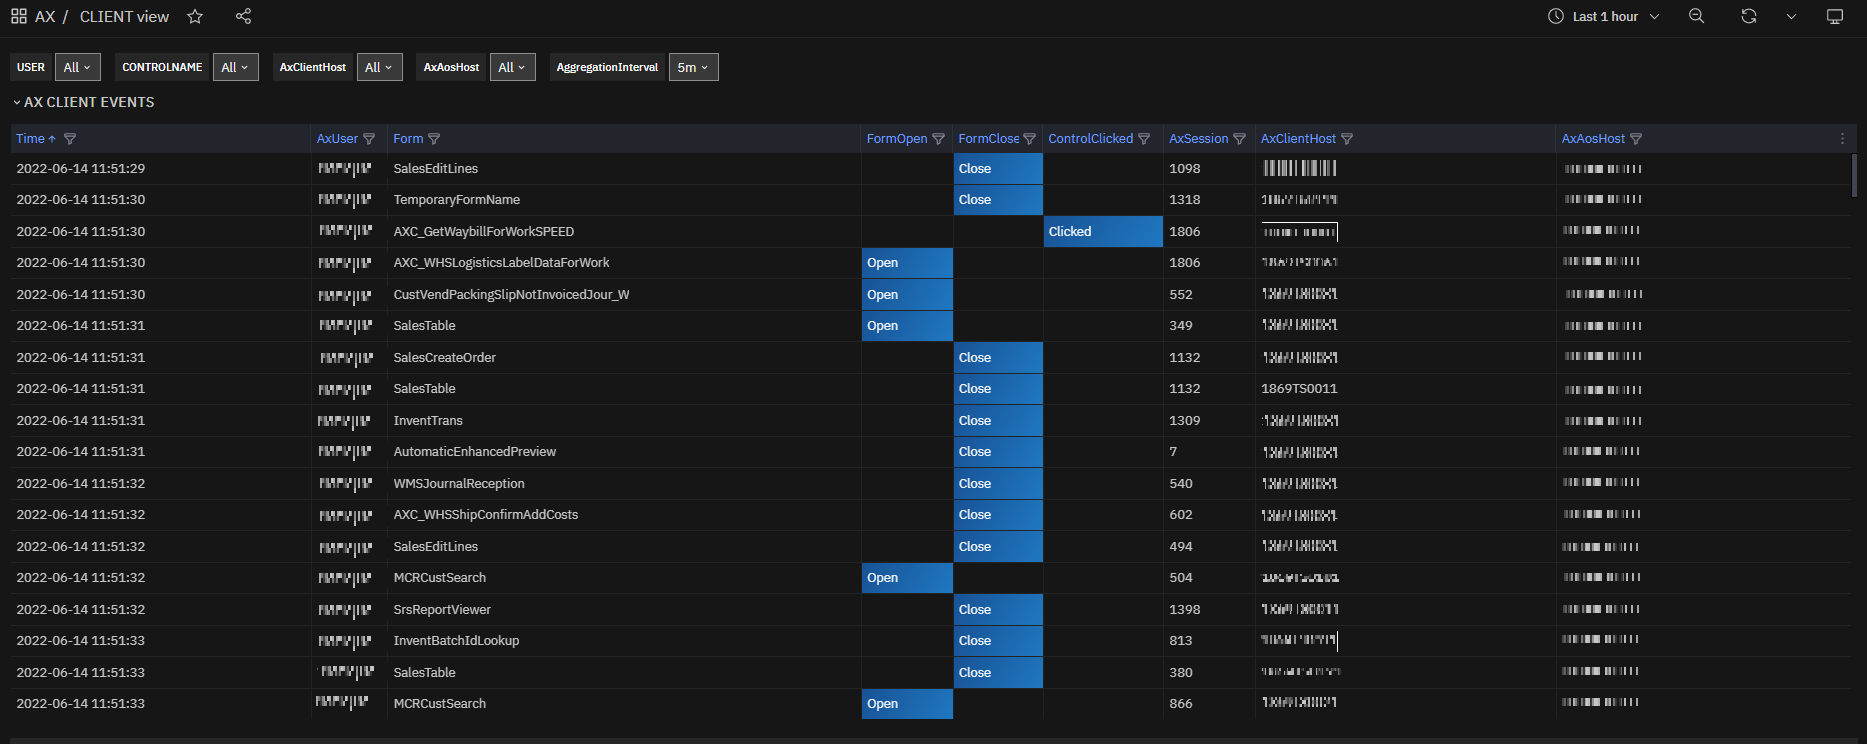
Fig. 174 CLIENT_EVENTS2 table
Diagnose issues and analyze performance with events capture
Microsoft Dynamics AX is an extremely vast and complex environment and the problems you can encounter need a deep and detailed knowledge to be solved, possibly down to the single line of code.
The metrics exposed by AXTrace are essential to narrow the field of investigation, but then it arises the inevitable need to have a more powerful tool.
Microsoft Dynamics AX developers are certainly familiar with the AX Trace Parser tool:
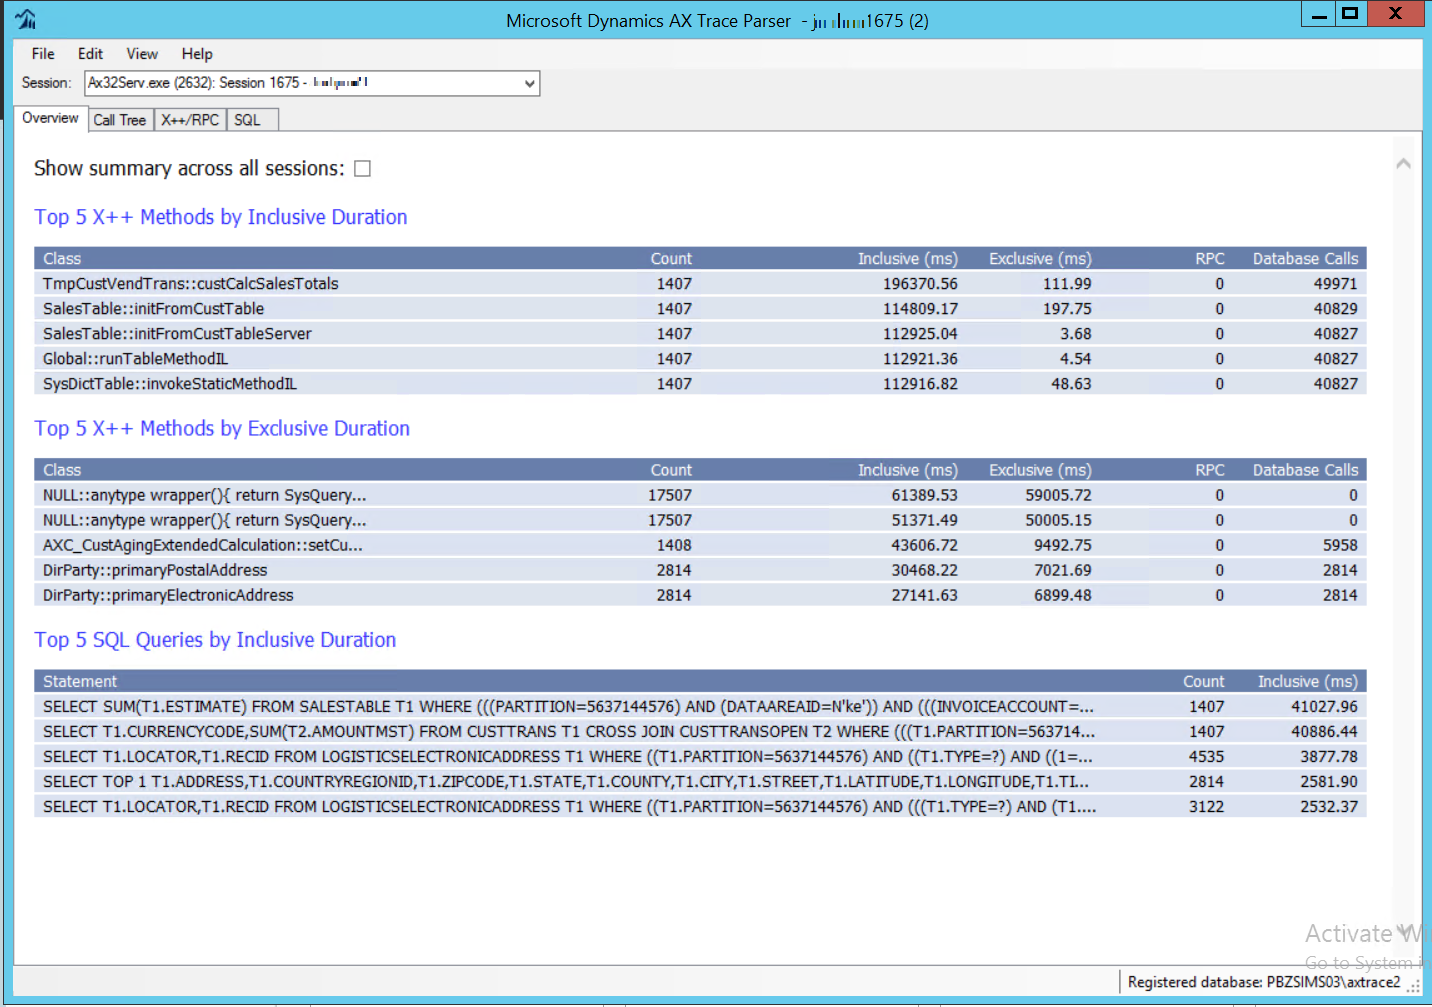
Fig. 175 AX Trace Parser Overview tab
This tool is extremely useful as it allows you to view the entire call tree and to investigate at each level based on the durations and the operations carried out with considerable ease of use and immediacy. It is possible to move from the client session to the server session and it is possible to go into the details of the code.
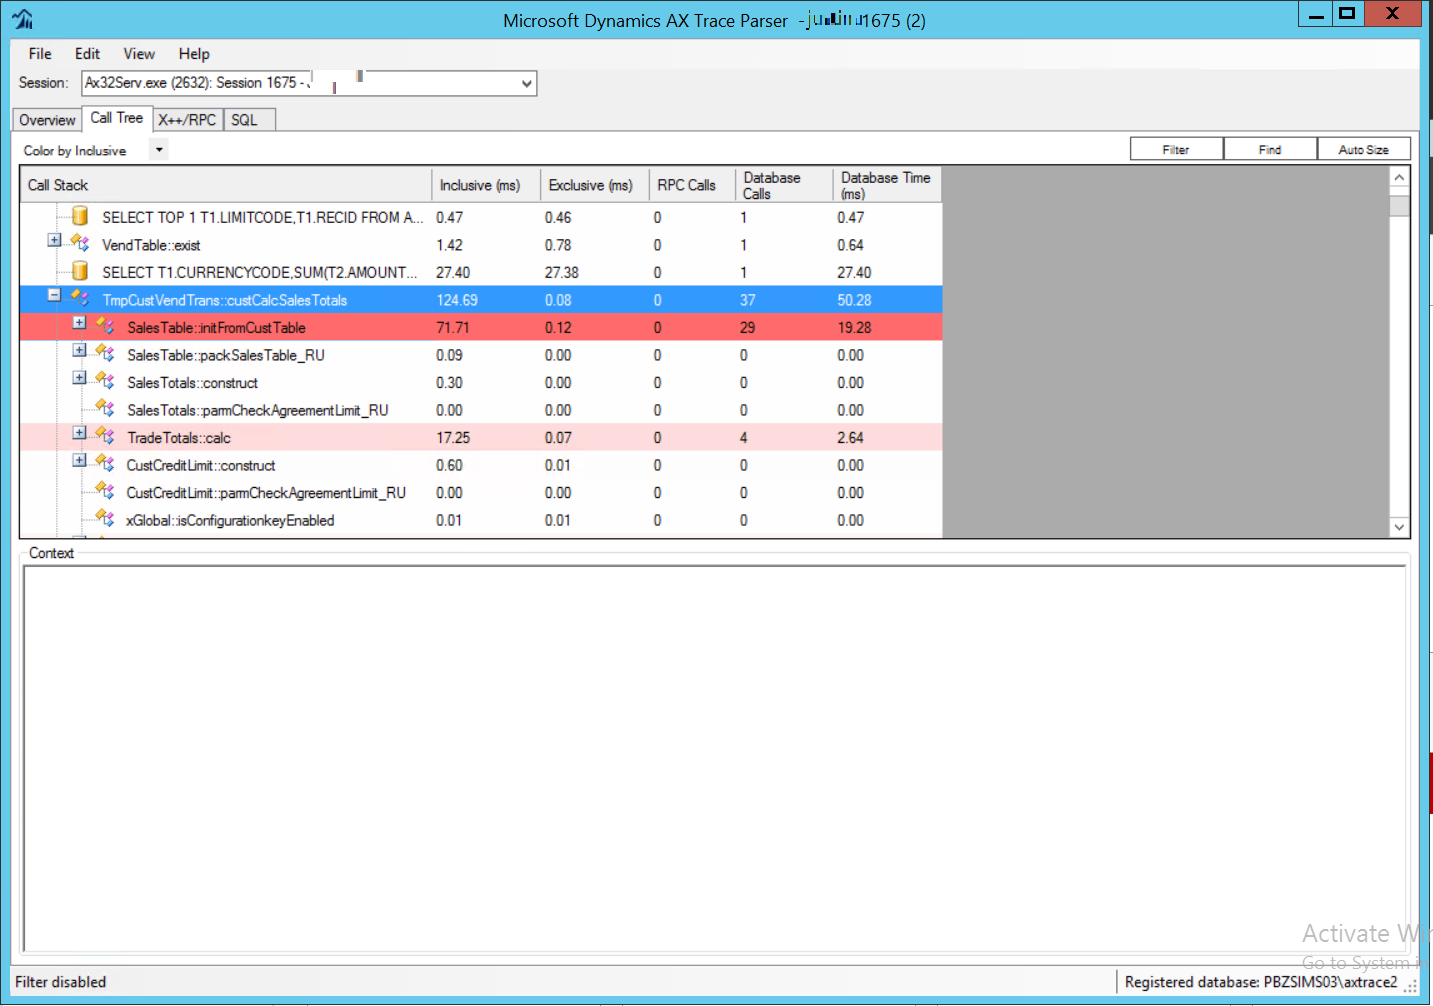
Fig. 176 AX Trace Parser Call Tree tab
The detail of the code is perhaps the strong point of this tool, which allows you to see the call to a COM component, as a try-catch that hides an exception and leads the session to abnormal behavior.
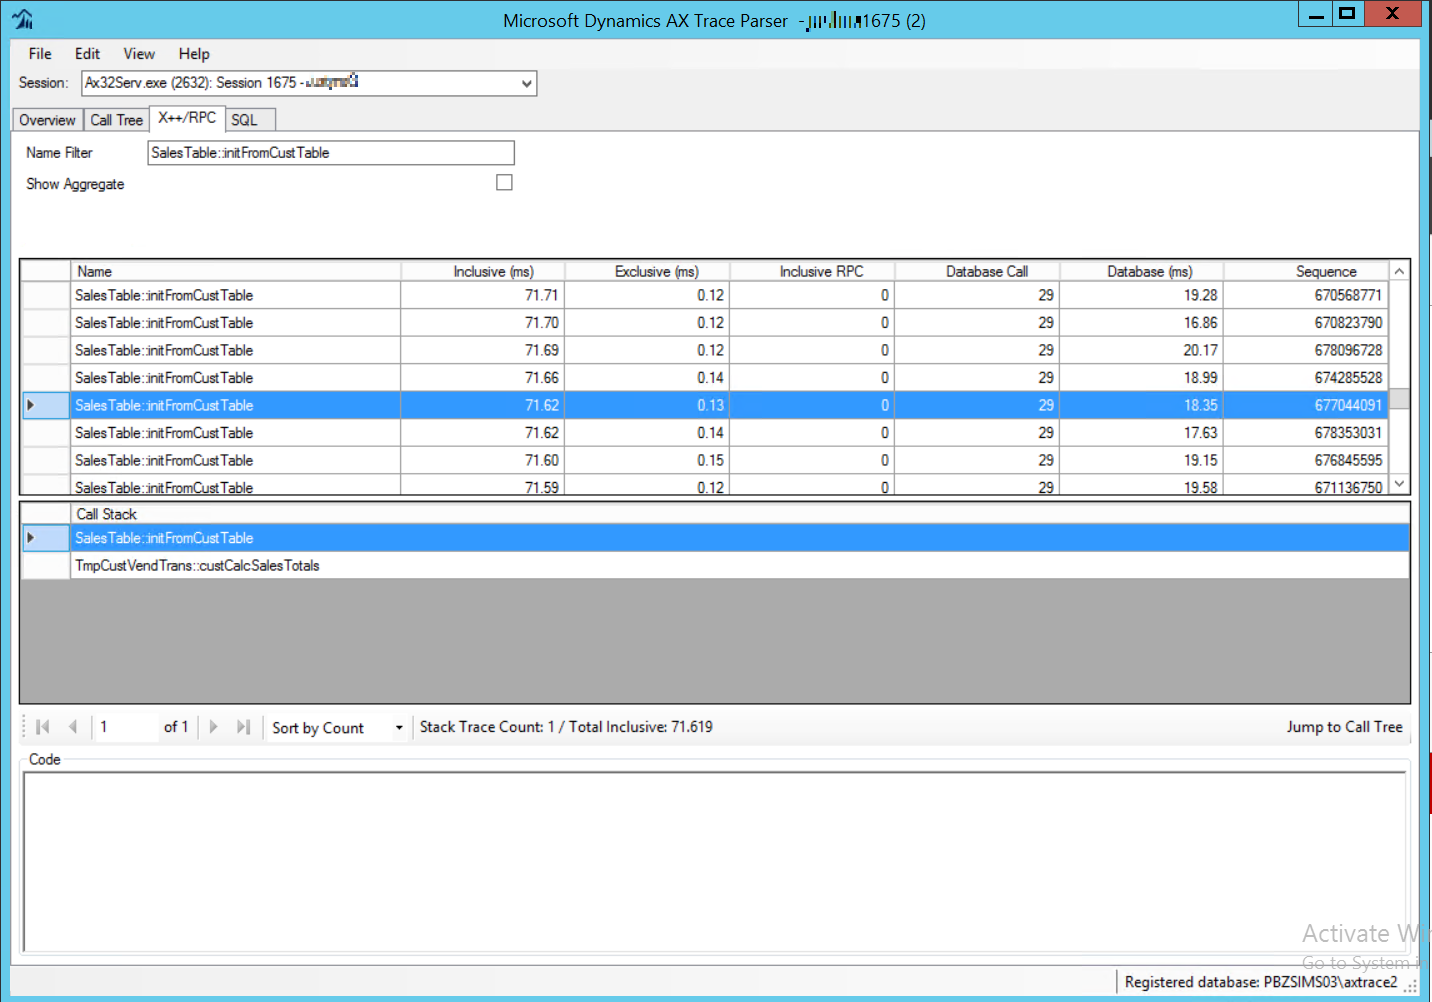
Fig. 177 AX Trace Parser X++/RPC tab
In the last tab there is the detail on SQL queries even with the parameters used for each single call.
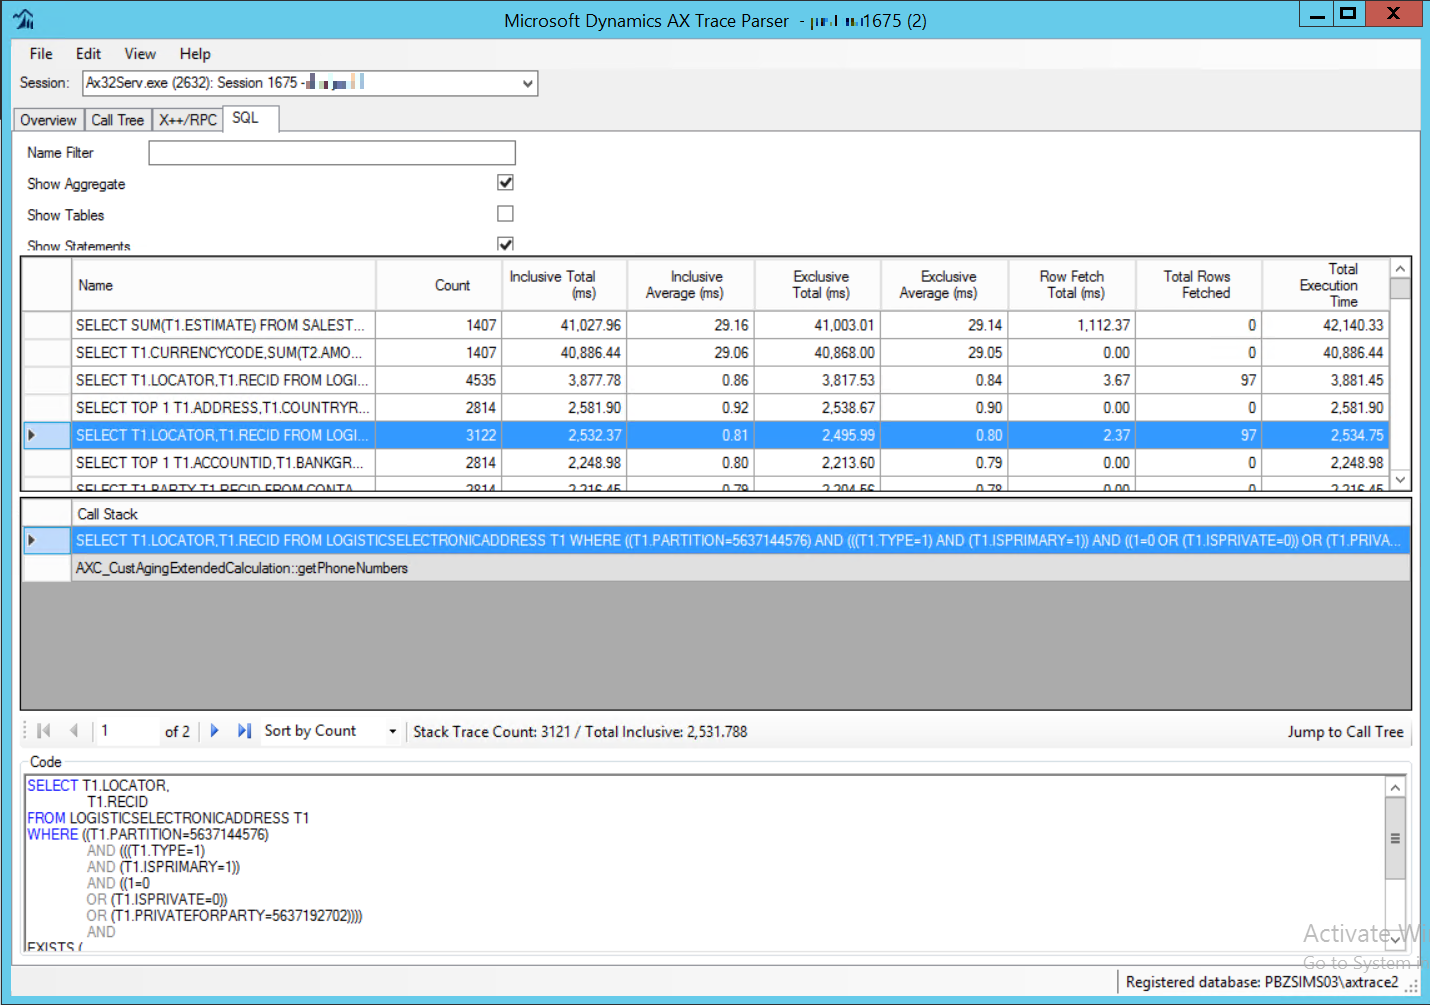
Fig. 178 AX Trace Parser SQL tab
The big limitation of this tool is that it was designed for development environments where a single user works, therefore using it in a production environment is almost impossible, given the large number of sessions open simultaneously. Even a test environment with a few dozen users is not suited for this tool.
Here AXTrace comes in, since it allows you to filter the events of the desired user or session, reducing a lot the problems of disk space and impact on performances.
The result is saved in a file that can preferably be placed on an external server and the task can be easily automated or scheduled for example with PowerShell: for example if we have to monitor a batchjob from 3 AM to 3:15 AM we can schedule the recording to start at 3 AM and stop at 3:15 AM. The next morning we can comfortably carry out the rest of the work.
The only recommendation is to not abuse the tool since in particular on servers running batch jobs, since it may significantly use the CPU.
Usage
This tool is available only from command line:
AXETWTracing -trace [-outfile <filename>] [-console] [-user] [-session] [-instance]
Administrator rights on Machine are needed.
Warning
The agents does not check disk space available!
Parameters
Parameter name |
Description |
|---|---|
trace |
Mandatory to use the agent as tracing tool. |
outfile |
Optional but recommended, default value is |
console |
Optional. If specified events xml output is shown in console. |
user <axuser1,axuser2,axuser3,..> |
Optional. If specified only events related to specified users are stored in output file. |
session <axsession1,axsession2,axsession3,..> |
Optional. If specified only events related to specified sessions are stored in output file. |
instance <aosinstance1,aosinstance2,…> |
Optional. If specified only events related to specified AOS instances are stored in output file. |
Examples
Starts a trace for all users and stores data in C:tmptracingrec_yyyyMMdd_HHmmss.etl file.
C:\tmp\tracing>"C:\Program Files\AXETWTracing\AXETWTracing.exe" -trace
Starts a trace for users myuser1 and myuser2 and stores data in C:tmptracingmyusersTrace20220614_myaos.etl file.
C:\tmp\tracing>"C:\Program Files\AXETWTracing\AXETWTracing.exe" -trace -user myuser1,myuser2 -outfile .\myusersTrace20220614_myaos.etl
Starts a trace for sessions 102 and stores data in C:tmptracingmyusersTrace20220614_myaos.etl file.
C:\tmp\tracing>"C:\Program Files\AXETWTracing\AXETWTracing.exe" -trace -session 102 -outfile .\myusersTrace20220614_myaos.etl
Starts a trace for user myuser on instance 02 and stores data in C:tmptracingrec_yyyyMMdd_HHmmss.etl file.
C:\tmp\tracing>"C:\Program Files\AXETWTracing\AXETWTracing.exe" -trace -user myuser -instance 02
Configuration on NetEye
The AXTrace module extends the ITOA module and shares the structure with it for users, data sources and dashboards.
Variable Name |
Description |
|---|---|
<DATABASE> |
InfluxDB database where data must be written |
<ETWRETENTIONPOLICY> |
InfluxDB retention policy used for ETW metric |
<ETWEXTRETENTIONPOLICY> |
InfluxDB retention policy used for ETW_stats metric |
InfluxDB Retention Policies for AXTrace
This paragraph integrates the relative section for the Telegraf agent.
The ETW metric has a high cardinality , this problem is limited by choosing a retention_policy with appropriate duration: our advice is to create a 2-week retention policy.
CREATE RETENTION POLICY "<ETWRETENTIONPOLICY>" ON "<DATABASE>" DURATION 2w REPLICATION 1 shard duration 24h
The ETW_stats metric has a medium cardinality, so for this metric our advice is to create a 6-month retention policy.
CREATE RETENTION POLICY "<ETWEXTRETENTIONPOLICY>" ON "<DATABASE>" DURATION 26w REPLICATION 1 shard duration 168h
InfluxDB Continuous Query for ETW_stats
The metric ETW_stats is not generated by AXTrace but it is a downsampling of the ETW metric itself. Downsampling is achieved with the following Continuous Query:
CREATE CONTINUOUS QUERY ETWreduce ON "<DATABASE>" RESAMPLE EVERY 10m FOR 15m BEGIN SELECT sum(RPC_server_duration) AS RPC_server_duration_sum, min(RPC_server_duration) AS RPC_server_duration_min, max(RPC_server_duration) AS RPC_server_duration_max, sum(RPC_nestlevel0_duration) AS RPC_nestlevel0_duration_sum, min(RPC_nestlevel0_duration) AS RPC_nestlevel0_duration_min, max(RPC_nestlevel0_duration) AS RPC_nestlevel0_duration_max, sum(FETCH_fetchcumu_count) AS FETCH_fetchcumu_count_sum, min(FETCH_fetchcumu_count) AS FETCH_fetchcumu_count_min, max(FETCH_fetchcumu_count) AS FETCH_fetchcumu_count_max, sum(SQL_stmt_preparation_duration) AS SQL_stmt_preparation_duration_sum, min(SQL_stmt_preparation_duration) AS SQL_stmt_preparation_duration_min, max(SQL_stmt_preparation_duration) AS SQL_stmt_preparation_duration_max, sum(RPC_bytes_sent) AS RPC_bytes_sent_sum, min(RPC_bytes_sent) AS RPC_bytes_sent_min, max(RPC_bytes_sent) AS RPC_bytes_sent_max, max(RPC_whole_duration) AS RPC_whole_duration_max, count(RPC_whole_duration) AS RPC_whole_duration_count, sum(FETCH_rows_count) AS FETCH_rows_count_sum, min(FETCH_rows_count) AS FETCH_rows_count_min, max(FETCH_rows_count) AS FETCH_rows_count_max, max(RPC_max_nest_level) AS RPC_max_nest_level_max, count(RPC_max_nest_level) AS RPC_max_nest_level_count, sum(SQL_stmt_duration) AS SQL_stmt_duration_sum, min(SQL_stmt_duration) AS SQL_stmt_duration_min, max(SQL_stmt_duration) AS SQL_stmt_duration_max, sum(FETCH_duration) AS FETCH_duration_sum, min(FETCH_duration) AS FETCH_duration_min, max(FETCH_duration) AS FETCH_duration_max, sum(SQL_stmt_count) AS SQL_stmt_count_sum, min(SQL_stmt_count) AS SQL_stmt_count_min, max(SQL_stmt_count) AS SQL_stmt_count_max, sum(RPC_nestlevel0_count) AS RPC_nestlevel0_count_sum, min(RPC_nestlevel0_count) AS RPC_nestlevel0_count_min, max(RPC_nestlevel0_count) AS RPC_nestlevel0_count_max, sum(SQL_modelstoredproc_count) AS SQL_modelstoredproc_count_sum, min(SQL_modelstoredproc_count) AS SQL_modelstoredproc_count_min, max(SQL_modelstoredproc_count) AS SQL_modelstoredproc_count_max, sum(RPC_client_duration) AS RPC_client_duration_sum, min(RPC_client_duration) AS RPC_client_duration_min, max(RPC_client_duration) AS RPC_client_duration_max, sum(RPC_all_count) AS RPC_all_count_sum, min(RPC_all_count) AS RPC_all_count_min, max(RPC_all_count) AS RPC_all_count_max, sum(SQL_modelstoredproc_preparation_duration) AS SQL_modelstoredproc_preparation_duration_sum, min(SQL_modelstoredproc_preparation_duration) AS SQL_modelstoredproc_preparation_duration_min, max(SQL_modelstoredproc_preparation_duration) AS SQL_modelstoredproc_preparation_duration_max, sum(FETCH_fetches_count) AS FETCH_fetches_count_sum, min(FETCH_fetches_count) AS FETCH_fetches_count_min, max(FETCH_fetches_count) AS FETCH_fetches_count_max, sum(FETCH_cumu_duration) AS FETCH_cumu_duration_sum, min(FETCH_cumu_duration) AS FETCH_cumu_duration_min, max(FETCH_cumu_duration) AS FETCH_cumu_duration_max, sum(RPC_bytes_recd) AS RPC_bytes_recd_sum, min(RPC_bytes_recd) AS RPC_bytes_recd_min, max(RPC_bytes_recd) AS RPC_bytes_recd_max, sum(SQL_modelstoredproc_duration) AS SQL_modelstoredproc_duration_sum, min(SQL_modelstoredproc_duration) AS SQL_modelstoredproc_duration_min, max(SQL_modelstoredproc_duration) AS SQL_modelstoredproc_duration_max, sum(SQL_Stmt_50ms) AS SQL_Stmt_50ms_sum, min(SQL_Stmt_50ms) AS SQL_Stmt_50ms_min, max(SQL_Stmt_50ms) AS SQL_Stmt_50ms_max, sum(SQL_ModelStored_200ms) AS SQL_ModelStored_200ms_sum, min(SQL_ModelStored_200ms) AS SQL_ModelStored_200ms_min, max(SQL_ModelStored_200ms) AS SQL_ModelStored_200ms_max, sum(RPC_100ms) AS RPC_100ms_sum, min(RPC_100ms) AS RPC_100ms_min, max(RPC_100ms) AS RPC_100ms_max, sum(SQL_ModelStored_50ms) AS SQL_ModelStored_50ms_sum, min(SQL_ModelStored_50ms) AS SQL_ModelStored_50ms_min, max(SQL_ModelStored_50ms) AS SQL_ModelStored_50ms_max, sum(FETCH_50ms) AS FETCH_50ms_sum, min(FETCH_50ms) AS FETCH_50ms_min, max(FETCH_50ms) AS FETCH_50ms_max, sum(RPC_200ms) AS RPC_200ms_sum, min(RPC_200ms) AS RPC_200ms_min, max(RPC_200ms) AS RPC_200ms_max, sum(SQL_Stmt_500ms) AS SQL_Stmt_500ms_sum, min(SQL_Stmt_500ms) AS SQL_Stmt_500ms_min, max(SQL_Stmt_500ms) AS SQL_Stmt_500ms_max, sum(SQL_ModelStored_over2sec) AS SQL_ModelStored_over2sec_sum, min(SQL_ModelStored_over2sec) AS SQL_ModelStored_over2sec_min, max(SQL_ModelStored_over2sec) AS SQL_ModelStored_over2sec_max, sum(RPC_over10sec) AS RPC_over10sec_sum, min(RPC_over10sec) AS RPC_over10sec_min, max(RPC_over10sec) AS RPC_over10sec_max, sum(SQL_ModelStored_500ms) AS SQL_ModelStored_500ms_sum, min(SQL_ModelStored_500ms) AS SQL_ModelStored_500ms_min, max(SQL_ModelStored_500ms) AS SQL_ModelStored_500ms_max, sum(SQL_Stmt_100ms) AS SQL_Stmt_100ms_sum, min(SQL_Stmt_100ms) AS SQL_Stmt_100ms_min, max(SQL_Stmt_100ms) AS SQL_Stmt_100ms_max, sum(SQL_Stmt_2sec) AS SQL_Stmt_2sec_sum, min(SQL_Stmt_2sec) AS SQL_Stmt_2sec_min, max(SQL_Stmt_2sec) AS SQL_Stmt_2sec_max, sum(RPC_2sec) AS RPC_2sec_sum, min(RPC_2sec) AS RPC_2sec_min, max(RPC_2sec) AS RPC_2sec_max, sum(SQL_ModelStored_2sec) AS SQL_ModelStored_2sec_sum, min(SQL_ModelStored_2sec) AS SQL_ModelStored_2sec_min, max(SQL_ModelStored_2sec) AS SQL_ModelStored_2sec_max, sum(FETCH_1sec) AS FETCH_1sec_sum, min(FETCH_1sec) AS FETCH_1sec_min, max(FETCH_1sec) AS FETCH_1sec_max, sum(FETCH_over2sec) AS FETCH_over2sec_sum, min(FETCH_over2sec) AS FETCH_over2sec_min, max(FETCH_over2sec) AS FETCH_over2sec_max, sum(RPC_50ms) AS RPC_50ms_sum, min(RPC_50ms) AS RPC_50ms_min, max(RPC_50ms) AS RPC_50ms_max, sum(SQL_ModelStored_100ms) AS SQL_ModelStored_100ms_sum, min(SQL_ModelStored_100ms) AS SQL_ModelStored_100ms_min, max(SQL_ModelStored_100ms) AS SQL_ModelStored_100ms_max, sum(FETCH_2sec) AS FETCH_2sec_sum, min(FETCH_2sec) AS FETCH_2sec_min, max(FETCH_2sec) AS FETCH_2sec_max, sum(SQL_Stmt_over2sec) AS SQL_Stmt_over2sec_sum, min(SQL_Stmt_over2sec) AS SQL_Stmt_over2sec_min, max(SQL_Stmt_over2sec) AS SQL_Stmt_over2sec_max, sum(RPC_1sec) AS RPC_1sec_sum, min(RPC_1sec) AS RPC_1sec_min, max(RPC_1sec) AS RPC_1sec_max, sum(FETCH_100ms) AS FETCH_100ms_sum, min(FETCH_100ms) AS FETCH_100ms_min, max(FETCH_100ms) AS FETCH_100ms_max, sum(FETCH_500ms) AS FETCH_500ms_sum, min(FETCH_500ms) AS FETCH_500ms_min, max(FETCH_500ms) AS FETCH_500ms_max, sum(RPC_500ms) AS RPC_500ms_sum, min(RPC_500ms) AS RPC_500ms_min, max(RPC_500ms) AS RPC_500ms_max, sum(SQL_Stmt_200ms) AS SQL_Stmt_200ms_sum, min(SQL_Stmt_200ms) AS SQL_Stmt_200ms_min, max(SQL_Stmt_200ms) AS SQL_Stmt_200ms_max, sum(FETCH_200ms) AS FETCH_200ms_sum, min(FETCH_200ms) AS FETCH_200ms_min, max(FETCH_200ms) AS FETCH_200ms_max, sum(SQL_Stmt_1sec) AS SQL_Stmt_1sec_sum, min(SQL_Stmt_1sec) AS SQL_Stmt_1sec_min, max(SQL_Stmt_1sec) AS SQL_Stmt_1sec_max, sum(SQL_ModelStored_1sec) AS SQL_ModelStored_1sec_sum, min(SQL_ModelStored_1sec) AS SQL_ModelStored_1sec_min, max(SQL_ModelStored_1sec) AS SQL_ModelStored_1sec_max INTO "<DATABASE>".<ETWEXTRETENTIONPOLICY>.ETW_stats FROM "<DATABASE>".<ETWRETENTIONPOLICY>.ETW GROUP BY time(1m), AxInstance, AxUser, host END
Write Data to InfluxDB
This paragraph integrates the relative section for the Telegraf agent configuration.
Let’s create two copies of the [[outputs.influxdb]] section, the first one will write data into default retention policy and the second one into the new <ETWRETENTIONPOLICY> retention policy.
The first section configures how Telegraf writes to the default InfluxDB retention policy, then we add the namedrop option to prevent ETW metric to be written in default retention policy:
[[outputs.influxdb]]
namedrop = ["ETW"]
urls = ["https://influxdb.neteyelocal:8086"]
The second section defines how Telegraf writes to the <ETWRETENTIONPOLICY> retention policy, then we add the namepass option to force only the ETW metric to be written in this retention policy:
[[outputs.influxdb]]
namepass = ["ETW"]
urls = ["https://influxdb.neteyelocal:8086"]

retention_policy = "<ETWRETENTIONPOLICY>"
Configuration of AXTrace
Windows Administrator installing the service must provide a configuration file in toml format syntax. The name of configuration file must be axetw.conf.
The AXTrace agent sends its metrics to NetEye exactly like a Telegraf agent installed on a Windows server, which means that in section [ax2012.output.nats] are used same address, subject and tls certificates are the same used in *[[outputs.nats]]* section of Telegraf configuration file.
Variable Name |
Description |
|---|---|
<NATSADDRESS> |
NATS io endpoint, example nats://neteye-sat1.lan.local:4222 |
<NATSSUBJECT> |
NATS subject to identify the publisher/producer of data, on NetEye it is the same used for Telegraf agent: telegraf.metrics |
<CA_PATH> |
Path to valid CA, example C:/AXTrace/certs/neteye-sat1-root-ca.crt |
<CERT_PATH> |
Path to certificate, example C:/AXTrace/certs/telegrafmetrics-neteye-sat1.crt.pem |
<PRIVATEKEY_PATH> |
Path to private key, example C:/AXTrace/certs/private/telegrafmetrics-neteye-sat1.key.pem |
#[agent]
#time interval in minutes, used to syncronize the agent clock with OS clock, default is 60 minutes
#synchroIntervalLength = 60
#
[ax2012]
## AX ETW Agent collect data regarding  AX 2012 AOS RPC and SQL calls.
# Required: NO
# default value: true
#
# axaos = true
## used together with axoas parameter (set to true). This is usefull if on a Windows Server more than one AOS Instance is installed.
# If you want to collect data only for a specific AOS Instance you have to specify the instance number.
# By default data of all AOS Instance are collected. The Instance number you can get from the AOS Service name. The AX 2012 AOS Service is called AOS60$XX, where XX is the instance.
# e.g. AOS60$01.
# To collect AX AOS data only for instance 01 and 02 you have to define:
#
# validInstances = [ "01","02" ]
## AX ETW Agent collect data regarding AX Client User. It collect information regarding Ax Users Form open and Form closed. Button/Action clicked ..
# This events can only be collected where AX client are installed. It will not be collected based on AOS Instances.
# This is normaly  set to True where ax clients are installed e.g. Terminal Server, Citrix server ...
# Required: NO
# default value if not set: false
#
# axclient = false
#
## Send AX Measurements to NATS
[ax2012.output.nats]
# URL(address) of NATS Server
# Requried:YES
#
address = "<NATSADDRESS>"  # nats io endpoint
## NATS subject to identify the publisher/producer of data
# Requried:YES
#
subject = "<NATSSUBJECT>" #  valid subject
## NATS TLS Config
# set to true TLS is used.
# DEFAULT value is false
#
# secure = true
# TLS Config Parameters are required if parameter secure is set to true
# tls_ca = "<CA_PATH>" #CA_PATH
# tls_cert = "<CERT_PATH>"  #certificate path
# tls_key = "<PRIVATEKEY_PATH>"   #private key path
#
#defines the nats channel to send keepalive & monitoring data infos to NetEye server, disabled by default
#[ax2012.output.tornado]
#topic = "tornado_nats_json.<topic>" #mandatory, it represents the subject on nats-server (configured in tornado_nats_json_collector topics on NetEye)
#keepaliveInterval = 5 #interval in seconds for keepalive message, if omitted default value is 5 seconds;
#monitordataInterval = 30 #interval in seconds for monitordata message, if omitted default value is 30 seconds;
#hostnameformat="fullqualified" #default is "fullqualified", otherwise put "hostonly"
#tornado_dedicated_connection: all the following settings must be used to open a dedicated connection for tornado messages (in case destination addresses and/or certifcate are different)
#address = "TORNADO-NATS-ADDRESS" #optional (see tornado_dedicated_connection above)
#secure = true #optional (see tornado_dedicated_connection above) set as true if TLS is needed, if omitted default value is false
#tls_cert = "<PATHVALUE>\\<filename>.crt.pem" #optional (see tornado_dedicated_connection above) certificate path
#tls_key = "<PATHVALUE>\\<filename>.key.pem"  #optional (see tornado_dedicated_connection above) private key path
#base settings (embedded in agent)
#
#[ax2012.output.nats.retention_policy_tag]
#active=true #if false, this feature is disabled: no retention tag is sent
#default="autogen" # default tag value for all measurements that are not explicitly defined in (retention_policy_tag.<>  measurements) defining the retention on influx
#tag_name="retention_policy" # tag name on the measurments which define the retention
#
#[ax2012.output.nats.retention_policy_tag.etwrp] # retention_policy_tag.<retentionvalue> # <retentionvalue> is retention tag value for measurements in "measurements" array following
#measurements = ["ETW"] # measurment names to which retention policy example tag value etwrp is added
Installation
The Installation process is divided in two phases:
Define the configuration file
axetw.confInstall the AX ETW Tracing Service
Configure file location
The setup will register the location of the config file in the startup parameters of the service. The file will not be copied: for this it is important that a secure location is used for this config file.
The service reads the config file at each start. The config file can be located also on a local path or on a shared path.
Please take into consideration that the user who is installing the AX ETW Tracing Service and the AXTrace Service Account under which the AX ETW Tracing Service is running must have read access to this file.
Note
AXTrace Service Account: Windows account under which the AX ETW Tracing Service can run. The account can be LocalSystem, a Windows account or a valid gMSA.
Installation Prerequisites
User running installation must have Windows local administration rights.
Name |
|---|
Windows Operation System: Windows 2012 R2 or higher (64 Bit) |
Name |
|---|
.NET Framework 4.5 or higher |
ETW Provider Microsoft-DynamicsAX-Tracing (AX 2012), which can be validated with: C:\Users\Admin>logman query providers Microsoft-DynamicsAX-Tracing
|
Installing the AX ETW Tracing Service
Optionally an AXTrace Admin Account can be defined: this allows users other than the Windows Administrator to have the permissions to restart the service. For example it is useful for the purpose of managing the service remotely via PowerShell.
UI installation
Start the installer and follow each step.
Silent mode installation
Run msiexec from command line, here you can see a detailed description regarding msiexec parameters.
To run the installation in silent mode use following syntax:
msiexec /i "AXETWTracing-x64.msi" /qn /L*V <logfile> <AX ETW Setup Parameters>
Setup Parameters
Name |
Description |
|---|---|
INSTALLFOLDER |
Path where the binaries will be installed. Default %PROGRAMFILES%\AXETWTracing. |
LICENSEACCEPTED |
Mandatory - Value must be set to 1 to confirm and accept License agreement. Default value is 0. |
AXETWTRACINGCONFDIR |
Mandatory - Path of the
|
AXETWSERVICEACCOUNTBUILDIN |
If set to 1 AX ETW Tracing Service will run as LocalSystem. If set to 0 ServiceAccount and Password must be defined using Parameter AXETWSERVICEACCOUNT and AXETWSERVICEACCOUNTPWD. Default is 1. |
AXETWSERVICEACCOUNT |
Mandatory if parameter AXETWSERVICEACCOUNTBUILDIN is set to 0. Specify <domain\accountname>. |
AXETWSERVICEACCOUNTPWD |
Mandatory if parameter AXETWSERVICEACCOUNTBUILDIN is set to 0. Let value empty e.g. “” if you set up a gMSA. |
AXETWASSIGNADMIN |
If set to 1 a Windows Account/Group defined with param AXETWADMINACCOUNT becomes the permissions to stop/start/query the AX ETW Service.Default is 0 (false). |
AXETWADMINACCOUNT |
Mandatory if parameter AXETWSERVICEACCOUNTBUILDIN is set to 1. Specify <Domain\accountname> or <Domain\group>. |
Setup validation sequence
Once installation is complete the setup will check that in this directory or subdirectory (having the name of the computer where service is installed) a valid config file with then name axetw.conf exists.
The file will be searched using next sequence:
<AXETWTRACINGCONFDIR>\<computername>.<FullComputerDomainname>\axetw.conf
<AXETWTRACINGCONFDIR>\<computername>\axetw.conf
<AXETWTRACINGCONFDIR>\axetw.conf
Once the file is found, setup will skip further validations and the first retrieved path will be used.
Examples of installation
To install the service in the default executables path with an existing service account “dom\axetwusr”, config file on shared path \myfileserveraxtracingXXX:
msiexec /i "AXETWTracing-x64.msi" /qn /L*V c:\axetwtracinginstall.log AXETWTRACINGCONFDIR="\\myfileserver\axtracingXXX" AXETWSERVICEACCOUNTBUILDIN=0 AXETWSERVICEACCOUNT="dom\axetwusr" AXETWSERVICEACCOUNTPWD="password" AXETWASSIGNADMIN=0 LICENSEACCEPTED="1"
To install the service in the default executables path, with an existing service account “domaxetwusr” and a usergroup “domaxetwadmingrp” with admin rights on the service, config file on path “d:axtracingXXX”:
msiexec /i "AXETWTracing-x64.msi" /qn /L*V c:\axetwtracinginstall.log AXETWTRACINGCONFDIR="d:\axtracingXXX" AXETWSERVICEACCOUNTBUILDIN=0 AXETWSERVICEACCOUNT="dom\axetwusr" AXETWSERVICEACCOUNTPWD="password" AXETWASSIGNADMIN=1 AXETWADMINACCOUNT="dom\axetwadmingrp" LICENSEACCEPTED="1"
To install the service in the c:toolsaxetwtraining path, running as LocalSystem user and with no Admin users:
msiexec /i "AXETWTracing-x64.msi" /qn /L*V c:\axetwtracinginstall.log AXETWTRACINGCONFDIR="d:\axtracingXXX" INSTALLFOLDER="c:\tools\axetwtraining" AXETWSERVICEACCOUNTBUILDIN=1 LICENSEACCEPTED="1"
Return codes msiexec
In silent mode you can verify if installation was successfull checking the exitcode of msiexec.
If exit code is 0 installation was successfull. For details of error codes refer to Error codes.
Setup Error and Failures
Setup will fail under one or more of following conditions:
Config file is not found/readable
Content of config file is not valid:
Missing or wrong NATS server
Missing or wrong NATS port
Details of error can be found in the msi log file or in the application eventlog filtering source AXETWTracing. If setup fails please verify on this location.
Uninstall AX ETW Tracing Service
From Control Panel
Find AXETWTracing in installed programs list then right mouse click and choose option Uninstall.
In silent mode
Using the product code (see list of Product Codes).
msiexec /x "{XXXXXXXX-XXXX-XXXX-XXXX-XXXXXXXXXXXX}" /qn /L*V c:\axetwtracinguninstall.log
Upgrade from a Previous Version
Each upgrade will be handled as Major Upgrade. During an upgrade Windows Installer removes the old version and then installs the new version. Windows Installer does check current installed version using the ProductCode Guid of the msi bundle. Consider carefully this aspect when agent deployment is automated through instumentations like e.g. PowerShell DSC.
The ProductCode for the actual version can be found under Product Codes. Please take in consideration that you have to run the upgrade/installation with the necessary setup parameters (same as a first installation).
If during installation of the new version an error occures, the old version will not be restored!!
Note
Known issues: upgrading from version 0.1.x during uninstall service is stopped but process is still running for approx 30 sec. Please stop service and check that process AXETWTracing is removed, before running msi bundle.
List of ProductCode for released versions
Version |
Productcode |
|---|---|
0.6.2 |
{6618FB9F-79E3-4F98-98B7-DDDB35EFA8D9} |
0.6.1 |
{23605492-41CE-43F5-BDAF-3C3A570427D2} |
0.5.0 |
{028F0085-10F0-496E-8AF0-091CE1E362B5} |
0.4.1 |
{DD16E428-A3ED-415B-8F68-7A21D5000789} |
0.4.0 |
{9446603F-3B28-4B5B-86B2-FCFE896EC285} |
0.3.1 |
{EE218EEE-E01B-4AD9-A112-9A209CE8BFE2} |
0.3.0 |
{964B29C2-65D9-49FA-905F-FBC82F7C4F05} |
0.2.0 |
{4ACFA367-02CA-49B8-82D0-F501D2A9AE3E} |
0.1.1 |
{B25BF6EF-109F-4044-8B33-05E29F322C6E} |

