Concepts
Architecture of NetEye SIEM Module
The SIEM module is based on the Elastic stack and is intended to provide various means to manage–collect, process, and sign–log files produced by NetEye and by the various services running on it.
SIEM in computer security refers to a set of practices whose purpose is to collect log files from different hosts and services, usually running on the internal network infrastructure of a company or enterprise, and process them for disparate purposes including security analysis, data compliance, log auditing, reporting, alerting, performance analysis, and much more.
Typical components of a SIEM solution include:
a log collector, which can be multiple software that concur to receive log files and convert them to a given format
a storage facility, typically a (distributed) database
a visualisation engine, to create dashboards and reports
some kind of time-stamping solution, to provide data unchangeability, useful for log auditing and compliance to laws and regulations
NetEye SIEM Module components
NetEye SIEM solution is mostly based on the Elastic Stack components, in particular:
- Elasticsearch and Elasticsearch cluster
Elasticsearch can be installed in different modalities, the simplest being as a service running on a NetEye single instance.
When running a NetEye Cluster with the SIEM module installed, Elasticsearch can be run as either a parallel Elasticsearch Cluster or as an Elastic node within the NetEye cluster. Please refer to NetEye’s Cluster Architecture for details.
Elasticsearch, regardless of how it is installed, is used in the context of SIEM for multiple purposes:
as a database to store all the log files that have been collected and processed
as a search engine over the data stored
to process data (though this function is carried out also by other components, see below)
- BEAT
A Beat is a small, self-contained agent installed on devices within an infrastructure (mostly servers and workstations) that acts as a client to send data to a centralised server where they are processed in a suitable way.
Beats are part of the Elastic Stack; they gather data and send them to Logstash.
There are different types of Beat agents available, each tailored for a different type of data. BEATs supported by NetEye are described in section The Elastic Beat feature.
- Logstash
Logstash is responsible for the collection of logs, (pre-)processing them, and forwarding them to the defined storage: an Elasticsearch cluster or to El Proxy. Logs are collected from disparate sources, including Beats, syslog, and REST endpoints.
- El Proxy
The purpose of the Elastic Blockchain Proxy is to receive data from Logstash and process it: first, the hash of the data is calculated, then data are signed and saved into a blockchain, which guarantees their unchangeability over time, and finally everything is sent to Elastic. Please refer to section El Proxy Architecture for more information.
- Kibana
A GUI for Elasticsearch, its functionalities include:
visualise data stored in Elasticsearch
create dashboards for quick data access
define queries against the underlying Elasticsearch
integration with Elastic’s SIEM module for log analysis and rule-based threats detection
use of machine-learning to improve log analysis
More information about these components can be found in the remainder of this section.
Elasticsearch Clusters
General Elasticsearch Cluster Information
In order to avoid excessive, useless network traffic generated when the cluster reallocates shards across cluster nodes after you restart an Elasticsearch instance, NetEye employs systemd post-start and pre-stop scripts to automatically enable and disable shard allocation properly on the current node whenever the Elasticsearch service is started or stopped by systemctl.
Note
By starting a stopped Elasticsearch instance, shard allocation will be enabled globally for the entire cluster. So if you have more than one Elasticsearch instance down, shards will be reallocated in order to prevent data loss.
- Therefore best practice is to:
Never keep an Elasticsearch instance stopped on purpose. Stop it only for maintenance reasons (e.g. for restarting the server) and start it up again as soon as possible.
Restart or stop/start one Elasticsearch node at a time. If something bad happens and multiple Elasticsearch nodes go down, then start them all up again together.
Elastic-only Nodes
From Neteye 4.9 it is possible to install Elastic-only nodes in order to improve elasticsearch performance by adding more resources and processing abilities to the cluster.
For more information on Single Purpose nodes please check out Cluster Architecture
To create an Elastic-only node you have to create an entry of type
ElasticOnlyNodes in the file /etc/neteye-cluster as in the following
example. Syntax is the same used for standard Node
{ "ElasticOnlyNodes": [
             {
          "addr" : "192.168.1.3",
          "hostname" : "my-neteye-03",
          "hostname_ext" : "my-neteye-03.example.com"
       }
    ]
}
Voting-only Nodes
From Neteye 4.16 it is possible to install Voting-only nodes in order to add a node with a single purpose - to provide quorum. If SIEM module is installed, this node also provides voting-only functionalities to Elasticsearch cluster.
This functionality is achieved configuring the node as a voting-only
master-eligible node specifying the variable
ES_NODE_ROLES="master, voting_only" in the sysconfig file
/neteye/local/elasticsearch/conf/sysconfig/elasticsearch-voting-only.
Voting-only node is defined in /etc/neteye-cluster as in the following example
{ "VotingOnlyNode": {
         "addr" : "192.168.1.3",
         "hostname" : "my-neteye-03",
         "hostname_ext" : "my-neteye-03.example.com",
         "id" : 3
      }
}
Please note that VotingOnlyNode is a json object and not an array because you can have a single Voting-only node in a NetEye cluster.
Design and Configuration
With NetEye 4 we recommend that you use at least 3 nodes to form an Elasticsearch cluster. If nevertheless you decide to setup a 2-node cluster, we recommend to consult a Würth Phoenix NetEye Solution Architect who can fully explain the risks in your specific environment and help you develop strategies to mitigate potential risks.
Elasticsearch coordination
subsystem
is in charge to choose which nodes can form a quorum (note that all
NetEye cluster nodes are master eligible by default). If Log Manager is
installed, the neteye_secure_install script will properly set
seed_hosts and initial_master_nodes according to Elasticsearch’s
recommendations and no manual intervention is required.
neteye_secure_install will set two options to configure cluster
discovery:
discovery.seed_hosts: ["host1", "host2", "host3"]
cluster.initial_master_nodes: ["node1"]
Please note that the value for initial_master_nodes will be set only on the first installed node of the cluster (it is optional on other nodes and if set it must be the same for all nodes in the cluster). Option seed_hosts will be set on all cluster nodes, included Elastic Only nodes, and will have the same value on all nodes.
Elasticsearch reverse proxy
Starting with NetEye 4.13, NGINX has been added to NetEye. NGINX acts as a reverse proxy, by exposing a single endpoint and acting as a load-balancer, to distribute incoming requests across all nodes and, in this case, to all Elasticsearch instances. This solution improves the overall performance and reliability of the cluster.
The elasticsearch endpoint is reachable at URI https://elasticsearch.neteyelocal:9200/. Please note that this is the same port used before so no additional change is required; old certificates used for elastic are still valid with the new configuration.
All services connected elastic stack services like Kibana, Logstash and Filebeat have been updated in order to reflect this improvement and to take advantages of the new load balancing feature.
El Proxy
El Proxy (also called Elastic Blockchain Proxy) allows a secure live signature of log streams from Logstash to Elasticsearch.
It provides protection against data tampering by transforming an input stream of plain logs into a secured blockchain where each log is cryptographically signed.
Warning
NetEye administrators have unrestricted control over El Proxy logs stored on Elasticsearch and over the acknowledgement indices (see Acknowledging Corruptions of a Blockchain). Therefore, we strongly suggest following the Principle of Least Privilege, investing the appropriate time and effort to ensure that the people on NetEye have the right roles and the minimum permissions.
Architecture
From an high level point of view, three are the main components of the architecture:
The first component is Logstash, which collects logs from various sources and sends them to the El Proxy using the
json_batchformat of Elastic’s http-output plugin.Note
Due to the fact that the El Proxy does not provide persistence, Logstash should always be configured to take care of the persistence of the involved logs pipelines.
The second component is El Proxy itself, which receives batches of logs from Logstash, signs every log with a cryptographic key used only once, and, finally, forwards the signed logs to the Elasticsearch Bulk API;
The third component is Elasticsearch, which acquires the signed logs from El Proxy and persists them on the dedicated index.
How the El Proxy works
El Proxy uses a set of Signature Keys to sign the incoming logs and then sends them to Elasticsearch. Each log file is signed with a different Signature Key (seeded from the previous Signature Key); the signature includes the hash of the previous log. The logs that for any reason cannot be indexed in Elasticsearch are written in a Dead Letter Queue.
The flowchart depicted in Fig. 202 offers a high-level overview on the process followed by El Proxy to sign a batch of logs. You can notice in particular how El Proxy handles Signature Keys once a batch of logs is written (or not written).
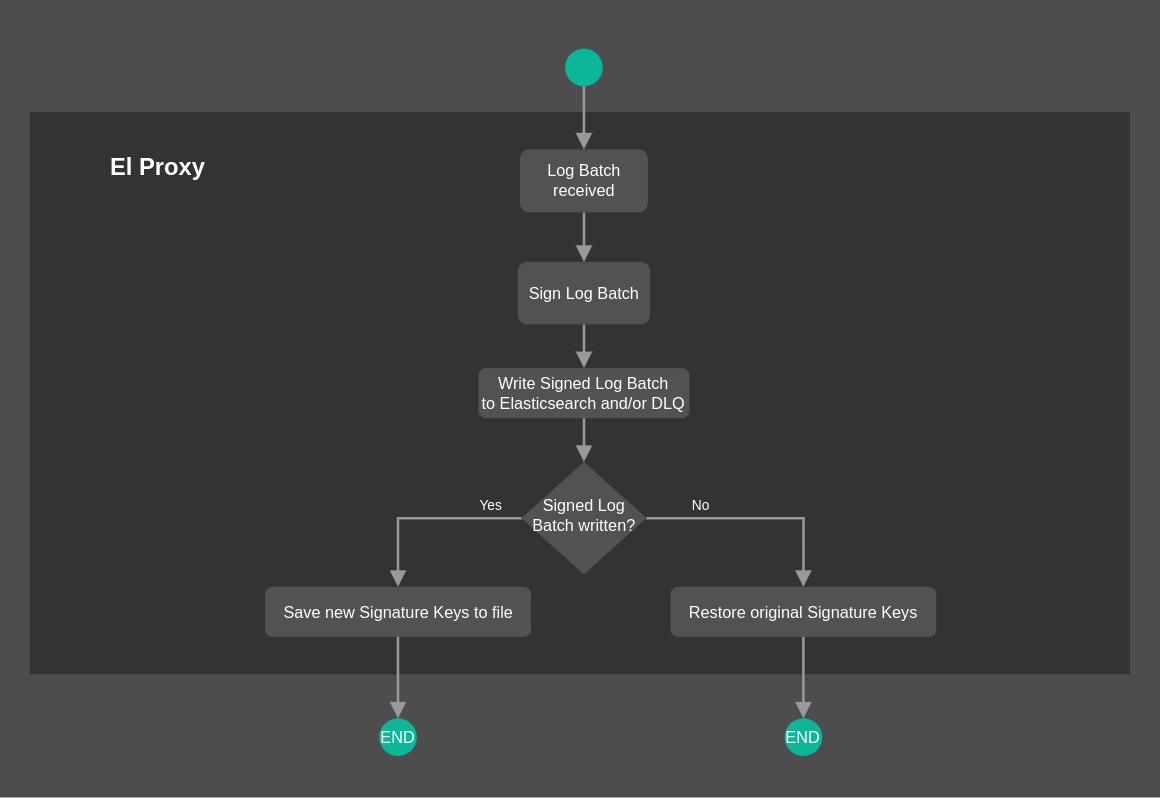
Fig. 202 El Proxy flowchart Overview
REST Endpoints
The El Proxy receives data from REST endpoints:
log endpoint:
description: Receives and processes a single log message in JSON format
path : /api/log
method: POST
request type: JSON
request example:
{
   "entry": "A log message"
}
response: The HTTP Status code 200 is used to signal a successful processing. Other HTTP status codes indicate a failure.
log_batch endpoint:
description: Receives and processes an array of log messages in JSON format
path : /api/log_batch
method: POST
request type: JSON
request example:
[
     {
         "entry": "A log message",
        "other": "Additional values...",
        "EBP_METADATA": {
           "agent": {
              "type": "auditbeat",
              "version": "7.10.1"
           },
           "customer": "neteye",
           "retention": "6_months",
           "blockchain_tag": "0",
           "event": {
              "module": "elproxysigned"
           },
           "pipeline": "my_es_ingest_pipeline"
        }
     },
     {
         "entry1": "Another log message",
        "entry2": "Another log message",
        "EBP_METADATA": {
           "agent": {
              "type": "auditbeat",
              "version": "7.10.1"
           },
           "customer": "neteye",
           "retention": "6_months",
           "blockchain_tag": "0",
           "event": {
              "module": "elproxysigned"
           },
           "pipeline": "my_es_ingest_pipeline"
        }
     },
     {
        "entry": "Again, another message",
       "EBP_METADATA": {
          "agent": {
             "type": "auditbeat",
             "version": "7.10.1"
          },
          "customer": "neteye",
          "retention": "6_months",
          "blockchain_tag": "0",
          "event": {
             "module": "elproxysigned"
          }
       }
     }
]
response: The HTTP Status code 200 is used to signal a successful processing. Other HTTP status codes indicate a failure.
DeadLetterQueue status endpoint:
description: Returns the status of the Dead Letter Queue. The status contains information on whether the DLQ is empty or not.
path : /api/v1/status/dlq
method: GET
response: The status of the DLQ in JSON format.
response example:
{
  "empty": true
}
KeysBackup status endpoint:
description: Returns the status of the keys backup. The status contains information on whether any key backup is present in the
{data_backup_dir}folder.path : /api/v1/status/keys_backup
method: GET
response: The status of the Keys Backup in JSON format.
response example:
{
  "empty": true
}
Metrics endpoint:
description: Returns the metrics collected by El Proxy since the last restart.
path : /api/v1/metrics/prometheus
method: GET
response: The metrics collected by El Proxy since the last service restart
response example:
# HELP el_proxy_response_time Response time of El Proxy for signing requests
# TYPE el_proxy_response_time histogram
el_proxy_response_time_bucket{service_name="elproxy",le="0.05"} 8
el_proxy_response_time_bucket{service_name="elproxy",le="0.1"} 8
el_proxy_response_time_bucket{service_name="elproxy",le="0.2"} 9
el_proxy_response_time_bucket{service_name="elproxy",le="0.5"} 10
el_proxy_response_time_bucket{service_name="elproxy",le="1"} 10
el_proxy_response_time_bucket{service_name="elproxy",le="2"} 11
el_proxy_response_time_bucket{service_name="elproxy",le="5"} 11
el_proxy_response_time_bucket{service_name="elproxy",le="+Inf"} 11
el_proxy_response_time_sum{service_name="elproxy"} 1.51250216
el_proxy_response_time_count{service_name="elproxy"} 11
# HELP processed_logs Number of processed logs
# TYPE processed_logs counter
processed_logs{result="dlq",service_name="elproxy"} 2
processed_logs{result="failure",service_name="elproxy"} 2
processed_logs{result="indexed",service_name="elproxy"} 18
# HELP processed_requests Number of processed requests
# TYPE processed_requests counter
processed_requests{result="failure",service_name="elproxy"} 1
processed_requests{result="success",service_name="elproxy"} 10
# HELP received_logs Number of received logs
# TYPE received_logs counter
received_logs{retention="6_months",service_name="elproxy",tag="0",tenant="mycustomer"} 22
# HELP received_requests Number of received requests
# TYPE received_requests counter
received_requests{service_name="elproxy"} 11
# HELP write_logs_elasticsearch_response_time Elasticsearch response time for requests writing logs
# TYPE write_logs_elasticsearch_response_time histogram
write_logs_elasticsearch_response_time_bucket{service_name="elproxy",le="0.05"} 14
write_logs_elasticsearch_response_time_bucket{service_name="elproxy",le="0.1"} 14
write_logs_elasticsearch_response_time_bucket{service_name="elproxy",le="0.2"} 15
write_logs_elasticsearch_response_time_bucket{service_name="elproxy",le="0.5"} 16
write_logs_elasticsearch_response_time_bucket{service_name="elproxy",le="1"} 16
write_logs_elasticsearch_response_time_bucket{service_name="elproxy",le="2"} 16
write_logs_elasticsearch_response_time_bucket{service_name="elproxy",le="5"} 16
write_logs_elasticsearch_response_time_bucket{service_name="elproxy",le="+Inf"} 16
write_logs_elasticsearch_response_time_sum{service_name="elproxy"} 0.450198966
write_logs_elasticsearch_response_time_count{service_name="elproxy"} 16
The following metrics are available:
received_requests: number of received requests made to /api/log and /api/log_batchprocessed_requests: number of processed requests. The following attributes are used:result: the result of the processing of one requestsuccess: in case the request response was OK, meaning that El Proxy returned 200 to Logstash. Note that a request is also considered to be successful if some of the logs failed to be indexed on Elasticsearch but were successfully written in the DLQ.failure: in case the request response was other than OK.
failure_type: the failure type of the processing of one requestnone: the request was processed successfully. In this case,resultis alwayssuccesselasticsearch_error: the request to El Proxy failed due to an error during a request to Elasticsearch (e.g. the Elasticsearch request went in timeout or Elasticsearch returned a 500 Internal Server Error)file_system_error: the request failed because of a file system error. This failure is often related to misconfigured permissions on the NetEye machinedlq_error: the request triggered the writing of the logs in DLQ, and the writing operation failedfull_queue_error: the request failed because the internal communication channel of El Proxy between the requests-producer and the requests-consumer is either closed or saturatedinternal_error: the request failed because of a general internal errorunexpected_error: the request failed because of an unexpected error
received_logs: number of received logs. The following attributes are used to group the number of received logs by their target blockchaintenant: the tenant of the target blockchain for a given logretention: the retention of the target blockchain for a given logtag: the tag of the target blockchain for a given log
processed_logs: number of processed logs. The following attribute is used:result: the result of the processing of one logindexed: the log was successfully indexed on Elasticsearchdlq: the log was successfully written in DLQfailure: the log was neither indexed in Elasticsearch, neither written in DLQ, due to some errors
el_proxy_response_time: the time taken by El Proxy to receive and process a requestelasticsearch_requests: the number of indexing requests made to Elasticsearch. The following attributes are used:result: the result of the request. It can be one of the followingsuccess: the request was successful. Every log of the request was indexed in Elasticsearchpartial_failure: the request was not completely successful. One or more logs of the request failed to be indexed in Elasticsearchfailure: the request failed. Zero logs were indexed in Elasticsearch
retry_reason: the reason for which a previous non-completely-successful request was retried. It can be one of the followingnone: the request was not a retry request caused by a previous non-completely-successful requestglobal: the request is the retry of a previous failed request. This request is the same as the previously failed one. Such retry requests could happen for example if the Elasticsearch is having some problems, or is not reachablepipeline: the request is the retry of a previously partially-failed request. In this request, the Elasticsearch pipeline (if present) has been removed from the logs to bypass possible pipeline errorsmalformed_logs: the request is the retry of a previously non-completely-successful request. In this request, each log has been reduced to its bare minimum removing all the fields which are not signed by El Proxy to bypass possible errors due to the malformed content of the log
write_logs_elasticsearch_response_time: the time taken by Elasticsearch to process a request
Sequential logs processing
An important aspect to bear in mind of is that the log requests for the same blockchain are always processed sequentially by El Proxy. This means that, when a batch of logs is received from Logstash, it is queued in an in-memory queue and it will be processed only when all the previously received requests are completed.
This behavior is required to assure that the blockchain is kept coherent
with no holes in the iteration sequence.
Nevertheless, as no parallel processing is possible for a single blockchain, this puts some hard limits on the maximum throughput reachable.
Example Scenarios
As a running example, let’s imagine sending the following authentication event to El Proxy:
{
  "host": {
    "name": "myhost.wp.lan",
    "ip": "172.17.0.2"
  },
  "event": {
      "category": "authentication"
  }
}
To help you understand how the El Proxy architecture works together with Logstash and Elasticsearch, please have a look at the following scenarios.
In each scenario, the event is sent from Logstash to Elasticsearch through El Proxy.
Scenario 1
In our first scenario, no particular error happens during the signing process, so El Proxy signs the event, adds a new block to an existing blockchain, or creates a new chain from scratch if needed, and indexes the resulting document in a dedicated Elasticsearch index.
This is the most basic scenario, please refer to How the El Proxy works for additional details.
Scenario 2
As in the previous example, El Proxy signs the event, adds it to the blockchain, and indexes it in Elasticsearch.
Logstash, however, goes down before getting notified by El Proxy about the success of the whole signing/adding/indexing operation. Logstash, then, can not acknowledge the correct delivery of the event, even though El Proxy has already successfully indexed the event.
Logstash, in the meanwhile, is restarted successfully and it sends the same event to El Proxy again. El Proxy goes through the signing/adding/indexing operation for a second time, creating a duplicated event in Elasticsearch, but keeping a coherent blockchain.
Scenario 3
In this scenario, El Proxy is down while Logstash is sending events to it and therefore the event cannot be signed, added to the blockchain, and indexed.
In this case, Logstash tries to send the event to El Proxy until succeeding. If also Logstash is restarted before being able to successfully send the event to El Proxy, no event loss is experienced since events are disk persisted. As soon as Logstash is up and running again, it will send the pending event to El Proxy. Differently from scenario 2, this will not cause any event duplication in Elasticsearch.
Scenario 4
In this scenario, Logstash, instead of sending the example event to El Proxy, sends an event with a field that does not match the Elasticsearch mapping definition of the index in which the resulting document will be stored.
In the running example, the host field is mapped as an object (as you can see in the code snipped
reported in the introduction). Logstash, however, has received an event in which the host field
appears as a string:
{
  "host": "myhost.wp.lan",
  "event": {
      "category": "authentication"
  }
}
El Proxy signs the event, adds it to the blockchain, and tries to index it in Elasticsearch.
Elasticsearch, however, refuses to index the document, returning an error to El Proxy.
El Proxy then removes all event fields that are not specified in the configuration file
elastic_blockchain_proxy_fields.toml for being signed and tries to reindex the event again.
At this point we can have different outcomes:
the host field is not included in the signature:
the field is removed from the event, fixing the mapping definition issue, and the resulting document is then successfully indexed
the host field must be included in the signature:
the mapping definition issue still exists, then the event is again rejected by Elasticsearch
the event is then put in the Dead Letter Queue (DLQ) waiting for manual intervention
in case of failure writing the event in the DQL, El Proxy returns an error to Logstash, which tries to send the event again
Please refer to El Proxy Configuration for additional details.
Scenario 5
In this scenario, El Proxy signs the event and adds it to the blockchain. When trying to index the event in Elasticsearch, however, El Proxy gets some communication errors from Elasticsearch. For example, Elasticsearch is temporarily down, or the disk has less than 15% of free space, causing Elasticsearch to refuse to index.
Then, El Proxy retries to index the event with exponential back-off and:
if succeeding before hitting the maximum amount of retries, then the event is indexed
if the maximum amount of retries is hit without indexing, then an error is returned to Logstash, which tries to send the event again
The number of retries can be defined in the El Proxy configuration. Please refer to El Proxy Configuration for additional details.
Scenario 6 - Verification
In this scenario, we would like to verify the blockchain to ensure that it does not contain any
corruption. To achieve this, we run the elastic_blockchain_proxy verify command and we
obtain a report about the state of the blockchain.
The verification process requires some time, mainly to gather the necessary data from Elasticsearch (queries). In fact, the entire blockchain needs to be queried to obtain the fields needed by the verification and this operation is performed in batches to comply with Elasticsearch query limits. Therefore, the number of logs present in the blockchain heavily impacts the time required for the verification: in case of hundred of millions of logs, hours of processing are needed.
Thereby, with the goal of speeding up the process, the verification command can verify more batches concurrently, with the default set to 2, as described in the El Proxy Configuration.
Warning
We discourage increasing the default number of concurrent batches, as this may cause a general slow down of Elasticsearch due to overloading.
In order to understand the performance of the verification process on a specific system, the
elastic_blockchain_proxy verify-cpu-bench can be used to verify a
customizable number of sample logs, using a specific number of concurrent processes. This helps in
understanding the hardware performance of our system with respect to the verification process.
Graph Fig. 202 outlines how the increase of concurrent batches during the verification affects the time taken by the process, on a typical system.

Fig. 203 El Proxy concurrency Graph
time_4M_logs_seconds: number of seconds taken by the verification of about 4 millions of logs
expected_time_500M_logs_hours: projection of the time taken by the verification of about 500 millions logs, in hours
Agents
The Elastic Beat feature
NetEye can receive data from Beats installed on monitored hosts (i.e., on the clients).
NetEye currently supports Filebeat as a Beat agent and the Filebeat NetFlow Module for internal use. Additional information about the Beat feature can be found in the official documentation.
The remainder of this section shows first how NetEye is configured to receive data from Beats, i.e., as a receiving point for data sent by Beats, then explains how to install and configure Beats on clients, using SSL certificates to protect the communication.
Overview of NetEye’s Beat infrastructure setup
Beats are part of the SIEM module, which is an additional module, that can be installed following the directions in the NetEye Additional Components Installation section if you have the subscription.
Warning
Beats are intended as a replacement for Safed, even if they can coexist. However, since both Beat and Safed might process the same data, they would double the time and resources required, therefore it is suggested to activate only one of them.
The NetEye implementation allows Logstash to listen to incoming data on a secured TCP port (5044). Logstash then sends data into two flows:
to a file on disk, in the /neteye/shared/rsyslog/data folder, with the following name:
%{[agent][hostname]}/%{+YYYY}/%{+MM}/%{+dd}/[LS]%{[host][hostname]}.log. The format of the file is the same used forsafedfiles. This file is encrypted and its integrity validated, like it happens for Safed, and written to disk to preserve its inalterability.to Elastic, to be displayed into preconfigured Kibana dashboards.
Communication is SSL protected, and certificates need to be installed on clients together with the agents, see next section for more information.
Note
When the module is installed there is no data flow until agents are installed on the clients to be monitored. Indeed, deployment on NetEye consists only of the set up of the listening infrastructure.
The Beat feature is currently a CLI-only feature: no GUI is available and the configuration should be done by editing configuration files.