How To Send vSphereDB Events or Alarms to Tornado
This How To is intended to explain you the workflow to send all events and alarms of vSphereDB - VMWare to Tornado, such that you can use the monitoring executor to send passive check results.
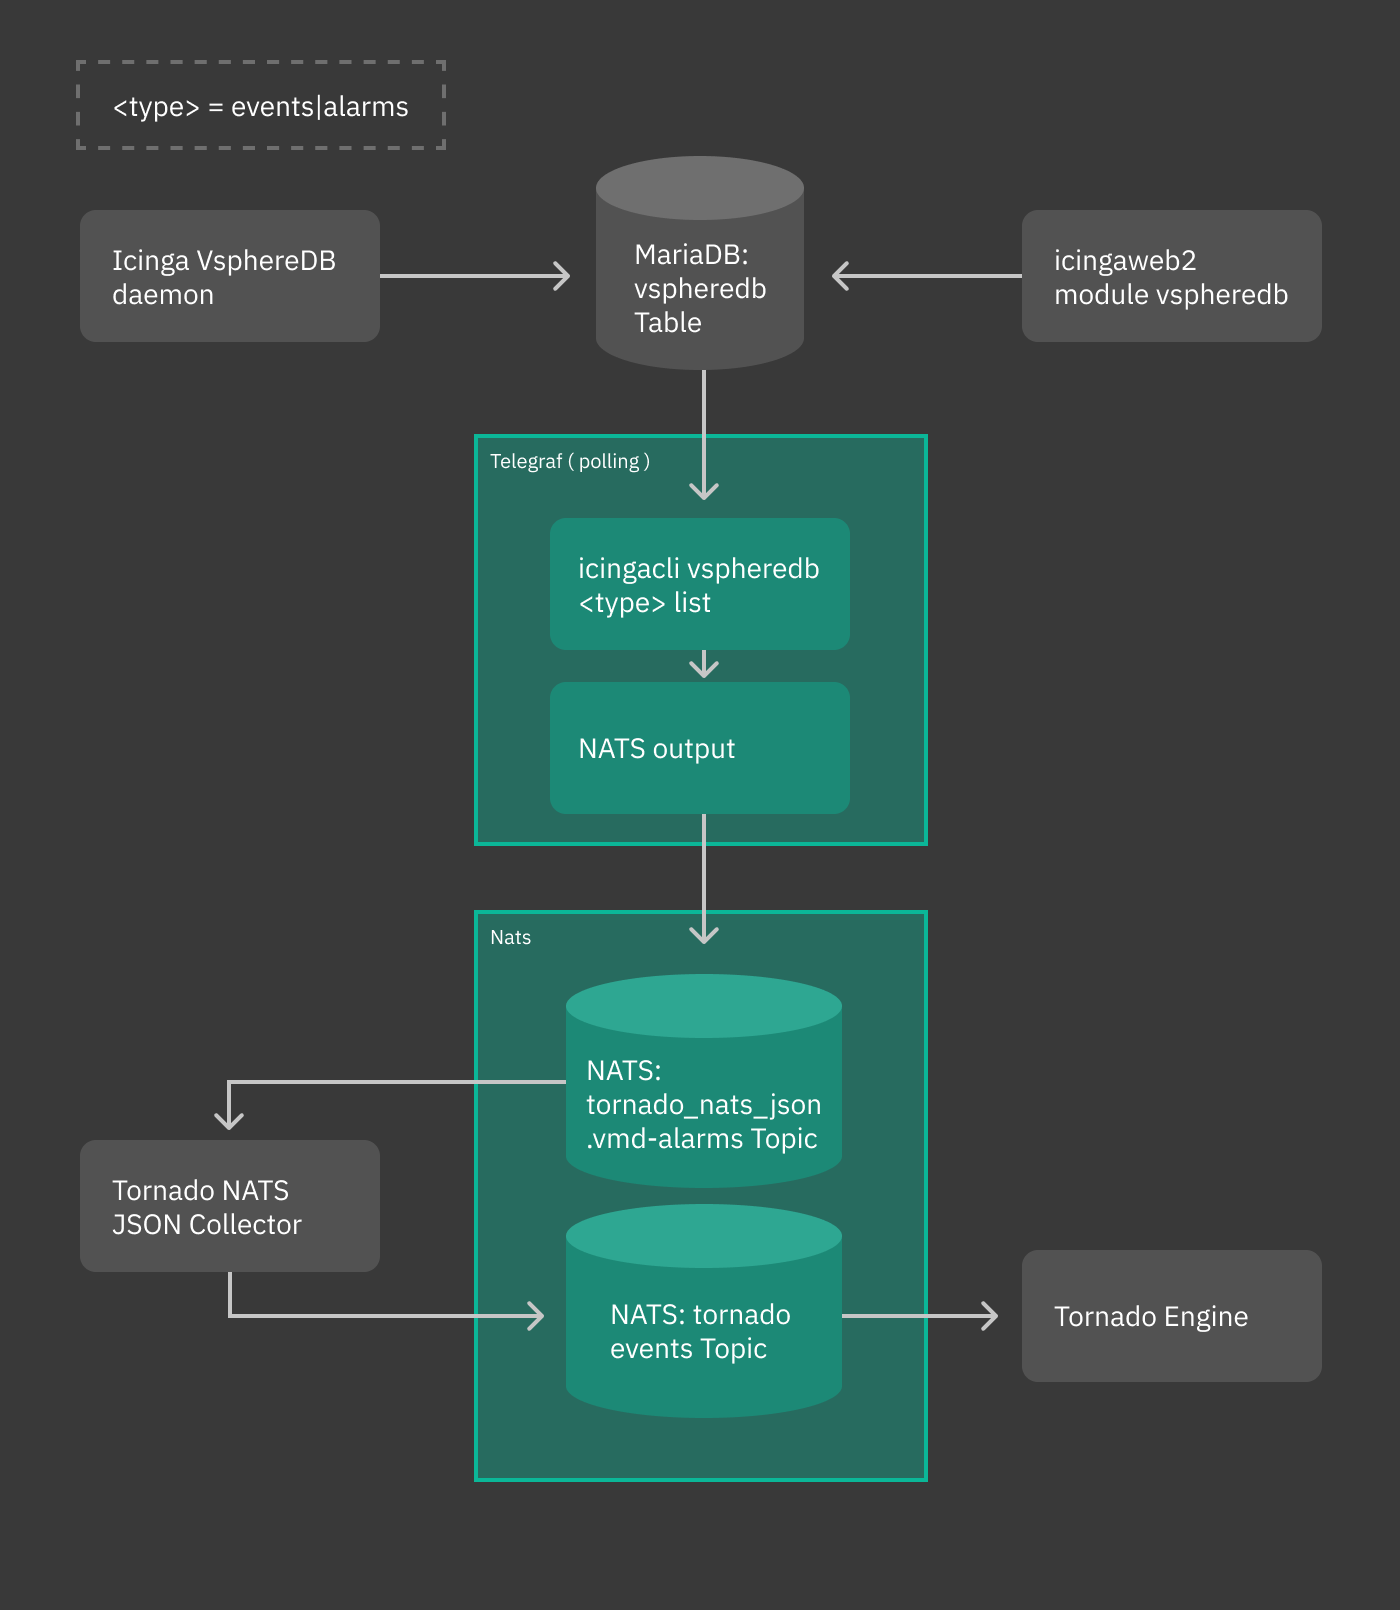
You can see a sketch of the workflow in the following diagram.

Fig. 242 vsphere workflow
In our scenario, we receive an alarm about a virtual machine whose memory usage surpasses a given threshold. We want that a new host be created, with a service in CRITICAL status. To do so, we also exploit the abilities of the recently introduced Monitoring Executor.
Overview
Events and alarms collected by vSphere/VMD are sent to telegraf, then converted to JSON and fed to the Tornado NATS JSON Collector. All this part of the process is automatic. When installed, suitable configuration files are written in order to simplify the whole process of intercommunication across these services.
Once the event or the alarm reaches Tornado, it can be processed by writing appropriate rules to react to that event or alarm. This is the only part of the whole process that requires some effort.
In the remainder of this how to we give some high level description of the various involved parts and conclude with the design of a rule that matches the event output by vSphere.
Telegraf plugin
The telegraf plugin is used to collect the metrics from the vSphereDB
i.e. events or alarms via the exec input plugin. This input plugin
executes the icingacli command
icingacli vspheredb <events/alarms> list --mark-as-read to fetch
them in JSON format from the vSphereDB and send it to NATS as output
using the nats output plugin.
To keep track of the events and alarms sent, a database table is created, which stores the last fetched IDs of the events and alarms.
Warning
When updating tornado in existing installations, the latest event and alarm will be marked. Only more recent events and alarms will then be sent to tornado, to avoid flooding the tornado engine.
NATS JSON Collector
The newly introduced NATS JSON Collector will receive the vSphere events and alarms in JSON format from the NATS communication channel and then convert them into the internal Tornado Event structure, and forward them to the Tornado Engine.
Tornado Event Rule
Now, suppose you receive the following alarm from vSphere:
{
  "type": "tornado_nats_json.vmd-alarms",
  "created_ms": 1596023834321,
  "payload": {
    "data": {
      "fields": {
        "alarm_name": "Virtual machine memory usage",
        "event_type": "AlarmStatusChangedEvent",
        "full_message": "Alarm Virtual machine memory usage on pulp2-repo-vm changed from Gray to Red",
        "moref": "vm-165825",
        "object_name": "pulp2-repo-vm",
        "object_type": "VirtualMachine",
        "overall_status": "red",
        "status_from": "gray",
        "status_to": "red"
      },
      "name": "exec_vmd_alarm",
      "tags": {
        "host": "0f0892f9a8cf"
      },
      "timestamp": 1596023830
    }
  }
}
This alarm notifies that a virtual machine changed its memory usage from Gray to Red, along with other information. We want that for incoming alarms like these, tornado emits a notification. We need therefore to define a Constraint that matches the abovementioned alarm:
{
  "WHERE": {
    "type": "AND",
    "operators": [
      {
        "type": "equals",
        "first": "${event.type}",
        "second": "tornado_nats_json.vmd-alarms"
      },
      {
        "type": "equals",
        "first": "${event.payload.data.fields.event_type}",
        "second": "AlarmStatusChangedEvent"
      },
      {
        "type": "equals",
        "first": "${event.payload.data.fields.status_to}",
        "second": "red"
      }
    ]
  },
  "WITH": {}
}
The corresponding Actions can be defined like in the following sample snippet:
[
  {
    "id": "monitoring",
    "payload": {
      "action_name": "create_and_or_process_service_passive_check_result",
      "host_creation_payload": {
        "object_type": "Object",
        "imports": "vm_template",
        "object_name": "${event.payload.data.fields.object_name}"
      },
      "service_creation_payload": {
        "object_type": "Object",
        "host": "${event.payload.data.fields.object_name}",
        "imports": "vm_alarm_service_template",
        "object_name": "${event.payload.data.fields.event_type}"
      },
      "process_check_result_payload": {
        "type": "Service",
        "service": "${event.payload.data.fields.object_name}!${event.payload.data.fields.event_type}",
        "exit_status": "2",
        "plugin_output": "CRITICAL - Found alarm '${event.payload.data.fields.alarm_name}' ${event.payload.data.fields.full_message}"
      }
    }
  }
]
This action creates a new host with the following characteristics, retrieved from the JSON sent from vSphere:
the name of the host will be extracted from the
event.payload.data.fields.object namefield, therefore it will be pulp2-repo-vmthe associated service will be defined from the
event.payload.data.fields.event_typefield, hence AlarmStatusChangedEvent

