User Guide Functional Overview Requirements Architecture System Installation NetEye Additional Components Installation Setup The neteye Command Director NetEye Self Monitoring Tornado Business Service Monitoring IT Operation Analytics - Telemetry Geo Maps NagVis Audit Log Shutdown Manager Reporting ntopng Visual Monitoring with Alyvix Elastic Stack IT Operations (Command Orchestrator) Asset Management Service Level Management Cyber Threat Intelligence - SATAYO NetEye.Cloud Strategy Monitoring SOC System Administrator SOC Attacker Centric Cyber Threat Intelligence - SATAYO NetEye Update & Upgrade Backup and Restore How To NetEye Extension Packs Troubleshooting Security Policy Glossary
module icon Cyber Threat Intelligence - SATAYO
Introduction The Intelligence We Produce Mitre Attack Coverage Getting Started Settings SATAYO Items Intelligence Requirements Managed Service Request Form FAQ Changelog SATAYO Community
ntopng Visual Monitoring with Alyvix Elastic Stack IT Operations (Command Orchestrator) Asset Management Service Level Management Cyber Threat Intelligence - SATAYO Introduction to NetEye Monitoring Business Service Monitoring IT Operation Analytics Visualization Network Visibility Log Management & Security Orchestrated Datacenter Shutdown Application Performance Monitoring User Experience Service Management Service Level Management & Reporting Requirements for a Node Cluster Requirements and Best Practices NetEye Satellite Requirements TCP and UDP Ports Requirements Additional Software Installation Introduction Single Node Cluster NetEye Master Master-Satellite Architecture Underlying Operating System Acquiring NetEye ISO Image Installing ISO Image Single Nodes and Satellites Cluster Nodes Configuration of Tenants Satellite Nodes Only Nodes behind a Proxy Additional NetEye Components Single Node Cluster Node Satellites Nodes only Verify if a module is running correctly Accessing the New Module Cluster Satellite Security Backup and Restore Identity and Access Management External Identity Providers Configure federated LDAP/AD Emergency Reset of Keycloak Configuration Advanced Configuration Roles Single Page Application in NetEye Module Permissions and Single Sign On Within NetEye Importing User Federation Groups inside another Group Importing OIDC IdP Groups inside another Group Resources Tuning Advanced Topics Basic Concepts & Usage Advanced Topics Monitoring Environment Templates Monitored Objects Import Monitored Objects Data Fields Deployment Icinga 2 Agents Configuration Baskets Dashboard Monitoring Status Icinga2 Features VMD Permissions Notifications Jobs API Configuring Icinga Monitoring Retention Policy NetEye Self Monitoring Concepts Collecting Events Add a Filter Node WHERE Conditions Iterating over Event fields Retrieving Payload of an Event Extract Variables Create a Rule Tornado Actions Test your Configuration Export and Import Configuration Example Under the hood Development Retry Strategy Configuration Thread Pool Configuration API Reference Configure a new Business Process Create your first Business Process Node Importing Processes Operators The ITOA Module Configuring User Permissions Telegraf Metrics in NetEye Telegraf Configuration Telegraf on Monitored Hosts Visualizing Dashboards Customizing Grafana The NetEye Geo Map Visualizer Map Viewer Configuring Geo Maps NagVis Audit Log Overview Shutdown Manager user Shutdown Manager GUI Shutdown Commands Advanced Topics Overview User Role Management Cube Use Cases ntopng and NetEye Integration Permissions Retention Advanced Topics Overview User Roles Nodes RDP Client Building Tools Editor: Interface Overview Editor: Script Building Editor: Managing Scripts Designer: Interface Overview Designer: Interface Options Designer: Component Tree Selector: Interface Overview Test Case Management Dashboard Use Cases Overview Architecture Authorization Kibana Elasticsearch Cluster Elasticsearch Configuration Replicas on a Single Node Elasticsearch Performance tuning Overview Enabling El Proxy Sending custom logs to El Proxy Configuration files Commands Elasticsearch Templates and Retentions El Proxy DLQ Blockchain Verification Handling Blockchain Corruptions El Proxy Metrics El Proxy Security El Proxy REST Endpoints Agents Logstash Elastic APM Elastic RUM Elastic XDR Log Manager - Deprecated Overview Authorization in the Command Orchestrator Module Configuring CLI Commands Executing Commands Overview Permissions Installation Single Tenancy Multitenancy Communication through a Satellite Asset collection methods Display asset information in monitoring host page Overview Customers Availability Event Adjustment Outages Resource Advanced Topics Introduction The Intelligence We Produce Mitre Attack Coverage Getting Started Settings SATAYO Items Intelligence Requirements Managed Service Request Form FAQ Changelog SATAYO Community NetEye.Cloud as a SaaS solution Accessing NetEye.Cloud Monitoring with NetEye.Cloud Monitoring Environment Business Service Monitoring VMD SOC System Administrator (AdS) Access to NetEye and Elastic Elastic Dashboards Elastic Discover Elastic Alerts Elastic Rules Introduction to SOC Attacker Centric Service Description NetEye SIEM About SATAYO Threat Intelligence and Security Operations Before you start Update Procedure Single Node Upgrade from 4.46 to 4.47 Cluster Upgrade from 4.46 to 4.47 Satellite Upgrade from 4.46 to 4.47 DPO machine Upgrade from 4.46 to 4.47 Create a mirror of the RPM repository Sprint Releases Feature Troubleshooting Backup and Restore Tornado Networking Service Management - Incident Response IT Operation Analytics - Telemetry Identity Provider (IdP) Configuration NetEye Cluster on Microsoft Azure Introduction to NEP Getting Started with NEPs Online Resources Obtaining NEP Insights Available Packages Advanced Topics Upgrade to NetEye 4.31 Setup Configure swappiness Restarting Stopped Services Enable stack traces in web UI How to access standard logs Director does not deploy when services assigned to a host have the same name How to enable/disable debug logging Activate Debug Logging for Tornado Modules/Services do not start Sync Rule fails when trying to recreate Icinga object How to disable InfluxDB query logging Managing an Elasticsearch Cluster with a Full Disk Some logs are not indexed in Elasticsearch Elasticsearch is not functioning properly Reporting: Error when opening a report Debugging Logstash file input filter Bugfix Policy Reporting Vulnerabilities Glossary

Intelligence Requirements

General info

As mentioned in the getting started page, Intelligence Requirements phase document outlines the specific needs and criteria for intelligence gathering and analysis within an organization. It serves as a foundational guide for intelligence operations, ensuring that all activities align with the strategic objectives and priorities of the organization. In the context of SATAYO platform, it assists in defining the scope and focus of intelligence efforts, enabling more effective decision-making and resource allocation.

The first step in collecting the Requirements is to identify the what can be considered relevant for routines performed by SATAYO and its related workflow.

Gathering the Requirements

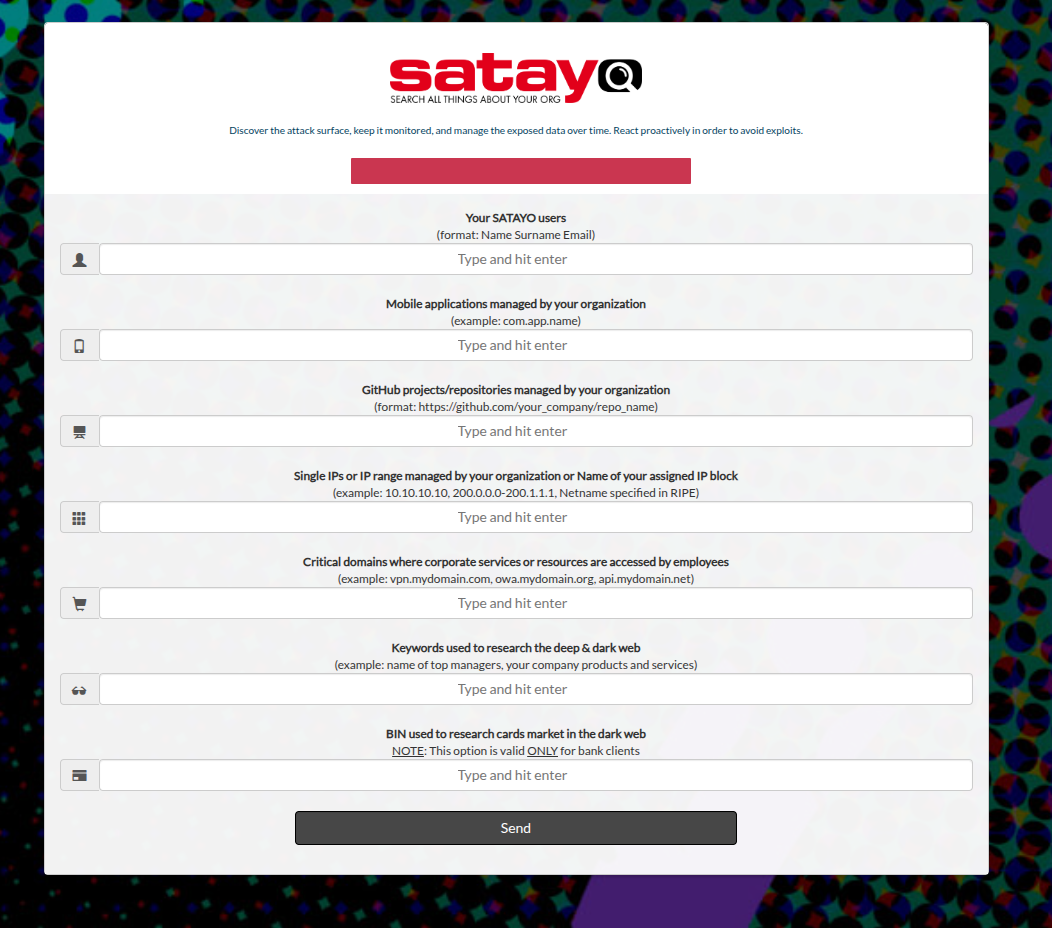
For better achieving this phase, we defined an introctive questionaire that could be used as a reference during the onboarding phase. The form could be compiled together with the analyst who will conduct the onboarding phase, or it could be filled independently by the organization.

The following are the items that the organization is required to provide:

  • Name, surname, and email address of people who need to access the platform

  • Mobile applications published on different stores for products and services managed by the organization

  • Repositories hosted on GitHub for projects managed by the organization

  • IP addresses and IP blocks managed directly

  • Exposed resources and assets considered critical

  • List of keywords useful for identifying products and services managed by the organization

  • BIN (Bank Identification Number) for credit cards issued by the organization (if operating in the banking/financial sector)

  • List of technologies that are considered a priority for the management of Early Warning on the same

../../../_images/form.png

SATAYO also provides multiple sections for autonomous configuration of some monitoring elements, such as keywords, domains, and social media accounts.

Configuring VIP accounts

The email section allows you to define VIP accounts that require special monitoring attention. These accounts may belong to high-profile individuals within the organization, such as executives or key personnel, whose online presence and activities could be of particular interest for security monitoring. Also it lets you specify unused email addresses realed to disabled or deprected users or mailboxes.

../../../_images/mail.png

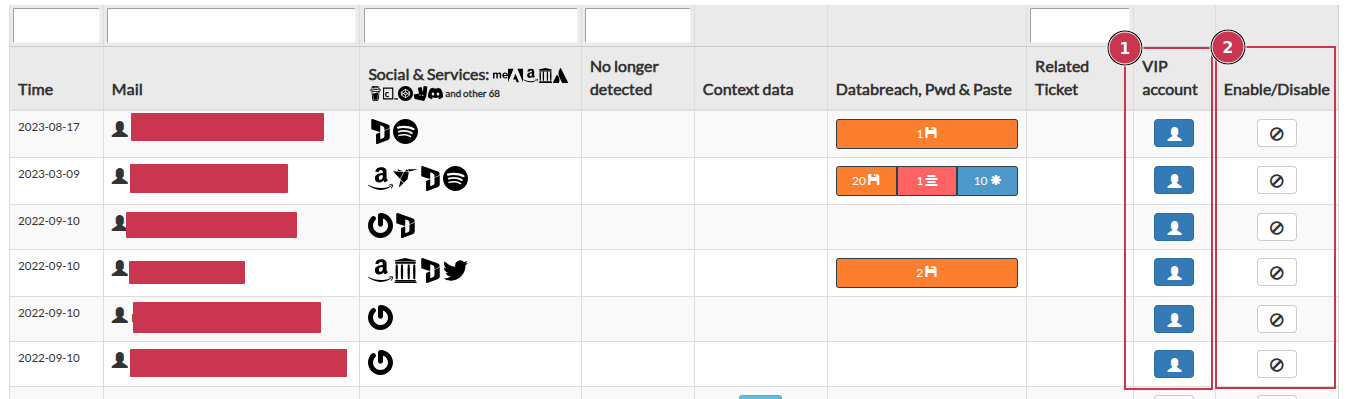
Navigate to the “Email” section in the SATAYO platform. There you could find the list of monitored email addresses.

    1. Button let you define if an email belong to a VIP account.

    1. Button let you specify unused email addresses related to disabled or deprecated users or mailboxes.

Note

SATAYO let you import also a list of personal email addresses that could be related to employees of the organization. A ticket can be opened using the request form to ask for the addition of other email addresses. More information about this feature could be found in the section Email Monitoring.

Define keywords and identity for Ransomware Monitor

The Ransomware Monitor section allows you to define keywords and identity information that will be monitored for potential threats related to ransomware activities. By specifying relevant keywords and identity details, the organization can enhance its ability to detect and respond to ransomware threats in a timely manner.

This section allows the input of keywords commonly used in ransomware-related communications, as well as identity-related information that may be targeted by ransomware actors. It helps tailor the monitoring process to the organization’s specific context.

The purpose of this section is to enhance the organization’s ability to detect and respond to ransomware threats by focusing on relevant keywords and identity information, while also identifying any incidents that could potentially lead to a supply chain attack.

../../../_images/drm.png

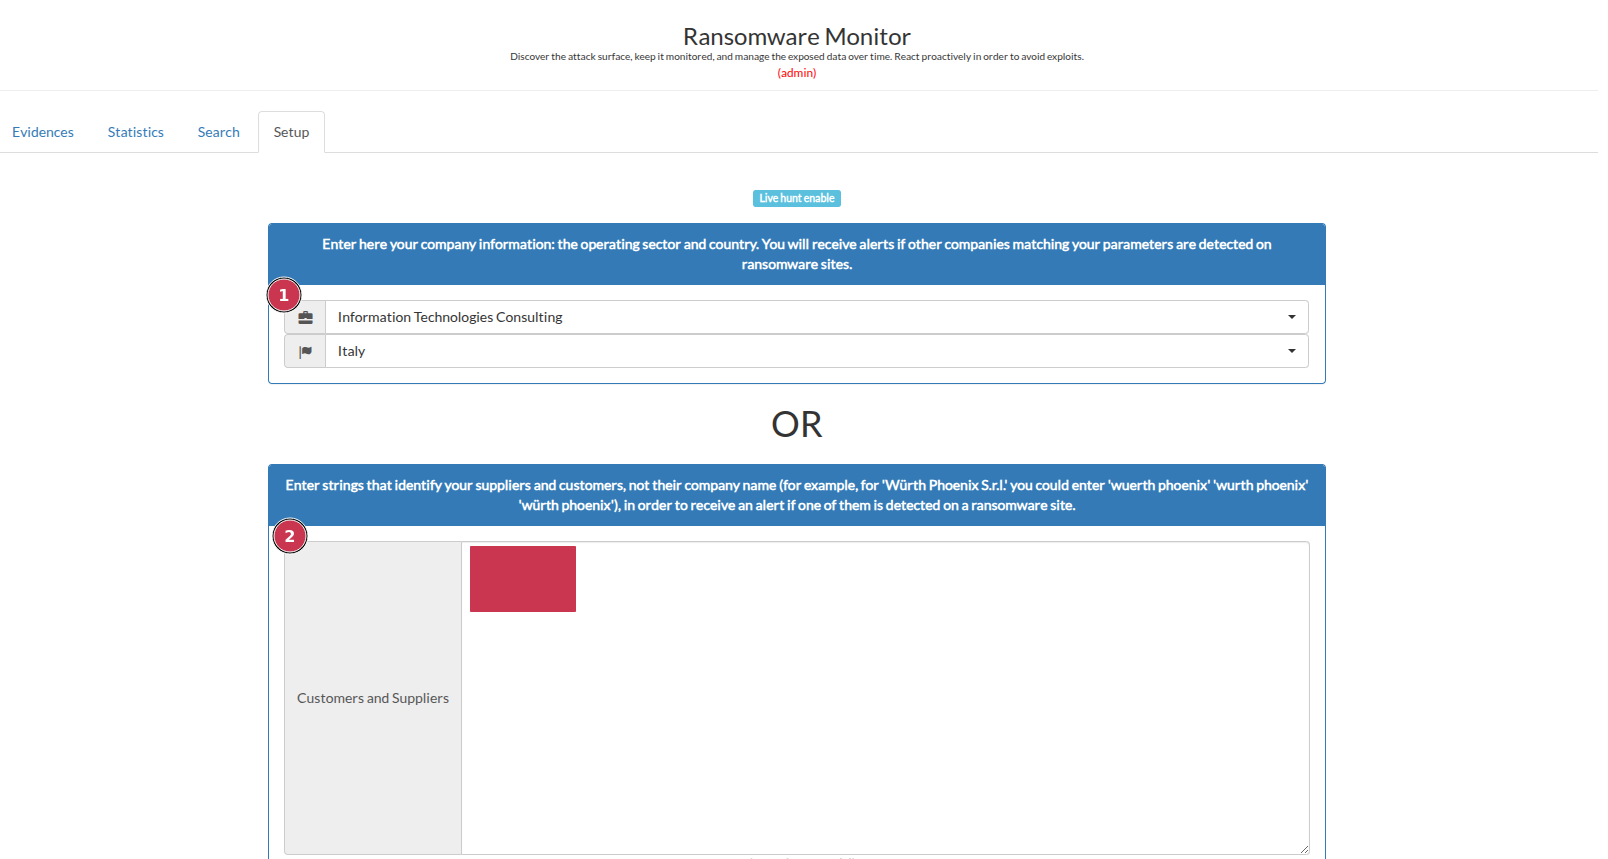
    1. Define keywords and geographic areas that could be relevant for monitoring.

    1. Specify keywords that could be relevant for monitoring ransomware-related activities and incidents (When setting keywords, consider the ransomware gangs’ modus operandi when publishing the names of victim organizations. The exact name of the victim company is unlikely to be published (for example, $Company_Name GMBH is unlikely to be published, but $Company_Name is more likely).

Import and configure legitimated favicon icon

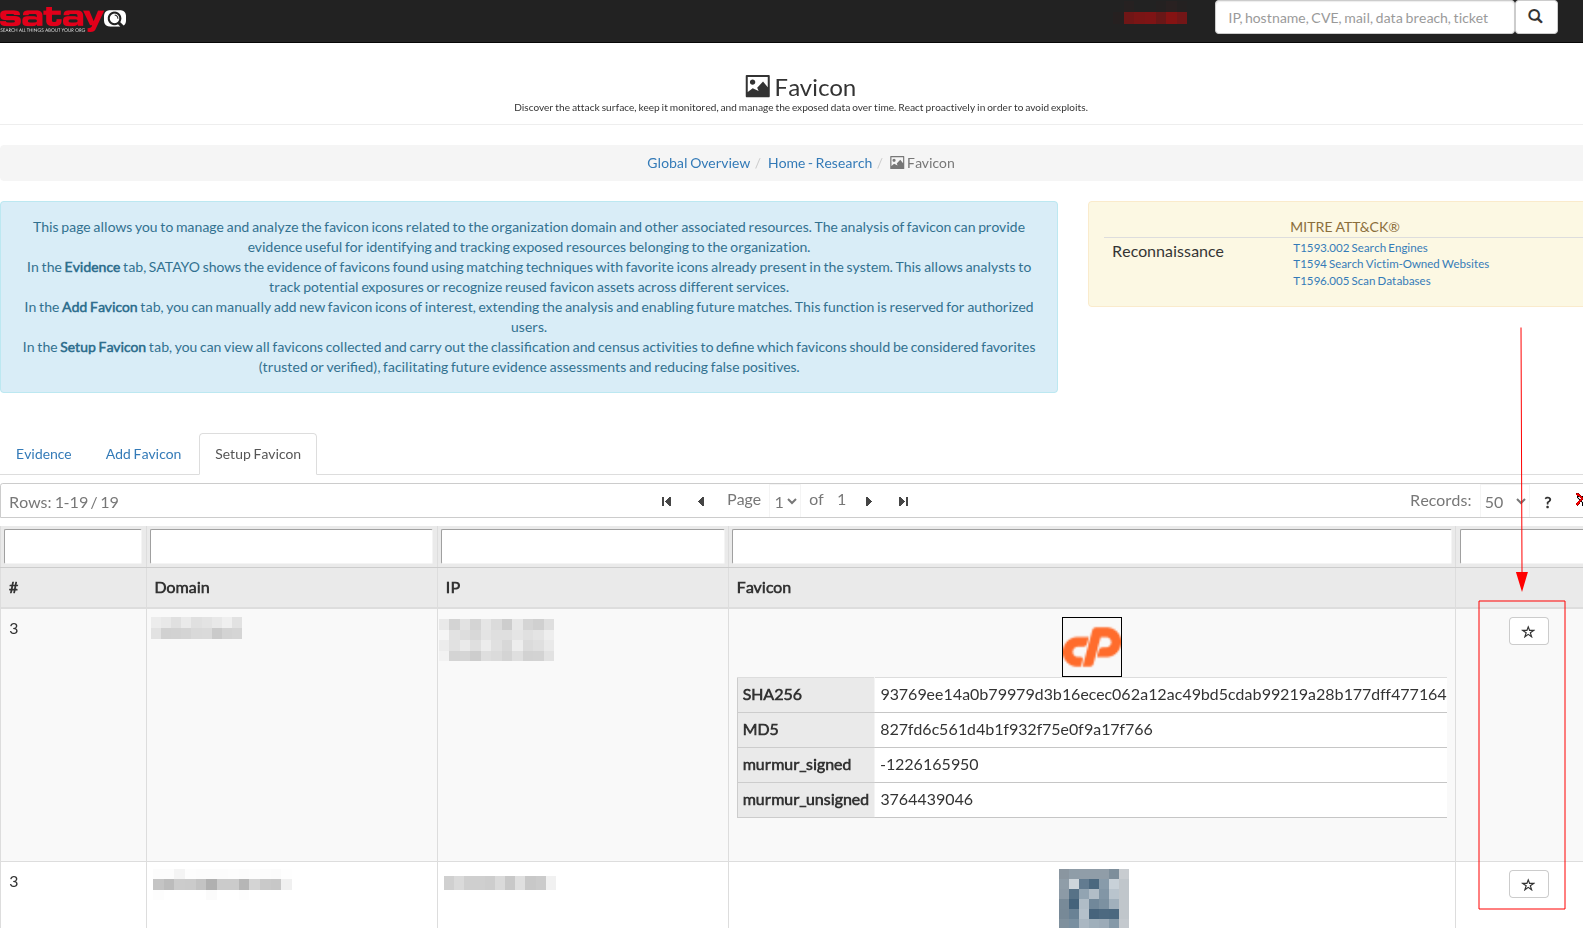
As described in the Favicon Items section, SATAYO platform allows you to import and configure legitimated favicon icons that are associated with the organization’s online presence. By defining these icons, the organization can enhance its monitoring capabilities and improve the accuracy of threat detection related to its digital assets.

The favicon section allows you to upload and manage a list of favicon icons that are considered legitimate for the organization. In the first page you can set a legitimate URL, SATAYO will automatically fetch the related favicon icon and it will calculate its hash value for future monitoring activities.

../../../_images/favicon-add01.png

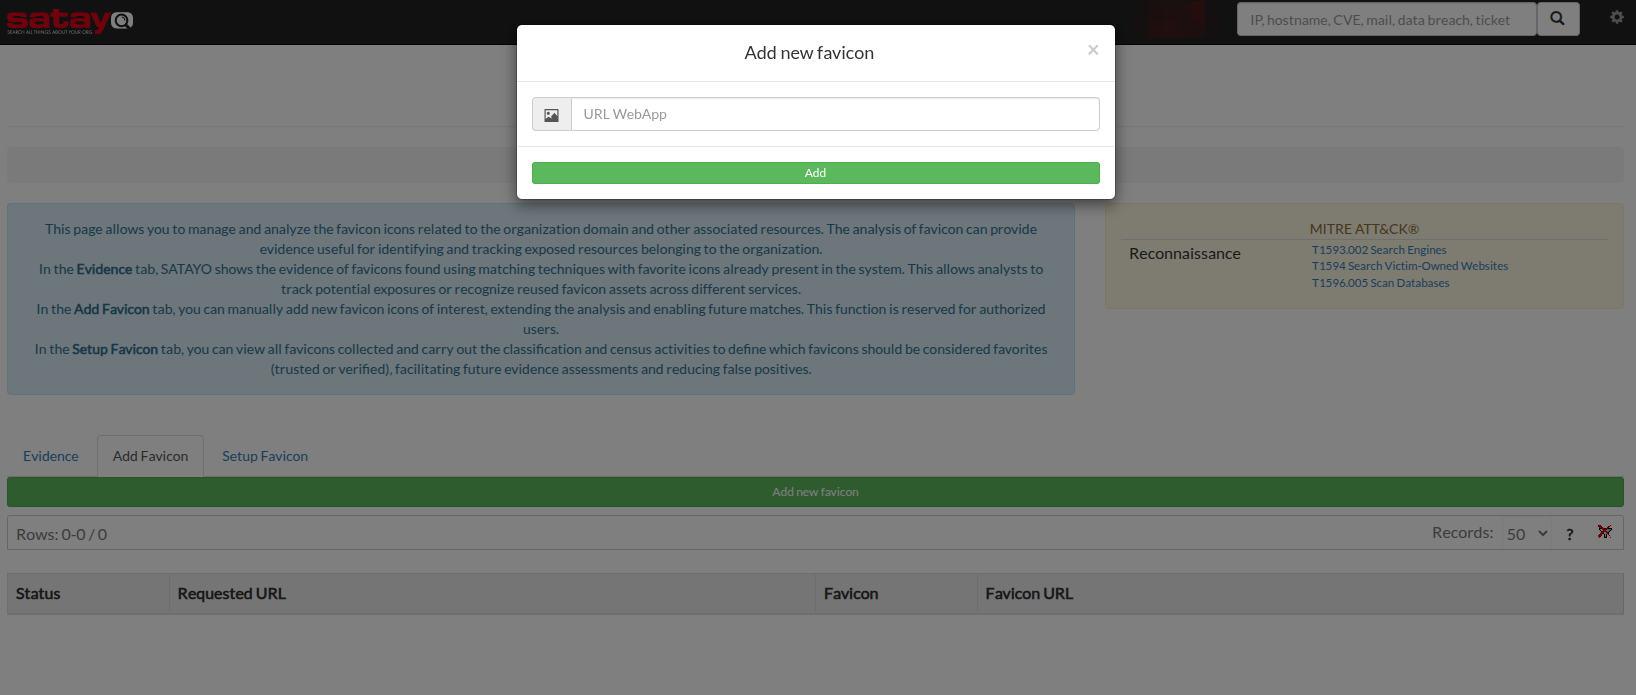
Starting from the monitored URL, SATAYO will periodically check for any new favicons associated with the domain. If a new favicon is detected, it will reevaluate its hash value and it will store the new icon in the platform database. After that, the new favicon will presented to our CTI team for validation and eventual inclusion in the list of legitimated icons. You can directly force the addition of a new favicon by clicking on the “Star” button.

../../../_images/favicon-add02.png

Note

During the recoursive meeting with the organization, the analyst will review the form and discuss with the organization the answers provided, in order to clarify any doubts and ensure that all relevant aspects are covered.

It is essential to have a clear understanding of the organization’s needs and priorities to tailor the intelligence gathering process effectively, but using JIRA platform as a communication channel and periodic meetings, the analyst could refine the requirements over time, adapting to any changes in the organization’s context or objectives.

In the event of any change or update, the organization can align its requirements by opening a JIRA ticket and specifying SATAYO information request as a section. The CTI team will review and validate the request and, if permitted under the current license, the perimeter will be updated accordingly.