Cluster Upgrade from 4.46 to 4.47
This guide will lead you through the steps specific for upgrading a NetEye Cluster installation from version 4.46 to 4.47.
Granted the environment connectivity is seamless, the upgrade procedure may take up to 30 minutes per node.
Warning
Remember that you must upgrade sequentially without skipping versions, therefore an upgrade to 4.47 is possible only from 4.46; for example, if you have version 4.27, you must first upgrade to the 4.28, then 4.29, and so on.
Breaking Changes
Geomap migration to IcingaDB
Starting with the next release, the Geomap module is being migrated from the IDO database to IcingaDB. As part of this migration, some IDO fields previously available in the Map fields section of the Maps Configurator will be deprecated and will no longer have corresponding fields in IcingaDB. As a result, if a map was configured to display any of these deprecated fields, they will no longer be visible after the upgrade. It is recommended to update map configurations in order to use other available fields in IcingaDB.
List of removed IDO fields:
Host Active Checks Enabled Changed
Host Alias
Host Contact
Host Current Notification Number
Host Event Handler Enabled Changed
Host Flap Detection Enabled Changed
Host Last Notification
Host Modified Host Attributes
Host Notifications Enabled Changed
Host Obsessing
Host Obsessing Changed
Host Passive Checks Enabled Changed
Host Percent State Change
Instance Name
Moreover, all the fields related to services and service groups will not be selectable anymore in the Map fields section of the Maps Configurator.
Elastic Stack upgrade to 9.3.3
In NetEye 4.47, Elastic Stack upgrades from version 9.2.6 to 9.3.3. To ensure compatibility, review the official breaking changes linked below:
Prerequisites
Before starting the upgrade, carefully read the latest release notes on NetEye’s blog and check the features that will change or be deprecated.
All NetEye packages installed on a currently running version must be updated according to the update procedure prior to running the upgrade.
NetEye must be up and running in a healthy state.
Disk Space required:
3GB for
/and/var150MB for
/boot
If the NetEye Elastic Stack module is installed:
The rubygems.org domain should be reachable by the NetEye Master only during the update/upgrade procedure. This domain is needed to update additional Logstash plugins and thus is required only if you manually installed any Logstash plugin that is not present by default.
There is a number of configuration items that should not be modified in order to avoid issues during the update/upgrade of your instance. Please check out Protected Configuration Items for details.
1. Run the Upgrade
The Cluster Upgrade is carried out by running the following command:
cluster# (nohup neteye upgrade &) && tail --retry -f nohup.out
Warning
If the NetEye Elastic Stack feature module is installed and a new version of Elasticsearch is available, please note that the procedure may take a while to upgrade the Elasticsearch cluster. For more information on the Elasticsearch cluster upgrade and how to customize the upgrade process, please consult the dedicated section.
After the command was executed, the output will inform if the upgrade was successful or not:
In case of successful upgrade you might need to restart the nodes to properly apply the upgrades. If the reboot is not needed, please skip the next step.
In case the command fails refer to the troubleshooting section.
2. Reboot Nodes
Restart each node, one at a time, to apply the upgrades correctly.
Run the reboot command
cluster-node-N# neteye node reboot
In case of a standard NetEye node, put it back online once the reboot is finished
cluster-node-N# pcs node unstandby --wait=300
You can now reboot the next node.
3. Cluster Reactivation
At this point you can proceed to restore the cluster to high availability operation.
Run the checks in the section Checking that the Cluster Status is Normal. If any of the above checks fail, please contact our service and support team before proceeding.
Re-enable fencing on the last standard node, if it was enabled prior to the upgrade:
cluster# pcs property set stonith-enabled=true
4. Additional Tasks
After upgrading to NetEye 4.47, you should complete the following additional tasks to fully benefit from the new features and improvements.
IcingaDB Historical Data migration
With the introduction of IcingaDB as the new backend for monitoring, the historical monitoring events must be migrated from the legacy Icinga2 IDO database to IcingaDB. This ensures that all past events are preserved in IcingaDB and hence accessible via the modules relying on IcingaDB, maintaining continuity in monitoring data.
This migration can be performed any time after upgrading to NetEye 4.47, and it is a mandatory requirement before upgrading to NetEye 4.48.
The migration is performed using the neteye cluster upgrade-prerequisites ido-migration command.
Important considerations before starting
Before starting the migration, please consider the following:
Time: The migration process can take a long time to complete, depending on the amount of data to migrate and the performance of the database. It could take from a few hours to several days. Plan the migration activity in advance.
Disk space: The migration requires significant disk space to store the migrated data in IcingaDB. Always check the available disk space before starting by using the
--check-disk-spaceoption.Chunk-based approach: We strongly recommend migrating data in chunks (e.g., 3 months at a time) rather than migrating all data at once. This allows you to:
Monitor the disk space consumption progressively
Reduce the impact on database performance
Recover more easily in case of issues
Selective migration: You don’t have to migrate all historical data. You can choose to migrate only the data from a specific date onwards using the
--fromparameter. Consider which timeframe is relevant for your needs:SLA data: Usually you want to migrate more SLA data since it is used for SLM reporting.
History data: You may choose to migrate less history data (e.g., 2-3 months) since older host/service history events are typically less relevant.
Types of data to migrate
There are two types of historical data that must be migrated:
SLA data: Required for SLM (Service Level Management) reporting.
History data: Used in the history pages of single hosts and services.
Both types of data must be migrated independently using the dedicated subcommands, and you can choose different timeframes for each type based on your reporting needs.
Important
Do not run SLA and History migrations in parallel. Complete the SLA migration first, then start the History migration.
Migration procedure
To perform the migration, follow these steps:
Check available disk space
Before starting the migration, verify that there is enough disk space available:
neteye cluster upgrade-prerequisites ido-migration sla start --from <YYYY-MM-DD> --check-disk-space
neteye cluster upgrade-prerequisites ido-migration history start --from <YYYY-MM-DD> --check-disk-space
This command performs only the disk space check without starting the migration. If the check fails, increase the available disk space before proceeding.
Start the SLA data migration (in chunks)
We recommend migrating data in chunks of approximately 3 months. Start from the most recent data and then proceed backwards in time. For example, if it is early 2026 and you want to migrate SLA data starting from January 1, 2025 you can decide to migrate in the following chunks:
neteye cluster upgrade-prerequisites ido-migration sla start --from 2025-09-01
Wait for this chunk to complete, verify disk space, then continue with the next chunk:
neteye cluster upgrade-prerequisites ido-migration sla start --from 2025-06-01
Repeat until you have migrated all the SLA data you need.
Start the History data migration (in chunks)
Apply the same chunk-based approach for history data. You may choose a more recent start date if older history data is not needed:
neteye cluster upgrade-prerequisites ido-migration history start --from 2026-01-01
Monitor the migration progress
You can monitor the migration progress using the following commands:
To view the logs:
neteye cluster upgrade-prerequisites ido-migration sla logs
neteye cluster upgrade-prerequisites ido-migration history logs
To check the status:
neteye cluster upgrade-prerequisites ido-migration sla status
neteye cluster upgrade-prerequisites ido-migration history status
The status command shows the state of each migration run. Possible states are:
running: The migration is still in progress.
completed: The migration has been completed successfully.
stopped: The migration has been stopped by the user.
failed: The migration has failed due to an error.
Wait for both migrations to complete
The migration process runs in a tmux session in the background, so it will continue even if the SSH connection is closed.
Enable the IcingaDB Historical Data feature flag
Once both migrations are completed, enable the “IcingaDB Historical Data” feature flag so that NetEye starts using the migrated data stored in IcingaDB.
To enable the feature flag, navigate in the NetEye web interface to: Configuration > Modules > neteye > Configuration > IcingaDB Historical Data Feature Flag.
Managing the migration process
If you need to stop or resume the migration, use the following commands:
Stop a running migration:
neteye cluster upgrade-prerequisites ido-migration sla stop
neteye cluster upgrade-prerequisites ido-migration history stop
Resume a stopped or failed migration:
neteye cluster upgrade-prerequisites ido-migration sla resume
neteye cluster upgrade-prerequisites ido-migration history resume
Performance tuning
Depending on the cluster setup and the amount of data to migrate, the migration process could
stress the database. The --bulk parameter helps to find a good compromise between speed and
database load.
The default bulk size (100) is a conservative value that works in most cases, but in some environments it could be too high. We recommend the following approach to find the optimal bulk size for your setup:
Start the migration of a shorter time period (e.g., one month) with the default bulk size:
neteye cluster upgrade-prerequisites ido-migration sla start --from 2026-01-01
Monitor the database status during the migration.
If the database is stressed, stop the migration and restart with a lower bulk size (e.g., 50):
neteye cluster upgrade-prerequisites ido-migration sla stop
neteye cluster upgrade-prerequisites ido-migration sla start --from 2026-01-01 --bulk 50
Once you find a suitable bulk size, proceed with the full migration using the selected value.
Migration of IDO Grafana dashboards
If you have Grafana dashboards that query the legacy Icinga IDO MySQL database, you must migrate them to use the IcingaDB data sources before upgrading to NetEye 4.48. Upgrade prerequisite checks will block the upgrade if any legacy IDO data sources or dashboards are still in use.
Depending on how the IDO database is referenced in your Grafana setup, there are two cases to address.
Case 1: Data sources using the icinga MySQL database
If you created a Grafana data source that connects to the icinga MySQL database, you must:
Create a replacement data source that connects to the
icingadbdatabase instead oficinga.Migrate all dashboards that use the old data source. For each affected dashboard, update the queries to use the new IcingaDB data source and adapt the queries to the IcingaDB database schema. See the example in Example: Migrating a Grafana dashboard to IcingaDB below for a step-by-step walkthrough.
Delete the old data source that connects to the
icingadatabase.
Important
An upgrade prerequisite check for NetEye 4.48 verifies that no Grafana data source exists
that uses the icinga MySQL database. The upgrade will not proceed until all such data
sources have been removed.
Case 2: Tenant-specific IDO data sources
If you have dashboards that use the default Tenant data sources
icinga-<tenant_name>-mysql provided by NetEye, you must migrate those dashboards to the
corresponding IcingaDB Tenant data sources:
Identify the replacement data source: For each Tenant, a new data source
icingadb-<tenant_name>-mysqlis available in the respective Grafana Organization of the Tenant.Migrate all affected dashboards in each Tenant’s Grafana Organization. Update the dashboards to use the
icingadb-<tenant_name>-mysqldata source and adapt the queries to the IcingaDB database schema. See the example in Example: Migrating a Grafana dashboard to IcingaDB below for a step-by-step walkthrough.Delete the old dashboards that still reference
icinga-<tenant_name>-mysql. Once a dashboard has been recreated or updated to use the new data source, remove the old version.
Important
An upgrade prerequisite check for NetEye 4.48 verifies that no dashboard exists that uses
an icinga-<tenant_name>-mysql data source. The upgrade will not proceed until all such
dashboards have been migrated and removed.
Example: Migrating a Grafana dashboard to IcingaDB
The following example walks through migrating a specific Grafana dashboard from the legacy IDO data source to IcingaDB. While your dashboards will certainly differ, the same concepts and approach apply to any dashboard migration: replace the data source, and rewrite the SQL queries to match the IcingaDB schema.
The example focuses on a dashboard that displays the state of Alyvix hosts, which are hosts
with the custom variable alyvix_node set to y_singletenant_direct_to_master.
The dashboard uses two types of SQL queries that need to be migrated:
A template variable query that builds the list of Alyvix hosts by looking up hosts with a specific custom variable. This query populates the host selector dropdown at the top of the dashboard.
A panel query that retrieves the current state (UP/DOWN) for each selected host and displays it in a stat panel.
Both queries must be rewritten to match the IcingaDB schema, as shown in Step 3.
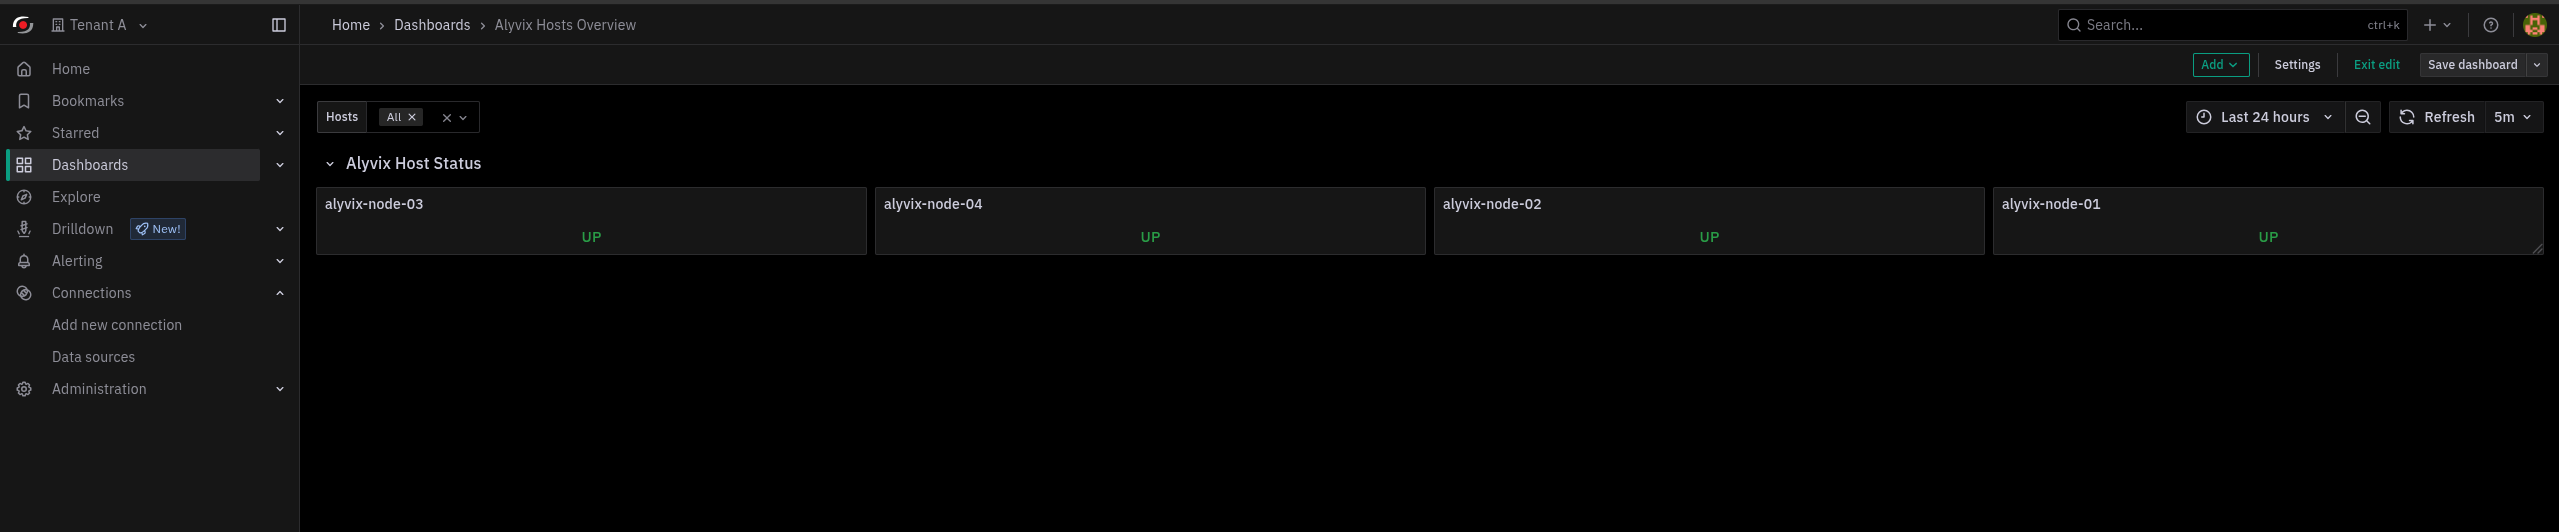
Fig. 231 The Alyvix Hosts Overview dashboard showing the host selector dropdown (template variable) and the host state panels.
Step 1: Create the IcingaDB data source (if it does not exist)
In Grafana, go to Configuration > Data Sources > Add data source.
Select MySQL as the type and set the database to
icingadb. Configure the remaining connection fields (host, user, password) according to your environment.
Step 2: Copy the existing dashboard
Open the existing dashboard that uses the legacy IDO data source.
Go to Edit mode > Save Dashboard > Save as copy to create a copy of the dashboard. Give it a new name (e.g., append
(IcingaDB)).In the copied dashboard, update every panel and template variable to use the new IcingaDB data source created in Step 1.
Step 3: Adapt the SQL queries to the IcingaDB schema
The IcingaDB database uses a different schema than the legacy IDO database. The following examples show how to rewrite each query and explain the key differences.
Migrating template variable queries
The template variable query that retrieves Alyvix host names must be rewritten. The IDO
schema uses icinga_objects and icinga_customvariables, while IcingaDB uses the
host, host_customvar, and customvar_flat tables.
IDO query:
SELECT `name1`
FROM `icinga_objects` O
JOIN `icinga_customvariables` V ON V.object_id = O.object_id
WHERE O.objecttype_id = 1
  AND V.`varname` LIKE 'alyvix_node'
  AND V.varvalue = "y_singletenant_direct_to_master"
  AND O.is_active = 1
IcingaDB equivalent:
SELECT H.`name`
FROM `host` H
JOIN `host_customvar` HC ON HC.`host_id` = H.`id`
JOIN `customvar_flat` CV ON CV.`customvar_id` = HC.`customvar_id`
WHERE CV.`flatname` = 'alyvix_node'
  AND CV.`flatvalue` = 'y_singletenant_direct_to_master'
Key changes:
icinga_objectsis replaced by thehosttable (IcingaDB stores hosts directly, there is no centralized objects table).icinga_customvariablesis split intohost_customvar(linking hosts to custom variables) andcustomvar_flat(storing flattened variable names and values).The
objecttype_id = 1andis_active = 1filters are no longer needed because thehosttable only contains active host objects.
Migrating panel queries
The panel query that retrieves the current host state must also be rewritten. The IDO
schema uses icinga_hoststatus and icinga_hosts, while IcingaDB uses host_state
and host.
IDO query:
SELECT `current_state`
FROM `icinga_hoststatus` S
JOIN `icinga_hosts` H ON H.`host_object_id` = S.`host_object_id`
WHERE `display_name` LIKE CONCAT($host, '%')
IcingaDB equivalent:
SELECT S.`hard_state` AS `current_state`
FROM `host_state` S
JOIN `host` H ON H.`id` = S.`host_id`
WHERE H.`display_name` LIKE CONCAT($host, '%')
Key changes:
icinga_hoststatusis replaced byhost_state.icinga_hostsis replaced byhost.current_stateis replaced byhard_state(orsoft_stateif you want the current soft state). The values remain the same:0= UP,1= DOWN.The join key changes from
host_object_idtohost_id/id.
Step 4: Verify and clean up
Verify that the migrated dashboard displays the correct data by comparing it with the original dashboard.
Once you have confirmed that the new dashboard works correctly, delete the old dashboard that uses the legacy IDO data source.
If no other dashboards reference the old IDO data source, delete the old data source as well.
Tip
The following table summarizes the most common IDO-to-IcingaDB table mappings useful when migrating dashboard queries:
IDO Table |
IcingaDB Table |
|---|---|
|
|
|
|
|
|
|
|
|
|
|
|