User Guide Functional Overview Requirements Architecture System Installation NetEye Additional Components Installation Setup The neteye Command Director NetEye Self Monitoring Tornado Business Service Monitoring IT Operation Analytics - Telemetry Geo Maps NagVis Audit Log Shutdown Manager Reporting ntopng Visual Monitoring with Alyvix Elastic Stack IT Operations (Command Orchestrator) Asset Management Service Level Management Cyber Threat Intelligence - SATAYO NetEye Update & Upgrade How To NetEye Extension Packs Troubleshooting Security Policy Glossary
module icon Cyber Threat Intelligence - SATAYO
Introduction Getting Started SATAYO Items Settings Managed Service Mitre Attack Coverage Changelog
ntopng Visual Monitoring with Alyvix Elastic Stack IT Operations (Command Orchestrator) Asset Management Service Level Management Cyber Threat Intelligence - SATAYO Introduction to NetEye Monitoring Business Service Monitoring IT Operation Analytics Visualization Network Visibility Log Management & Security Orchestrated Datacenter Shutdown Application Performance Monitoring User Experience Service Management Service Level Management & Reporting Requirements for a Node Cluster Requirements and Best Practices NetEye Satellite Requirements TCP and UDP Ports Requirements Additional Software Installation Introduction Single Node Cluster NetEye Master Master-Satellite Architecture Underlying Operating System Acquiring NetEye ISO Image Installing ISO Image Single Nodes and Satellites Cluster Nodes Configuration of Tenants Satellite Nodes Only Nodes behind a Proxy Additional NetEye Components Single Node Cluster Node Satellites Nodes only Verify if a module is running correctly Accessing the New Module Cluster Satellite Security Identity and Access Management External Identity Providers Configure federated LDAP/AD Emergency Reset of Keycloak Configuration Advanced Configuration Authorization Resources Tuning Advanced Topics Basic Concepts & Usage Advanced Topics Monitoring Environment Templates Monitored Objects Import Monitored Objects Data Fields Deployment Icinga 2 Agents Configuration Baskets Dashboard Monitoring Status VMD Permissions Notifications Jobs API Configuring Icinga Monitoring Retention Policy NetEye Self Monitoring 3b Concepts Collecting Events Add a Filter Node WHERE Conditions Iterating over Event fields Retrieving Payload of an Event Extract Variables Create a Rule Tornado Actions Test your Configuration Export and Import Configuration Example Under the hood Development Retry Strategy Configuration Thread Pool Configuration API Reference Configure a new Business Process Create your first Business Process Node Importing Processes Operators The ITOA Module Configuring User Permissions Telegraf Metrics in NetEye Telegraf Configuration Telegraf on Monitored Hosts Visualizing Dashboards Customizing Performance Graph The NetEye Geo Map Visualizer Map Viewer Configuring Geo Maps NagVis 3b Audit Log 3b Overview Shutdown Manager user Shutdown Manager GUI Shutdown Commands Advanced Topics Overview User Role Management Cube Use Cases ntopng and NetEye Integration Permissions Retention Advanced Topics Overview User Roles Nodes Test Cases Dashboard Use Cases Overview Architecture Authorization Elasticsearch Overview Enabling El Proxy Sending custom logs to El Proxy Configuration files Commands Elasticsearch Templates and Retentions El Proxy DLQ Blockchain Verification Handling Blockchain Corruptions El Proxy Metrics El Proxy Security El Proxy REST Endpoints Agents Logstash Elastic APM Elastic RUM Log Manager - Deprecated Overview Authorization in the Command Orchestrator Module Configuring CLI Commands Executing Commands Overview Permissions Installation Single Tenancy Multitenancy Communication through a Satellite Asset collection methods Display asset information in monitoring host page Overview Customers Availability Event Adjustment Outages Resource Advanced Topics Introduction Getting Started SATAYO Items Settings Managed Service Mitre Attack Coverage Changelog Before you start Update Procedure Single Node Upgrade from 4.41 to 4.42 Cluster Upgrade from 4.41 to 4.42 Satellite Upgrade from 4.41 to 4.42 DPO machine Upgrade from 4.41 to 4.42 Create a mirror of the RPM repository Sprint Releases Feature Troubleshooting Tornado Networking Service Management - Incident Response IT Operation Analytics - Telemetry Identity Provider (IdP) Configuration Introduction to NEP Getting Started with NEPs Online Resources Obtaining NEP Insights Available Packages Advanced Topics Upgrade to NetEye 4.31 Setup Configure swappiness Restarting Stopped Services Enable stack traces in web UI How to access standard logs Director does not deploy when services assigned to a host have the same name How to enable/disable debug logging Activate Debug Logging for Tornado Modules/Services do not start Sync Rule fails when trying to recreate Icinga object How to disable InfluxDB query logging Managing an Elasticsearch Cluster with a Full Disk Some logs are not indexed in Elasticsearch Elasticsearch is not functioning properly Reporting: Error when opening a report Debugging Logstash file input filter Bugfix Policy Reporting Vulnerabilities Glossary 3b

Settings

This page will explore the content of the Settings.

../../../_images/settings.png

You can access the settings from the top right corner.


User information

Clicking on the email address takes you to the user information page.

From here you can:

  • Change your name or password

  • Activate the 2FA [RECOMMENDED]

  • Enable notifications for new findings, either via email or the SATAYO Telegram bot


Changelog

This page shows the changes made during the development of SATAYO. Each version is listed with the release date and the features that were added.
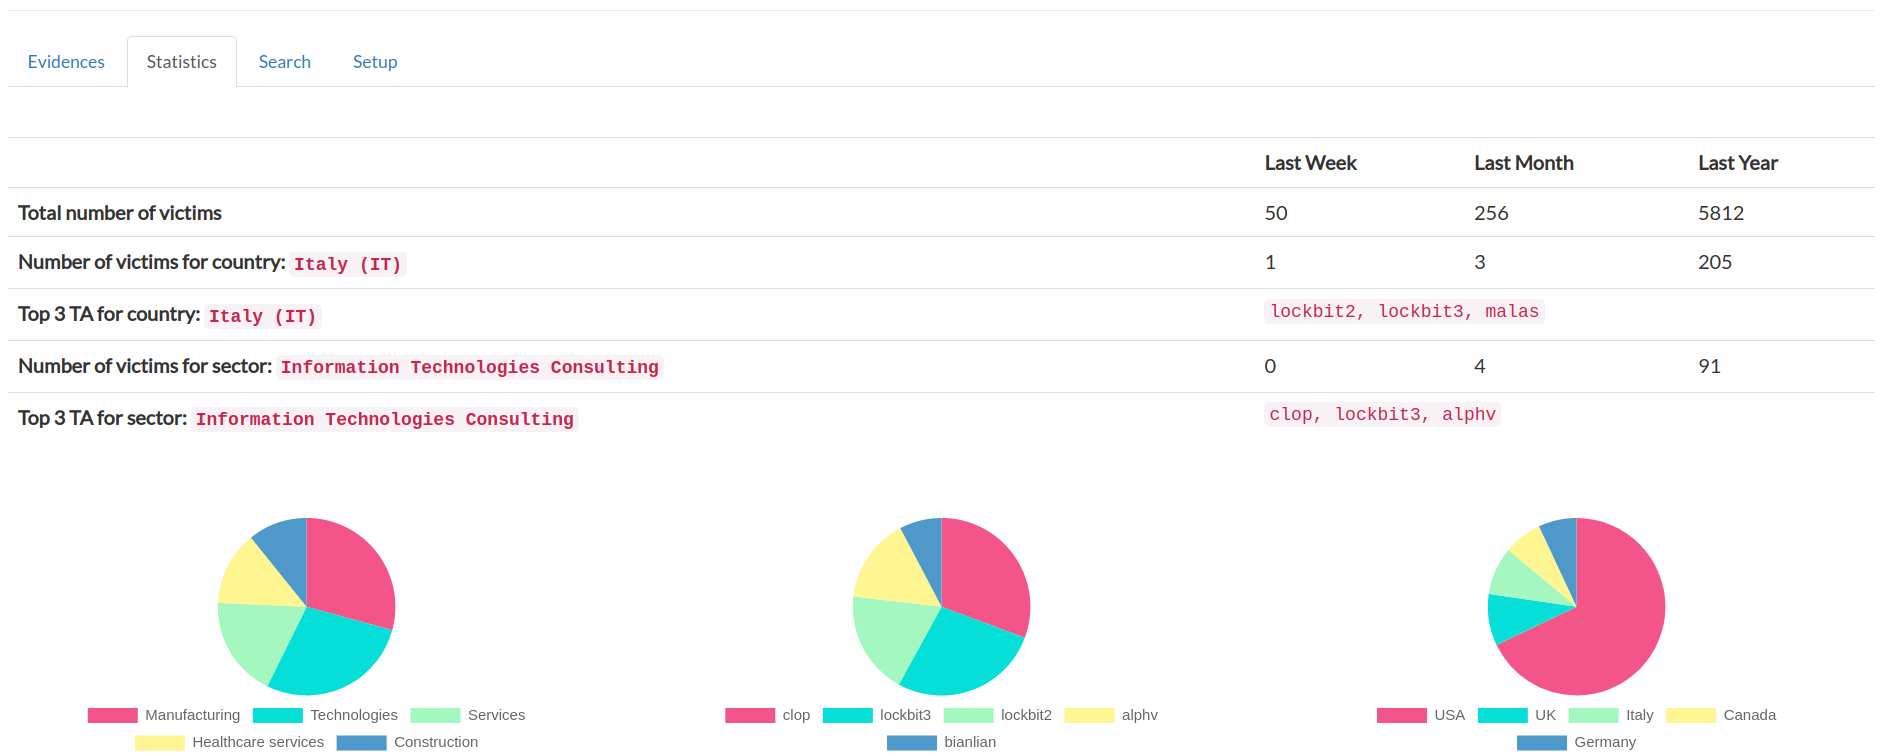


Ransomware Monitor

This page shows information about ransomware attacks carried out worldwide. Data are retrieved from the Dashboard Ransomware Monitor project, available here. It is possible to setup custom alerts and receive notifications when a company operating in the same sector and country has been attacked. There is also the option to enter the list of customers and suppliers and be notified if one of them is the victim of a ransomware attack.

../../../_images/ransomwareMonitor.png


Security News

This page contains Cyber Security news published by various authoritative sources. If anyone is interested, a link to the original article is provided.


Status Managed

This page is only available to customers with the SaaS & Managed version of SATAYO. It shows information about tickets and their status. Opened and resolved tickets can be easily tracked, as well as the evidence to which they relate. Severity statistics are reported for open tickets. More details can be found in the section Managed Service.


Indicators

This page is only available to customers with the SaaS & Managed version of SATAYO. It shows the list of indicators that were added to opened tickets. Indicators are IoC and IoA detected during the analysis. Detailed information on the type of indicators collected are available in the paragraph Tickets in Jira.


SATAYO - User Guide

This button opens the guide you are reading right now. Hope you found what you were looking for :D


License

This page contains some useful information, such as the contract expiration date and the amount of credit used for the acquisition of market evidences. Furthermore, the number of assets taken into consideration for the quotation of the service is indicated.


Support

This page contains links to our support channels. Here you can check whether your account can open tickets in Jira, as explained in Tickets in SATAYO.