Overview
El Proxy (also called Elastic Blockchain Proxy) allows a secure live signature of log streams from Logstash to Elasticsearch.
It provides protection against data tampering by transforming an input stream of plain logs into a secured blockchain where each log is cryptographically signed.
Warning
NetEye administrators have unrestricted control over El Proxy logs stored on Elasticsearch and over the acknowledgement indices (see Acknowledging Blockchain Corruptions). Therefore, we strongly suggest following the Principle of Least Privilege, investing the appropriate time and effort to ensure that the people on NetEye have the right roles and the minimum permissions.
The log management process involving El Proxy is carried out in three stages:
Logstash sends logs collected from various sources to El Proxy using the
json_batchformat of Elastic’s http-output plugin.Note
Due to the fact that the El Proxy does not provide persistence, Logstash should always be configured to take care of the persistence of the involved logs pipelines.
El Proxy receives batches of logs from Logstash, signs every log with a cryptographic key used only once, and, finally, forwards the signed logs to the Elasticsearch Bulk API.
Elasticsearch, which receives signed logs from El Proxy, persists them on the dedicated data stream.
With respect to the GDPR conventions applying to the controllers of processing operations, using El Proxy grants inalterability and integrity of the logs in NetEye.
Using El Proxy as a component of the NetEye log management process is optional. In the case of not enabling El Proxy, all logs will be directly sent from Logstash to Elasticsearch.
However, logs which are not signed by El Proxy can not be guaranteed to be unaltered in the future.
How the El Proxy works
El Proxy uses a set of Signature Keys to sign the incoming logs and then sends them to Elasticsearch. Each log file is signed with a different Signature Key (seeded from the previous Signature Key); the signature includes the hash of the previous log. The logs that for any reason cannot be indexed in Elasticsearch are written in a Dead Letter Queue.
The flowchart depicted in Fig. 154 offers a high-level overview on the process followed by El Proxy to sign a batch of logs. You can notice in particular how El Proxy handles Signature Keys once a batch of logs is written (or not written).
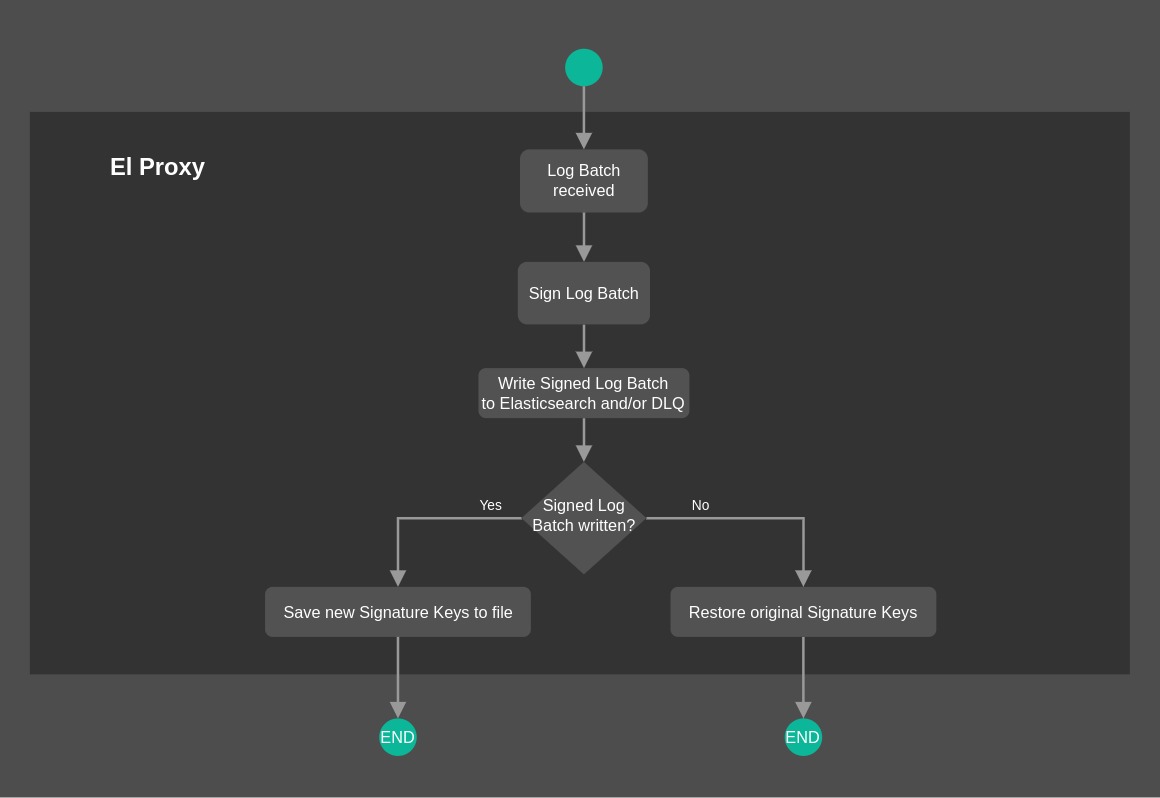
Fig. 154 El Proxy flowchart Overview
Sequential logs processing
An important aspect to bear in mind of is that the log requests for the same blockchain are always processed sequentially by El Proxy. This means that, when a batch of logs is received from Logstash, it is queued in an in-memory queue and it will be processed only when all the previously received requests are completed.
This behavior is required to assure that the blockchain is kept coherent
with no holes in the iteration sequence.
Nevertheless, as no parallel processing is possible for a single blockchain, this puts some hard limits on the maximum throughput reachable.
El Proxy Scenarios
As a running example, let’s imagine sending the following authentication event to El Proxy:
{
  "host": {
    "name": "myhost.wp.lan",
    "ip": "172.17.0.2"
  },
  "event": {
      "category": "authentication"
  }
}
To help you understand how the El Proxy architecture works together with Logstash and Elasticsearch, please have a look at the following scenarios.
In each scenario, the event is sent from Logstash to Elasticsearch through El Proxy.
El Proxy Basic Flow
In our first scenario, no particular error happens during the signing process, so El Proxy signs the event, adds a new block to an existing blockchain, or creates a new chain from scratch if needed, and indexes the resulting document in a dedicated Elasticsearch data stream.
This is the most basic scenario, please refer to How the El Proxy works for additional details.
Signing Events with Logstash down
As in the previous example, El Proxy signs the event, adds it to the blockchain, and indexes it in Elasticsearch.
Logstash, however, goes down before getting notified by El Proxy about the success of the whole signing/adding/indexing operation. Logstash, then, can not acknowledge the correct delivery of the event, even though El Proxy has already successfully indexed the event.
Logstash, in the meanwhile, is restarted successfully and it sends the same event to El Proxy again. El Proxy goes through the signing/adding/indexing operation for a second time, creating a duplicated event in Elasticsearch, but keeping a coherent blockchain.
Signing Events with El Proxy down
In this scenario, El Proxy is down while Logstash is sending events to it and therefore the event cannot be signed, added to the blockchain, and indexed.
In this case, Logstash tries to send the event to El Proxy until succeeding. If also Logstash is restarted before being able to successfully send the event to El Proxy, no event loss is experienced since events are disk persisted. As soon as Logstash is up and running again, it will send the pending event to El Proxy. Differently from scenario 2, this will not cause any event duplication in Elasticsearch.
Elasticsearch failing to index certain logs
In this scenario, Logstash, instead of sending the example event to El Proxy, sends an event with a field that does not match the Elasticsearch mapping definition of the index in which the resulting document will be stored.
In the running example, the host field is mapped as an object (as you can see in the code snipped
reported in the introduction). Logstash, however, has received an event in which the host field
appears as a string:
{
  "host": "myhost.wp.lan",
  "event": {
      "category": "authentication"
  }
}
El Proxy signs the event, adds it to the blockchain, and tries to index it in Elasticsearch.
Elasticsearch, however, refuses to index the document, returning an error to El Proxy.
El Proxy then removes all event fields that are not specified in the configuration file
elastic_blockchain_proxy_fields.toml for being signed and tries to reindex the event again.
At this point we can have different outcomes:
the host field is not included in the signature:
the field is removed from the event, fixing the mapping definition issue, and the resulting document is then successfully indexed
the host field must be included in the signature:
the mapping definition issue still exists, then the event is again rejected by Elasticsearch
the event is then put in the Dead Letter Queue (DLQ) waiting for manual intervention
in case of failure writing the event in the DQL, El Proxy returns an error to Logstash, which tries to send the event again
Please refer to Sending custom logs to El Proxy for additional details.
Communication Errors from Elasticsearch
In this scenario, El Proxy signs the event and adds it to the blockchain. When trying to index the event in Elasticsearch, however, El Proxy gets some communication errors from Elasticsearch. For example, Elasticsearch is temporarily down, or the disk has less than 15% of free space, causing Elasticsearch to refuse to index.
Then, El Proxy retries to index the event with exponential back-off and:
if succeeding before hitting the maximum amount of retries, then the event is indexed
if the maximum amount of retries is hit without indexing, then it writes the event to the DLQ
The number of retries can be defined in the El Proxy configuration. Please refer to Configuration files for additional details.
Failure while writing to DLQ
In this scenario, El Proxy, after failing to index events in Elasticsearch, for some reason also fails to write logs to the DLQ.
For example, the underlying File system has a failure, or El Proxy does not have permissions to write DLQ files.
To guarantee that no events are lost, in this case El Proxy sends an error back to Logstash, which will take care of sending back these events to El Proxy. El Proxy will also reset the key of the blockchain to the iteration that it had in memory before receiving the events since the transaction is considered as failed.
Under this situation the following can happen:
if no logs were indexed during the last request to Elasticsearch, the blockchain will not be corrupted, because the next events will be signed with the keys related to the iterations sequentially after the last log present in Elasticsearch
if some logs were indexed during the last request to Elasticsearch (for example due to some Elasticsearch Internal Server error after which some logs are indexed but the request is failed), then a corruption is inevitably generated in the blockchain.
In this case El Proxy resets its iterations after failing to write to DLQ, which leads to duplicate iterations being generated in Elasticsearch with the next batch of logs sent to El Proxy.
Such corruption needs to be acknowledged by the administrator.
Corruptions upon incorrect shutdown
If El Proxy is not shut down correctly, for example in the case of power loss or with the SIGKILL signal, the used key file might not be updated in time.
If the last log before the shutdown ended up in the DLQ, El Proxy might not have the data necessary to recover the state before the shutdown, overwriting those iterations.
In that case, recovering the logs will result in a corruption of the blockchain, which needs to be acknowledged by the administrator.
El Proxy Verification
In this scenario, we would like to verify the blockchain to ensure that it does not contain any
corruption. To achieve this, we run the elastic_blockchain_proxy verify command.
At the end of its execution, a report about the correctness of the inspected blockchain is provided.
In case of no corruption detected, the verification will complete successfully, otherwise the report will provide a full list of errors detected. If any corruption is reported, you can refer to the Handling Blockchain Corruptions section.
The El Proxy verification should be run on a dedicated DPO machine, external to the NetEye installation and with limited access. The DPO machine is being set up for running verification with neteye dpo setup command. Each individual Docker container on a DPO machine requests data of a particular blockchain from Elasticsearch to perform verification.
In order to notify the users of the verification outcome, results are sent back to the NetEye Monitoring via the Tornado Webhook Collector, which forwards the result to Tornado. The latter then sends a check result to Icinga 2.

Fig. 155 El Proxy Verification
For more information please check out How to Setup the Automatic Verification of Blockchains.
El Proxy Verification: Concurrent processes
The verification process requires some time, mainly to gather the necessary data from Elasticsearch (queries). In fact, the entire blockchain needs to be queried to obtain the fields needed by the verification and this operation is performed in batches to comply with Elasticsearch query limits. Therefore, the number of logs present in the blockchain heavily impacts the time required for the verification: in case of hundred of millions of logs, hours of processing are needed.
Thereby, with the goal of speeding up the process, the verification command can verify more batches concurrently, with the default set to 2, as described in acknowledge-range command at :ref:` <ebp-commands>` section.
Warning
We discourage increasing the default number of concurrent batches, as this may cause a general slow down of Elasticsearch due to overloading.
In order to understand the performance of the verification process on a specific system, the
elastic_blockchain_proxy verify-cpu-bench can be used to verify a
customizable number of sample logs, using a specific number of concurrent processes. This helps in
understanding the hardware performance of our system with respect to the verification process.
Graph Fig. 154 outlines how the increase of concurrent batches during the verification affects the time taken by the process, on a typical system.
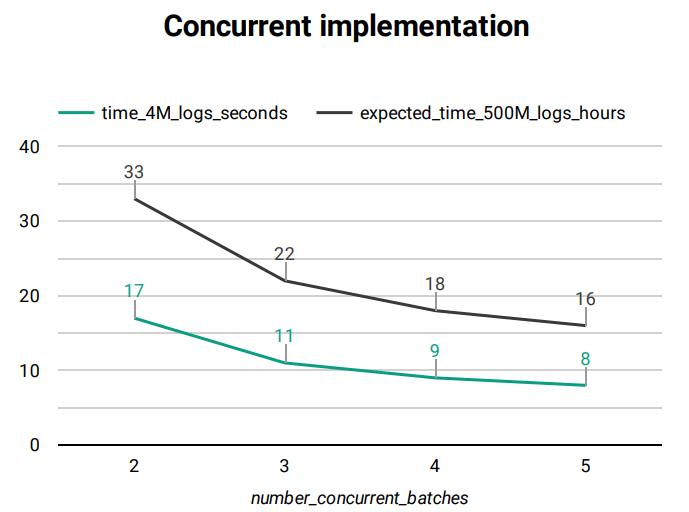
Fig. 156 El Proxy concurrency Graph
time_4M_logs_seconds: number of seconds taken by the verification of about 4 millions of logs
expected_time_500M_logs_hours: projection of the time taken by the verification of about 500 millions logs, in hours