Display asset information in monitoring host page
When asset management module is installed,|NE| will automatically search for the host inside GLPI to fetch its information and display it in the dedicated host detail page in icingaweb2 monitoring. The following guide details different ways to refine the search or force a link to a specific asset.
Note
To enable this feature for a user you need to have the glpi/monitoring-integration permission enabled under the assetmanagement section. To disable the feature when full access is on, the flag under the deny access column for the glpi/monitoring-integration permission must be enabled for any role using assetmanagement (including admin roles).
Note
The GLPI API must be enabled for the feature to work properly.
Search for asset information in GLPI by hostname
The default method to identify the icingaweb2 host in GLPI to then fetch its information
is searching the hostname (FQDN), stripped of the domain part in GLPI. For example
openshift01.wp.dach.local will be searched as openshift01.
The asset information will be displayed only when there’s a single search result. If multiple matches are found on GLPI, it’s possible to further filter results by status as detailed in the section below, to possibly end up with a single one.
Linking hosts to assets directly
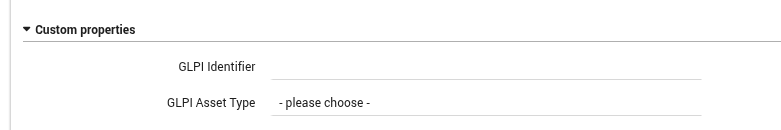
It is also possible to force the link between a host and a specific asset by specifying an Asset ID and Asset Type as custom variables in the host configuration Custom properties collapsable section.
Note
The Asset ID is the GLPI asset ID and can be found in the asset page URL in GLPI
(i.e. https://<neteye_addr>/glpi/front/computer.form.php?id=20), while the Asset Type
is the asset type in GLPI. Currently, only Computers and Network devices are supported.
Warning
Both Asset ID and Asset Type must be specified to link an asset directly to a host. If only one of them is provided, search by hostname will be performed as fallback instead.
Filtering search results by status
Since asset fields will be displayed only when there’s a single search result, it is possible to filter the assets retrieved by status to reduce the number of results.
It can be done globally at module configuration level, or on a per-tenant basis.
To do so globally, strings specifying active values can be provided at module configuration level in the
/neteye/shared/icingaweb2/conf/modules/assetmanagement/config.ini file, under the
[glpi-monitoring-integration] section, as a comma-separated string of values:
[glpi-monitoring-integration]
asset_status_active = "active,enabled,ok"
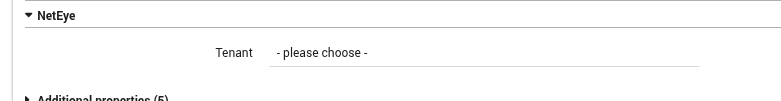
The same can also be done at Tenant level, which will override the global configuration at module level detailed above. To achieve that, a tenant must be specified in the NetEye collapsable section inside host configuration page:
Subsequently, the tenant-specific configuration can be set via the
new --override-glpi-asset-active-statuses option of the
neteye tenant config command. See neteye tenant for more information.
Asset displayable fields
By default, the following fields will be displayed in the monitoring host page:
Name |
The name of the asset in GLPI, should be the same as the hostname (minus the domain part). |
Type |
Only Computer and Network Equipment asset types are supported. |
Location |
The asset geographical location. |
Status |
The status assigned to that specific asset, filterable by custom values. |
Serial number |
The asset serial number. |
Inventory number |
The asset inventory number. |
Manufacturer |
The asset manufacturer. |
OS Name |
The name of the additional tab Operating systems in GLPI. |
OS Version |
The version of the additional tab Operating systems in GLPI. |
Technician |
The technician assigned to the asset. |
Alternate username |
The concatenation of Alternate username and Alternate username number of the asset. |
GLPI link |
Auto generated link to the asset in GLPI. |
Note
In the event the search returns multiple assets, a warning will be displayed along a link to the search results directly in GLPI.
Hide specific asset fields in host page
Specific fields can be omitted from the asset information displayed in the monitoring host page.
They can be specified globally at module configuration level, or on a per-tenant basis.
To do so globally, strings specifying active values can be provided at module configuration level in the
/neteye/shared/icingaweb2/conf/modules/assetmanagement/config.ini file, under the
[glpi-monitoring-integration] section, as a comma-separated string of values:
[glpi-monitoring-integration]
asset-hidden-fields = "name,type,serial"
The same can also be done at Tenant level, which will override the global configuration at module level detailed above. To achieve that, a tenant must be specified in the NetEye collapsable section inside host configuration page:
Subsequently, the tenant-specific configuration can be set via the
new --set-glpi-asset-hidden-fields option of the
neteye tenant config command. See neteye tenant for more information.
The list below is a reference of all fields that can be hidden, with their string identifiers in the configuration:
name |
is the identifier for the asset name field. |
type |
is the identifier for the asset type field. |
location |
is the identifier for the asset location field. |
status |
is the identifier for the asset status field. |
serial |
is the identifier for the asset serial number field. |
inventory |
is the identifier for the asset inventory number field. |
manufacturer |
is the identifier for the asset manufacturer field. |
os_name |
is the identifier for the asset OS name field. |
os_version |
is the identifier for the asset OS version field. |
technician |
is the identifier for the asset technician field. |
username |
is the identifier for the asset alternate username and Alternate username number fields. |
link |
is the identifier for the asset GLPI link field. |