User Guide Functional Overview Requirements Architecture System Installation NetEye Additional Components Installation Setup The neteye Command Director NetEye Self Monitoring Tornado Business Service Monitoring IT Operation Analytics - Telemetry Geo Maps NagVis Audit Log Shutdown Manager Reporting ntopng Visual Monitoring with Alyvix Elastic Stack IT Operations (Command Orchestrator) Asset Management Service Level Management Cyber Threat Intelligence - SATAYO NetEye Update & Upgrade How To NetEye Extension Packs Troubleshooting Security Policy Glossary
module icon Tornado
Concepts Collecting Events Add a Filter Node WHERE Conditions Iterating over Event fields Retrieving Payload of an Event Extract Variables Create a Rule Tornado Actions Test your Configuration Export and Import Configuration Example Under the hood Development Retry Strategy Configuration Thread Pool Configuration API Reference
Director NetEye Self Monitoring Tornado Business Service Monitoring IT Operation Analytics - Telemetry Geo Maps NagVis Audit Log Shutdown Manager Reporting Introduction to NetEye Monitoring Business Service Monitoring IT Operation Analytics Visualization Network Visibility Log Management & Security Orchestrated Datacenter Shutdown Application Performance Monitoring User Experience Service Management Service Level Management & Reporting Requirements for a Node Cluster Requirements and Best Practices NetEye Satellite Requirements TCP and UDP Ports Requirements Additional Software Installation Introduction Single Node Cluster NetEye Master Master-Satellite Architecture Underlying Operating System Acquiring NetEye ISO Image Installing ISO Image Single Nodes and Satellites Cluster Nodes Configuration of Tenants Satellite Nodes Only Nodes behind a Proxy Additional NetEye Components Single Node Cluster Node Satellites Nodes only Verify if a module is running correctly Accessing the New Module Cluster Satellite Security Identity and Access Management External Identity Providers Configure federated LDAP/AD Emergency Reset of Keycloak Configuration Advanced Configuration Authorization Resources Tuning Advanced Topics Basic Concepts & Usage Advanced Topics Monitoring Environment Templates Monitored Objects Import Monitored Objects Data Fields Deployment Icinga 2 Agents Configuration Baskets Dashboard Monitoring Status VMD Permissions Notifications Jobs API Configuring Icinga Monitoring Retention Policy NetEye Self Monitoring 3b Concepts Collecting Events Add a Filter Node WHERE Conditions Iterating over Event fields Retrieving Payload of an Event Extract Variables Create a Rule Tornado Actions Test your Configuration Export and Import Configuration Example Under the hood Development Retry Strategy Configuration Thread Pool Configuration API Reference Configure a new Business Process Create your first Business Process Node Importing Processes Operators The ITOA Module Configuring User Permissions Telegraf Metrics in NetEye Telegraf Configuration Telegraf on Monitored Hosts Visualizing Dashboards Customizing Performance Graph The NetEye Geo Map Visualizer Map Viewer Configuring Geo Maps NagVis 3b Audit Log 3b Overview Shutdown Manager user Shutdown Manager GUI Shutdown Commands Advanced Topics Overview User Role Management Cube Use Cases ntopng and NetEye Integration Permissions Retention Advanced Topics Overview User Roles Nodes Test Cases Dashboard Use Cases Overview Architecture Authorization Elasticsearch Overview Enabling El Proxy Sending custom logs to El Proxy Configuration files Commands Elasticsearch Templates and Retentions El Proxy DLQ Blockchain Verification Handling Blockchain Corruptions El Proxy Metrics El Proxy Security El Proxy REST Endpoints Agents Logstash Elastic APM Elastic RUM Log Manager - Deprecated Overview Authorization in the Command Orchestrator Module Configuring CLI Commands Executing Commands Overview Permissions Installation Single Tenancy Multitenancy Communication through a Satellite Asset collection methods Display asset information in monitoring host page Overview Customers Availability Event Adjustment Outages Resource Advanced Topics Introduction Getting Started SATAYO Items Settings Managed Service Mitre Attack Coverage Changelog Before you start Update Procedure Single Node Upgrade from 4.41 to 4.42 Cluster Upgrade from 4.41 to 4.42 Satellite Upgrade from 4.41 to 4.42 DPO machine Upgrade from 4.41 to 4.42 Create a mirror of the RPM repository Sprint Releases Feature Troubleshooting Tornado Networking Service Management - Incident Response IT Operation Analytics - Telemetry Identity Provider (IdP) Configuration Introduction to NEP Getting Started with NEPs Online Resources Obtaining NEP Insights Available Packages Advanced Topics Upgrade to NetEye 4.31 Setup Configure swappiness Restarting Stopped Services Enable stack traces in web UI How to access standard logs Director does not deploy when services assigned to a host have the same name How to enable/disable debug logging Activate Debug Logging for Tornado Modules/Services do not start Sync Rule fails when trying to recreate Icinga object How to disable InfluxDB query logging Managing an Elasticsearch Cluster with a Full Disk Some logs are not indexed in Elasticsearch Elasticsearch is not functioning properly Reporting: Error when opening a report Debugging Logstash file input filter Bugfix Policy Reporting Vulnerabilities Glossary 3b

Configuration Example

In order to showcase how the functionality provided within the Processing Tree can be used to configure Tornado, the following use-case will serve as a basis for a configuration example.

Understanding the Use Case

As a user I want to be able to passively monitor a host that sends SNMP trap with the status of its backup operations.

In order to perform this, we need to configure Tornado to receive SNMP events, make Tornado create the host if it does not exist, and set the status based on the result of the backup operation.

Prerequisites: The Edit mode is ON; the tenant is chosen in accordance with the application of the configuration.

Step 1. Create a Filter node to match SNMP Trap events

For the start a dedicated Filter node that would match all events of a particular type - SNMP Traps in this case - is to be created. For that, use the following operators:

{
  "type": "AND",
  "operators": [
    {
      "type": "equals",
      "first": "${event.type}",
      "second": "snmptrapd"
    }
  ]
}

You can also additionally create a Filter to match the events coming from a particular IP source, or create a dedicated rule for it in the following steps.

Step 2. Create a Ruleset node

Now, as the Processing Tree is organized to catch SNMP Traps, optionally from a particular IP source, it is time to create a Ruleset and include a set of rules to process the events.

Name a Ruleset and procees to creating the first Rule winthin a Ruleset.

Step 3. Create a Rule to extract the variables required for defining an action in the following Rules.

In order to be able to define the action in a dedicated rule, it is first neccessary to extract the variables from the payoload of the event. Assuming the payload of an event is

{
    "dest_ip": "248.75.100.221",
    "oids": {
      "DISMAN-EVENT-MIB::sysUpTimeInstance": {
        "content": "(1617618274) 187 days, 5:23:02.74",
        "datatype": "Timeticks"
      },
      "SNMPv2-MIB::snmpTrapOID.0": {
        "content": "SNMPv2-SMI::enterprises.14604.2.2.0.1003",
        "datatype": "OID"
      },
      "SNMPv2-SMI::enterprises.14604.2.2.2.10.0": {
        "content": "default",
        "datatype": "STRING"
      },
      "SNMPv2-SMI::enterprises.14604.2.2.2.18.0": {
        "content": "3",
        "datatype": "INTEGER"
      },
      "SNMPv2-SMI::enterprises.14604.2.2.2.3.0": {
        "content": "Data Protection - Job Succeeded",
        "datatype": "STRING"
      }
    },
    "protocol": "UDP",
    "src_ip": "248.75.100.221",
    "src_port": "58953"
 }

in the ‘With’ clause create separate extractors for hostname, checkResult and DetectedCriteria:

../../_images/with_operators.jpg
{
   "HostName": {
       "from": "${event.payload.oids.\"SNMPv2-SMI::enterprises.14604.2.2.2.7.0\".content}",
       "regex": {
         "type": "Regex",
         "match": ".*",
         "group_match_idx": 0,
         "all_matches": false
       },
       "modifiers_post": [
         {
           "type": "Lowercase"
         }
       ]
    },
    "checkResult": {
        "from": "\n${event.payload.oids.\"SNMPv2-SMI::enterprises.14604.2.2.2.17.0\".content}",
        "regex": {
           "type": "Regex",
           "match": "(?m)^Detected Criteria: (.*\\w)\\s*$",
           "group_match_idx": 1,
           "all_matches": false
        },
        "modifiers_post": []
    },
    "DetectedCriteria": {
       "from": "\n${event.payload.oids.\"SNMPv2-SMI::enterprises.14604.2.2.2.17.0\".content}",
       "regex": {
         "type": "Regex",
         "match": "(?m)^Detected Criteria: (.*\\w)\\s*$",
         "group_match_idx": 1,
         "all_matches": false
        },
        "modifiers_post": [
            {
          "type": "Map",
          "mapping": {
            "Job Succeeded": "0",
            "Job Succeeded with Errors": "1",
            "No Backup for last [0-9]+ Days": "2"
          },
          "default_value": "def_val"
        }
      ]
    }
}

Step 4. Add a Rule to define Actions required to create a Host and assign the status based on the extracted extracted variables

Add a Rule within the same Ruleset and go to Actions tab. Choose SMART_MONITORING_CHECK_RESULT type of action from a dropdown with available options.

Define the following parameters:
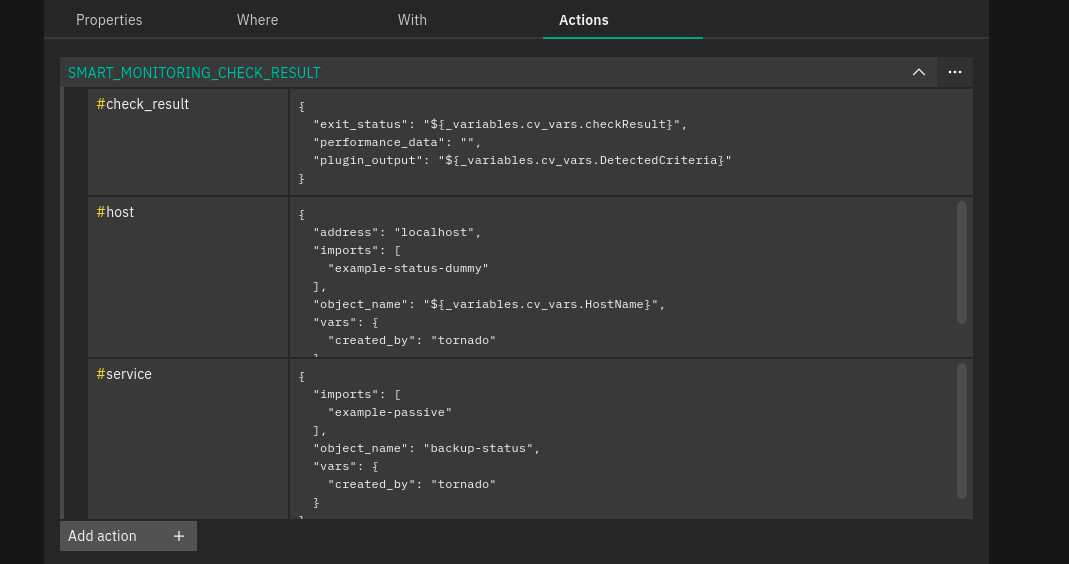
../../_images/actions.png
[
  {
    "id": "smart_monitoring_check_result",
    "payload": {
      "check_result": {
        "exit_status": "${_variables.cv_vars.DetectedCriteria}",
        "performance_data": "",
        "plugin_output": "${_variables.cv_vars.DetectedCriteria}"
      },
      "host": {
        "imports": "example-status-dummy",
        "object_name": "${_variables.cv_vars.HostName}",
        "vars": {
          "created_by": "tornado"
        }
      },
      "service": {
        "imports": "example-passive",
        "object_name": "backup-status",
        "vars": {
          "created_by": "tornado"
        }
      }
    }
  }
]

Step 5. Test Event whether it matches the rules you created within a ruleset.

Save the configuration and use Test Event panel in order to make sure the event matches the rules within the ruleset.

After all the changes have been saved, test the Event to see if the filter structure and rules conditions were configured properly.

Open test event panel and provide all neccessary event data, then Run test. You can find more details on testing events in Test your Configuration section.

../../_images/ruleset_matched.png

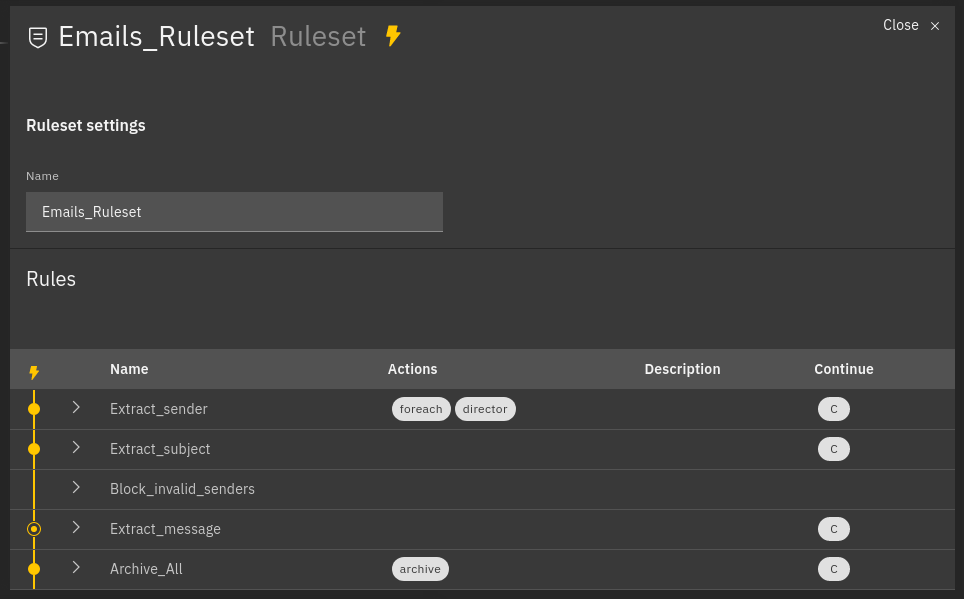
Fig. 123 Example of processed rules

  • Matched rules: Extract_sender, Extract_subject, Archive_all

  • Partially matched: Extract_message

  • Not matched: Block_invalid_senders

For each rule in the table, the extracted variables and the generated Action payloads are shown. Two other buttons are visible, one for cleaning all the fields of the form and one for cleaning the outcome of the test.

If you prefer to check if the host/service is actually created in the Dashboard and the status is assigned as a result of the match, enable the action execution in the Test Event panel when running a test.

Step 6. In case of a success, deploy the configuration to production.

This can be with the help of a deploy button in the top right corner of the Processing Tree layout, next to ‘Save’ option.

In the case of muliti-tenant environment, a deployed configuration is applied on a particular tenant it was created for. For a single-tenant environment, the configuration is applied to the Master Tenant only.

As result, a host/service is created in the Dashboard, monitoring result being mapped on Icinga Service.