Dashboard
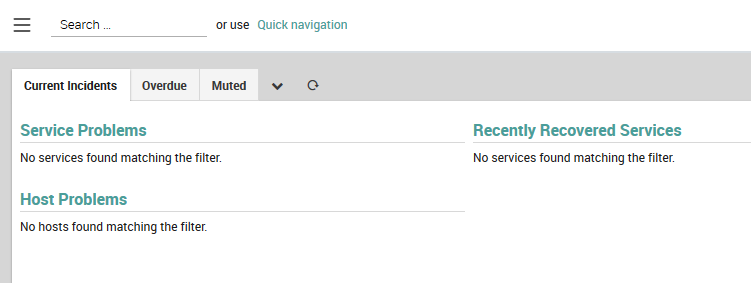
If you launch NetEye with no hosts or services configured, you will see the empty dashboard shown in Fig. 126.

Fig. 126 Empty Dashboard when NetEye is used for the first time.
At the top of the initial dashboard are three default dashboard tabs, which you can click on to switch between the dashboards. The initial dashboards will remain empty until you configure hosts and servers in Director:
Current Incidents: Contains dashlets that list Service Problems, Host Problems, and Recently Recovered Services.
Overdue:* Shows hosts and services with unreturned check results, and acknowledgments and downtimes lasting at least three days.
Muted: Contains notifications about disabled host and services, disabled checks, and acknowledged problems.
Next to the three tabs are two icons: a “Chevron” menu for
customizing the dashboards, and a
refresh button.
Note
If you would like to customize your dashboard, we recommend that you start with a clean dashboard rather than a system-provided one.
The dashboard customization menu has two options:
Add dashlet: Add a dashlet to the currently selected dashboard. A dashlet can be any view within Icinga2 that has an associated URL.
Settings: This will display a panel allowing you to customize the currently selected dashboard by removing the current elements and sorting your custom elements (only your customized elements can be sorted).
Dashlets
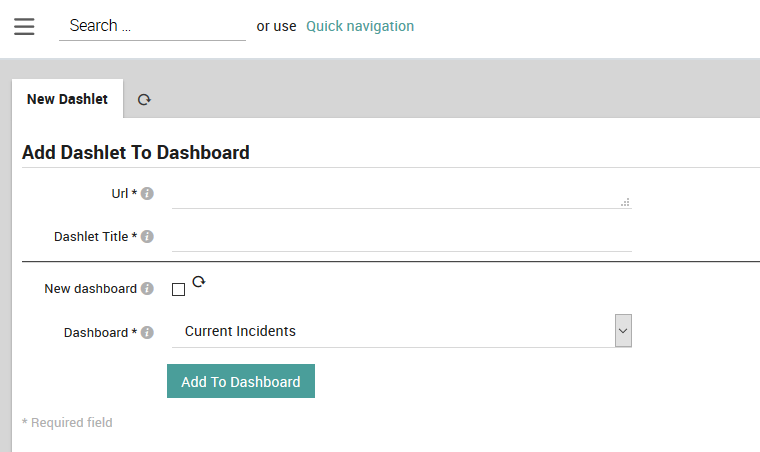
Dashlets are the individual panels on a dashboard. To add a dashlet (see Fig. 127), follow these steps:
Copy the URL of the view you want to add from the browser’s URL bar while that view is open.
Go to the desired Dashboard, select “Add Dashlet” from the Chevron menu, and paste the URL from the previous step in the “Url” field. The URL can include filters and other options.
Give the dashlet a display title.
Check the box if you want to add it instead to a brand new dashboard (if so, give the new dashboard a title in the next field).
Otherwise, choose the dashboard you want to add the dashlet to from the list box.
Finally, click on the green “Add To Dashboard” button. Your new dashlet should now be visible on the selected dashboard.

Fig. 127 The panel to add a new dashlet.
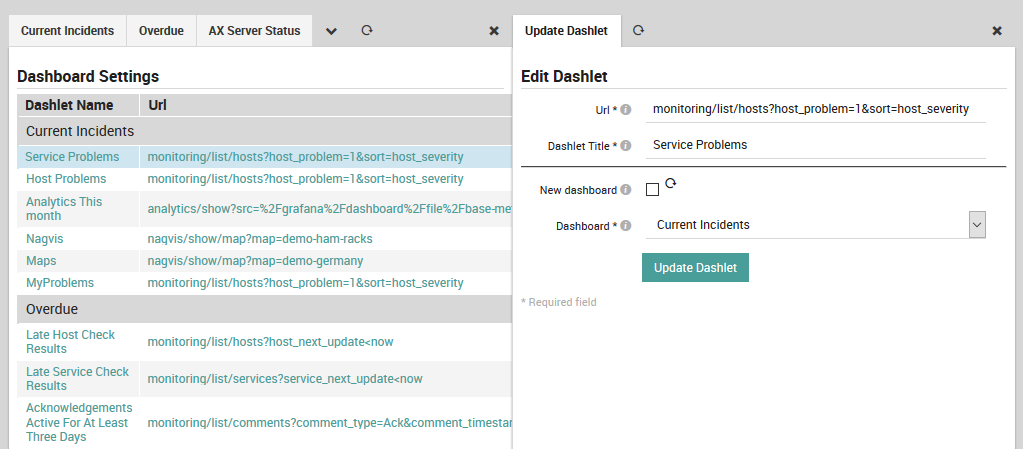
To add a new dashboard, select a view, copy its URL, and follow the procedure above to add a dashlet to a new dashboard. To customize your dashboard, select the Settings menu option, which will display the customization panel shown in Fig. 128. In NetEye you can:
Remove a dashboard or dashlet by clicking on the corresponding trash can icon
to the right.
Reorder dashlets by using the up- and down-arrows
,
shown at the right side of Fig. 128. Note that while you can remove the default dashlets, you cannot reorder them. The first dashlet is displayed at the top left of the dashboard, and each subsequent dashlet is shown to the right of the previous one until it wraps around to the next row. To completely customize your dashboard, you should start with a new, blank one.
Edit a dashlet in a dashboard by clicking on the corresponding dashlet name to the left, as shown in Fig. 129
Modify a dashlet’s behavior by clicking on the dashlet’s URL as shown in Fig. 130, for example to change the filtering and search parameters.

Fig. 128 The dashboard customization panel.

Fig. 129 Editing a dashlet.

Fig. 130 Modifying a dashlet’s behavior.

