Network Visibility
In this section you can learn how NetEye can check, monitor, and store data about the traffic flowing through it. These functionalities are provided by ntopng, which seamlessly integrates in NetEye.
Concepts
Overview of ntopng and NetEye Integration
NetEye includes the ntopng software to allow for inspection of networks flows. The module can be accessed using Single Sign On.
On NetEye, both ntopng and nProbe are running, with the latter being in Collector Mode, i.e., it only collects flows sent to the 6363 port and sends them to ntopng. Flows are collected by nProbe from any capable network device–including, but not limited to, switches, servers, printers, workstations) that can be reached within the local networks accessible by NetEye.
Collected flows are sent to ntopng as ZMQ streams and processed; if additional nProbes are installed on the local network, they can be configured as well to send their flows to ntopng.
The official documentation of ntopng and nProbe contains more information about their architecture.
The user interface on ntopng can be reached by clicking on the menu item on the left-hand side. Depending on the roles of the users accessing the module, the available options and features accessible may vary. Please check the next section for more details about the permissions.
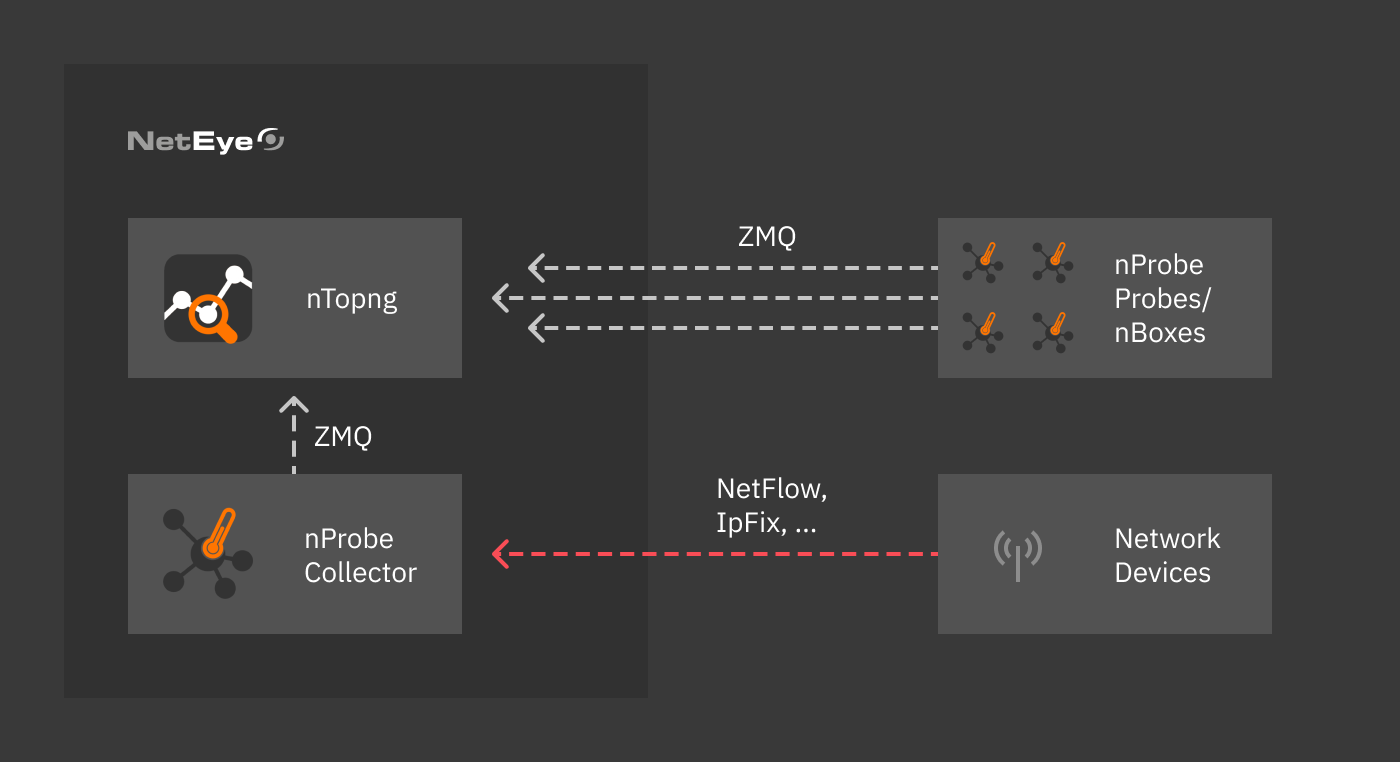
Fig. 139 NetEye - ntopng schema
Configuration
Permissions
Like for all other modules, the Full Module Access and General Module Access permissions are available for the ntopng module, mapped to the Administrator and Non Privileged user roles in ntopng, respectively. An Administrator will have full access to all the modules’ functionalities and will not be subject to the restrictions listed below.
An additional Permission is peculiar to this module, namely pcap-download, that allows download .pcap file captured by ntopng.
There are two Restrictions available for this module:
allowed-interfaces is used to mark which interfaces are available to the role. Wildcard can be used, default is
tcp://*:5556c. The trailingcis important as it lets ntopng act as a collector.allowed-networks allows access only to those flows originating from the given (local) networks
Note
In ntopng only one interface can be set as a restriction. For this
reason, if a user has multiple roles and each role has an interface set in the
restriction, the user will only be able to see the first interface.
In case the wildcard * is set in at least one of the roles,
the user will be able to see all the interfaces.
Advanced Topics
Using ntopng with InfluxDB
ntopng can be configured to work with InfluxDB to write and read timeseries data. To configure it, follow the following steps.
Open ntopng from NetEye (
Sidebar menu >> ntopng) and then, in ntopng click on theSettings >> Preferencesoption in the left menu bar.Now, go to timeseries preference option and configure these settings:
Timeseries Driver: InfluxDB 1.x
InfluxDB Url: http://<influxdb-domain>:8086
InfluxDB Database: <database-name> i.e. ntopng
If you are using authentication credentials to secure InfluxDB, then enable the
InfluxDB Authenticationoption and add the credentials. Default value is disable.Configure the timeseries options (i.e., Interface Timeseries, Local Hosts Timeseries, Devices Timeseries and Other Timeseries) according to your preferences
Click on
Savebutton to save the preference configuration.
Once done, you will see the folder created under the
/neteye/shared/influxdb/data/data/ location. Moreover, logs
written successfully will be available when you run journalctl -u
influxdb -f, like in this example:
Aug 31 11:02:31 lenovo31 influxd[476]: [httpd] ::1 - - [31/Aug/2020:11:02:31 +0200] "POST /write?db=ntopng HTTP/1.1" 204 0 "-" "-" 2bd62e84-76f0-11e9-801c-f0761cfbf2d8 8555
The official documentation of ntopng timeseries with influxdb contains more information about the preference’s configuration.
Create grafana datasource to access timeseries data
The ntopng time-series historical data stored in the InfluxDB can also be used by ITOA module to display the real-time network traffic and flow collection performance metrics.
But first, you need to configure a new data source in Grafana to access that historical data. To configure it, follow the following steps.
Open ITOA Dashboard in NetEye and then select Data Sources option from the configuration menu.
Click on the Add data source button and then select InfluxDB from the Time series database list.
Now, configure these settings:
Name: <datasource-name> i.e ntop-influx
URL: http://<influxdb-domain>:8086
Database: <database-name> i.e. ntopng
User: admin
Note
The InfluxDB URL and Database name should be exactly the
same as you used in ntopng (ntopng >> Settings >> Preferences >>
Timeseries)
Troubleshooting
If the <database-name> folder does not exists in the specified
location /neteye/shared/influxdb/data/data/ or if POST /write
messages are not available, then from the ntopng timeseries
preferences, switch the timeseries driver to RRD, then back to
InfluxDB and restart the ntopng service.
This website uses cookies that store your theme preferences. These cookies do not store any personally identifiable data.